|
시장보고서
상품코드
1734970
민간 수도사업자(IOU) : 시장 점유율, 동향, 기업 순위Investor-Owned Utilities in Water: Market Share, Trends, and Company Rankings |
||||||
미국의 상하수도 사업 환경은 크게 양분되어 있고 4만 8,858개의 도시 상수도 시스템(CWS)이 약 3억 1,880만 명에게, 2만 3,968개의 하수처리시설이 약 2억 6,710만 명에게 서비스를 제공하고 있습니다. 이러한 상황에서 민간 수도사업자(IOU)들이 M&A와 유기적 성장을 통해 지역적/전국적 지위(규제 적용/비적용)를 확보하며 시장을 재편하고 있습니다.
주요 IOU 기업에는 상장 기업, 사모펀드 지원 기업, 비상장 기업 등 20개사가 포함되어 있으며, 현재 미국 인구의 약 5%에게 서비스를 제공하고 있습니다. 주목할 만한 점은 이들 수도사업자의 자산 중 87%가 3,300명 미만의 사람들에게 서비스를 제공하고 있다는 점입니다.
도시 관리자와 수도사업자의 리더들이 인력 제약, 규제 문제(예: PFAS) 및 증가하는 자본 투자 요구와 관련된 증가하는 과제에 직면하고 있는 가운데, IOU는 중요한 상하수도 인프라를 관리할 수 있는 대안적 접근 방식을 제공하고 있습니다. IOU의 전략에는 M&A를 통해 상하수도 자산의 재무적 책임과 관리 책임을 인수하는 것이 포함되며, 일부 주에서는 공정시장가치(FMV) 법과 같은 유리한 정책에 의해 촉진되고 있습니다.
본 보고서에서는 미국의 상하수도 시장에 대해 조사 분석하여, 규제 적용 상하수도 사업자 부문의 민간 진출 현황과 주요 IOU 20개사의 시장 점유율, 주목할 만한 시장 동향 및 촉진요인 등의 정보를 제공합니다.
미국의 IOU 시장 점유율 및 재무

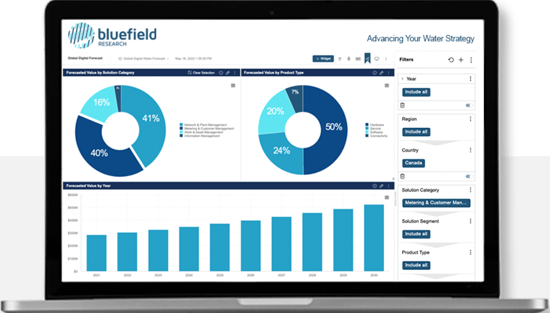
데이터는 이 IOU 분석의 주요 요소입니다. 우리 팀은 관련 데이터 대시보드를 만들었습니다.
소개할 기업
|
|
범위: 민간 투자, 미국 및 캐나다, 하수도, 상수도 M&A
목차
섹션 1 - IOU 시장 개요
- 미국의 상하수도 사업자 상황
- 통합 촉진요인
- 주요 사건 타임라인
- 추가 연결 수 리더
- IOU 요금 사례
- 경쟁 구도
- 설비 투자
- 경영비
섹션 2 - 시장 점유율과 기업 개요
- 총 연결 수 상위 IOU
- 주요 IOU : 주별
- IOU 순위와 시장 점유율
- American States Water Company
- American Water Works Company
- Arizona Water Company
- Artesian Water Company
- California Water Service Group
- Central States Water Resources
- EPCOR
- Essential Utilities(Aqua)
- Eversource Energy(Aquarion Water Company)
- Global Water Resources
- H2O America(formerly SJW Group)
- JW Water Holdings
- Liberty Utilities
- Middlesex Water Company
- Nexus Water Group
- NW Natural
- San Gabriel Valley Water Company
- Utility Holdings, Inc.
- Veolia North America
- York Water Company
The U.S. water and wastewater utility landscape is heavily fragmented, comprising 48,858 community water systems (CWSs) that serve an estimated 318.8 million people and 23,968 wastewater treatment facilities serving an estimated 267.1 million people. Within this landscape, an evolving roster of investor-owned utilities (IOUs) is reshaping the market by establishing regional and national positions (regulated and unregulated) through mergers and acquisitions (M&A) and organic growth.
The leading IOUs, which include 20 publicly traded, private equity-backed, and privately owned companies, currently serve approximately 5% of the U.S. population. Notably, an estimated 87% of these utilities' assets serve populations of fewer than 3,300 people.
As city managers and utility leaders confront increasing challenges related to workforce constraints, regulatory issues (e.g., per and polyfluoroalkyl substances [PFAS]), and mounting capital investment needs, IOUs offer an alternative approach for managing critical water and sewer infrastructure. Their strategies involve taking on the financial and operational responsibilities of water and wastewater assets through M&A, which in some states is bolstered by favorable policies like fair market value (FMV) legislation.
This market Insight Report examines the state of private participation in the regulated water and wastewater utility sector, profiling and analyzing market share among the 20 leading IOUs while highlighting key drivers and trends to watch.
U.S. IOU Market Share and Financials:

Data is a key component to this IOU analysis. Our team has compiled a relevant data dashboard.
Companies Mentioned:
|
|
Coverage: Private Investment, US & Canada, Wastewater, Water M&A.
Table of Contents
Section 1 - IOU Market Overview
- U.S. Water and Wastewater Utility Landscape
- Consolidation Drivers
- Timeline of Key Events
- Leaders in Connections Added
- IOU Rate Cases
- Competitive Landscape
- Capital Expenditures
- Operating Expenses
Section 2 - Market Share and Company Profiles
- Top IOUs by Total Connections
- Leading IOUs by State
- IOU Ranking and Market Share
- American States Water Company
- American Water Works Company
- Arizona Water Company
- Artesian Water Company
- California Water Service Group
- Central States Water Resources
- EPCOR
- Essential Utilities (Aqua)
- Eversource Energy (Aquarion Water Company)
- Global Water Resources
- H2O America (formerly SJW Group)
- JW Water Holdings
- Liberty Utilities
- Middlesex Water Company
- Nexus Water Group
- NW Natural
- San Gabriel Valley Water Company
- Utility Holdings, Inc.
- Veolia North America
- York Water Company


