
|
시장보고서
상품코드
1729688
기업 아키텍처 소프트웨어 시장 : 컴포넌트별, 솔루션 유형별, 지역별Enterprise Architecture Software Market, By Component, By Solution Type, By Geography |
||||||
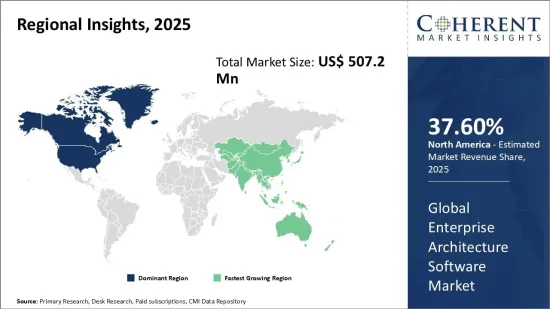
세계의 기업 아키텍처 소프트웨어 시장은 2025년에는 5억 720만 달러로 추정되며, 2032년에는 9억 6,970만 달러에 달할 것으로 예측되며, 2025-2032년의 CAGR은 9.6%로 성장할 것으로 예측됩니다.
| 리포트 범위 | 리포트 상세 | ||
|---|---|---|---|
| 기준연도 | 2024년 | 2025년 시장 규모 | 5억 720만 달러 |
| 실적 데이터 | 2020-2024년 | 예측 기간 | 2025-2032년 |
| 예측 기간 : 2025-2032년 CAGR : | 9.60% | 2032년 가치 예측 | 9억 6,970만 달러 |

세계 기업 아키텍처 소프트웨어 시장은 최근 수년간 괄목할 만한 성장세를 보이고 있습니다. 기업 아키텍처는 기업의 미래 상태를 기술하고 그 진화를 가능하게 하는 주요 원칙과 모델을 생성, 전달, 개선함으로써 비즈니스 비전과 전략을 효과적인 기업 혁신으로 전환하는 과정입니다. 기업 아키텍처 소프트웨어는 IT 인프라, 용도, 비즈니스 프로세스에 대한 청사진을 구축 및 유지하여 비즈니스 혁신을 추진하는 조직을 지원합니다. 이러한 청사진은 기업 전략 실행, 업무 전술, 정보 기술 투자, 성과 성과로 연결되는 디지털 참조 모델 역할을 합니다. 이 소프트웨어는 정보 시스템, 용도, 기술을 비즈니스 운영에 통합할 수 있는 기능을 제공합니다. 기업이 디지털 혁신과 자동화에 점점 더 집중함에 따라 기업 아키텍처 소프트웨어에 대한 수요는 향후 수년간 크게 증가할 것으로 예측됩니다.
시장 역학:
세계 기업 아키텍처 소프트웨어 시장은 IT와 비즈니스 목표의 일치와 비즈니스 프로세스 간소화에 대한 요구가 증가함에 따라 성장세를 보이고 있습니다. 기업 아키텍처 소프트웨어는 기업이 기업의 전체상을 파악하고 정보에 입각한 전략적 의사결정을 내릴 수 있도록 도와주며, IT 환경이 복잡해지고 클라우드 및 하이브리드 IT 모델의 채택이 증가함에 따라 기업은 리소스를 효율적으로 관리하기 위해 아키텍처 계획 툴을 도입해야 합니다. 아키텍처 계획 툴을 도입해야 할 필요성이 대두되고 있습니다. 그러나 기업 아키텍처의 개발 및 유지보수와 관련된 높은 비용은 시장 성장을 저해할 수 있습니다. 로우코드 용도 증가 추세는 벤더들이 통합된 제품을 제공할 수 있는 기회를 창출하고 있습니다. 또한 기업 모델링 및 가치 흐름 매핑에 대한 수요 증가는 시장 진입 업체들에게 유리하게 작용하고 있습니다.
본 조사의 주요 특징
- 세계의 기업 아키텍처 소프트웨어(Enterprise Architecture Software) 시장에 대해 조사 분석했으며, 2024년을 기준 연도로 하여 예측 기간(2025-2032년) 시장 규모와 연평균 성장률(CAGR)을 조사하여 정리하여 전해드립니다.
- 또한 다양한 부문에 걸친 잠재적 매출 기회를 밝히고, 이 시장의 매력적인 투자 제안 매트릭스를 설명합니다.
- 또한 시장 성장 촉진요인, 억제요인, 기회, 신제품 출시 및 승인, 시장 동향, 지역별 전망, 주요 기업의 경쟁 전략 등에 대한 중요한 인사이트을 제공합니다.
- 이 보고서는 기업 하이라이트, 제품 포트폴리오, 주요 하이라이트, 재무 성과, 전략 등의 매개 변수를 기반으로 세계 기업 아키텍처 소프트웨어 시장의 주요 기업 개요을 제공합니다.
- 이 보고서의 인사이트를 통해 마케팅 담당자와 기업 경영진은 향후 제품 출시, 유형화, 시장 확대, 마케팅 전술에 대한 정보에 입각한 의사결정을 내릴 수 있습니다.
- 기업 아키텍처 소프트웨어 세계 시장 보고서는 투자자, 공급업체, 제품 제조업체, 유통업체, 신규 시장 진출기업, 재무 분석가 등 다양한 이해관계자를 대상으로 합니다.
목차
제1장 조사의 목적과 전제조건
- 조사 목적
- 전제조건
- 약어
제2장 시장 전망
- 리포트 설명
- 시장의 정의와 범위
- 개요
제3장 시장 역학, 규제, 동향 분석
- 시장 역학
- 영향 분석
- 주요 하이라이트
- 규제 시나리오
- 제품의 발매/승인
- PEST 분석
- PORTER의 산업 분석
- 시장 기회
- 규제 시나리오
- 주요 발전
- 업계 동향
제4장 세계의 기업 아키텍처 소프트웨어 시장, 컴포넌트별, 2020-2032년
- 솔루션
- 서비스
제5장 세계의 기업 아키텍처 소프트웨어 시장, 솔루션 유형별, 2020-2032년
- 애플리케이션 아키텍처
- 인프라 아키텍처
- 데이터 아키텍처
- 보안 아키텍처
- 기타
제6장 세계의 기업 아키텍처 소프트웨어 시장, 지역별, 2020-2032년, 가치
- 북미
- 미국
- 캐나다
- 라틴아메리카
- 브라질
- 아르헨티나
- 멕시코
- 기타 라틴아메리카
- 유럽
- 독일
- 영국
- 스페인
- 프랑스
- 이탈리아
- 러시아
- 기타 유럽
- 아시아태평양
- 중국
- 인도
- 일본
- 호주
- 한국
- ASEAN
- 기타 아시아태평양
- 중동
- GCC 국가
- 이스라엘
- 기타 중동
- 아프리카
- 남아프리카공화국
- 북아프리카
- 중앙아프리카
제7장 경쟁 구도
- Software AG
- Avolution
- BiZZdesign
- MEGA International
- BOC Group
- Orbus Software
- QualiWare
- LeanIX
- Erwin(Quest Software)
- Sparx Systems
- ValueBlue
- UNICOM Global
- Clausmark
- Enterprise Architecture Solutions
- Planview
제8장 애널리스트의 권장사항
- 운명의 수레바퀴
- 애널리스트의 견해
- COM(Coherent Opportunity Map)
제9장 참고 문헌과 조사 방법
- 참고 문헌
- 조사 방법
- 출판사 소개
Global Enterprise Architecture Software Market is estimated to be valued at USD 507.2 Mn in 2025 and is expected to reach USD 969.7 Mn by 2032, growing at a compound annual growth rate (CAGR) of 9.6% from 2025 to 2032.
| Report Coverage | Report Details | ||
|---|---|---|---|
| Base Year: | 2024 | Market Size in 2025: | USD 507.2 Mn |
| Historical Data for: | 2020 To 2024 | Forecast Period: | 2025 To 2032 |
| Forecast Period 2025 to 2032 CAGR: | 9.60% | 2032 Value Projection: | USD 969.7 Mn |
The global enterprise architecture software market is witnessing significant growth in the recent times. Enterprise architecture is the process of translating business vision and strategy into effective enterprise change by creating, communicating, and improving the key principles and models that describe the enterprise's future state and enable its evolution. Enterprise architecture software helps organizations in building and maintaining blueprints of their IT infrastructure, applications and business processes to drive business transformation. These blueprints serve as a digital reference model that links corporate strategy with execution, operational tactics, information technology investment, and performance outcomes. The software provides capabilities for integrating information systems, applications, and technologies with business operations. With enterprises focusing increasingly on digital transformation and automation, the demand for enterprise architecture software is expected to rise considerably in the coming years.
Market Dynamics:
The global enterprise architecture software market is driven by the growing need for aligning IT with business objectives and streamlining business processes. Enterprise architecture software helps organizations gain a holistic view of the enterprise to make informed strategic decisions. The increasing complexity of IT landscape and growing adoption of cloud and hybrid IT models are compelling enterprises to implement architecture planning tools for efficient management of resources. However, high costs associated with enterprise architecture development and maintenance can restrain market growth. Growing trend of low-code applications is creating opportunities for vendors to come up with integrated offerings. Rising demand for enterprise modeling and value stream mapping also works in favor of market players.
Key Features of the Study:
- This report provides in-depth analysis of the global enterprise architecture software market, and provides market size (US$ Million) and compound annual growth rate (CAGR%) for the forecast period (2025-2032), considering 2024 as the base year
- It elucidates potential revenue opportunities across different segments and explains attractive investment proposition matrices for this market
- This study also provides key insights about market drivers, restraints, opportunities, new product launches or approvals, market trends, regional outlook, and competitive strategies adopted by key players
- It profiles key players in the global enterprise architecture software market based on the following parameters - company highlights, products portfolio, key highlights, financial performance, and strategies
- Key companies covered as a part of this study include Software AG, Avolution, BiZZdesign, MEGA International, BOC Group, Orbus Software, QualiWare, LeanIX, Erwin (Quest Software), Sparx Systems, ValueBlue, UNICOM Global, Clausmark, Enterprise Architecture Solutions, and Planview
- Insights from this report would allow marketers and the management authorities of the companies to make informed decisions regarding their future product launches, type up-gradation, market expansion, and marketing tactics
- The global enterprise architecture software market report caters to various stakeholders in this industry including investors, suppliers, product manufacturers, distributors, new entrants, and financial analysts
Market Segmentation
- Component Insights (Revenue, US$ Mn, 2020 - 2032)
- Solutions
- Services
- Solution Type Insights (Revenue, US$ Mn, 2020 - 2032)
- Application Architecture
- Infrastructure Architecture
- Data Architecture
- Security Architecture
- Others
- Regional Insights (Revenue, US$ Mn, 2020 - 2032)
- North America
- U.S.
- Canada
- Latin America
- Brazil
- Argentina
- Mexico
- Rest of Latin America
- Europe
- Germany
- U.K.
- Spain
- France
- Italy
- Russia
- Rest of Europe
- Asia Pacific
- China
- India
- Japan
- Australia
- South Korea
- ASEAN
- Rest of Asia Pacific
- Middle East
- GCC Countries
- Israel
- Rest of Middle East
- Africa
- South Africa
- North Africa
- Central Africa
- Company Profiles:
- Software AG
- Avolution
- BiZZdesign
- MEGA International
- BOC Group
- Orbus Software
- QualiWare
- LeanIX
- Erwin (Quest Software)
- Sparx Systems
- ValueBlue
- UNICOM Global
- Clausmark
- Enterprise Architecture Solutions
- Planview
Table of Contents
1. Research Objectives and Assumptions
- Research Objectives
- Assumptions
- Abbreviations
2. Market Purview
- Report Description
- Market Definition and Scope
- Executive Summary
- Global Enterprise Architecture Software Market, By Component
- Global Enterprise Architecture Software Market, By Solution Type
- Global Enterprise Architecture Software Market, By Region
3. Market Dynamics, Regulations, and Trends Analysis
- Market Dynamics
- Impact Analysis
- Key Highlights
- Regulatory Scenario
- Product Launches/Approvals
- PEST Analysis
- PORTER's Analysis
- Market Opportunities
- Regulatory Scenario
- Key Developments
- Industry Trends
4. Global Enterprise Architecture Software Market, By Component, 2020-2032, (US$ Mn)
- Introduction
- Market Share Analysis, 2025 and 2032 (%)
- Y-o-Y Growth Analysis, 2021 - 2032
- Segment Trends
- Solutions
- Introduction
- Market Size and Forecast, and Y-o-Y Growth, 2020-2032, (US$ Mn)
- Services
- Introduction
- Market Size and Forecast, and Y-o-Y Growth, 2020-2032, (US$ Mn)
5. Global Enterprise Architecture Software Market, By Solution Type, 2020-2032, (US$ Mn)
- Introduction
- Market Share Analysis, 2025 and 2032 (%)
- Y-o-Y Growth Analysis, 2021 - 2032
- Segment Trends
- Application Architecture
- Introduction
- Market Size and Forecast, and Y-o-Y Growth, 2020-2032, (US$ Mn)
- Infrastructure Architecture
- Introduction
- Market Size and Forecast, and Y-o-Y Growth, 2020-2032, (US$ Mn)
- Data Architecture
- Introduction
- Market Size and Forecast, and Y-o-Y Growth, 2020-2032, (US$ Mn)
- Security Architecture
- Introduction
- Market Size and Forecast, and Y-o-Y Growth, 2020-2032, (US$ Mn)
- Others
- Introduction
- Market Size and Forecast, and Y-o-Y Growth, 2020-2032, (US$ Mn)
6. Global Enterprise Architecture Software Market, By Region, 2020 - 2032, Value (US$ Mn)
- Introduction
- Market Share (%) Analysis, 2025, 2028 & 2032, Value (US$ Mn)
- Market Y-o-Y Growth Analysis (%), 2021 - 2032, Value (US$ Mn)
- Regional Trends
- North America
- Introduction
- Market Size and Forecast, By Component, 2020 - 2032, Value (US$ Mn)
- Market Size and Forecast, By Solution Type, 2020 - 2032, Value (US$ Mn)
- Market Size and Forecast, By Country, 2020 - 2032, Value (US$ Mn)
- U.S.
- Canada
- Latin America
- Introduction
- Market Size and Forecast, By Component, 2020 - 2032, Value (US$ Mn)
- Market Size and Forecast, By Solution Type, 2020 - 2032, Value (US$ Mn)
- Market Size and Forecast, By Country, 2020 - 2032, Value (US$ Mn)
- Brazil
- Argentina
- Mexico
- Rest of Latin America
- Europe
- Introduction
- Market Size and Forecast, By Component, 2020 - 2032, Value (US$ Mn)
- Market Size and Forecast, By Solution Type, 2020 - 2032, Value (US$ Mn)
- Market Size and Forecast, By Country, 2020 - 2032, Value (US$ Mn)
- Germany
- U.K.
- Spain
- France
- Italy
- Russia
- Rest of Europe
- Asia Pacific
- Introduction
- Market Size and Forecast, By Component, 2020 - 2032, Value (US$ Mn)
- Market Size and Forecast, By Solution Type, 2020 - 2032, Value (US$ Mn)
- Market Size and Forecast, By Country, 2020 - 2032, Value (US$ Mn)
- China
- India
- Japan
- Australia
- South Korea
- ASEAN
- Rest of Asia Pacific
- Middle East
- Introduction
- Market Size and Forecast, By Component, 2020 - 2032, Value (US$ Mn)
- Market Size and Forecast, By Solution Type, 2020 - 2032, Value (US$ Mn)
- Market Size and Forecast, By Country, 2020 - 2032, Value (US$ Mn)
- GCC Countries
- Israel
- Rest of Middle East
- Africa
- Introduction
- Market Size and Forecast, By Component, 2020 - 2032, Value (US$ Mn)
- Market Size and Forecast, By Solution Type, 2020 - 2032, Value (US$ Mn)
- Market Size and Forecast, By Country/Region, 2020 - 2032, Value (US$ Mn)
- South Africa
- North Africa
- Central Africa
7. Competitive Landscape
- Software AG
- Company Highlights
- Product Portfolio
- Key Developments
- Financial Performance
- Strategies
- Avolution
- Company Highlights
- Product Portfolio
- Key Developments
- Financial Performance
- Strategies
- BiZZdesign
- Company Highlights
- Product Portfolio
- Key Developments
- Financial Performance
- Strategies
- MEGA International
- Company Highlights
- Product Portfolio
- Key Developments
- Financial Performance
- Strategies
- BOC Group
- Company Highlights
- Product Portfolio
- Key Developments
- Financial Performance
- Strategies
- Orbus Software
- Company Highlights
- Product Portfolio
- Key Developments
- Financial Performance
- Strategies
- QualiWare
- Company Highlights
- Product Portfolio
- Key Developments
- Financial Performance
- Strategies
- LeanIX
- Company Highlights
- Product Portfolio
- Key Developments
- Financial Performance
- Strategies
- Erwin (Quest Software)
- Company Highlights
- Product Portfolio
- Key Developments
- Financial Performance
- Strategies
- Sparx Systems
- Company Highlights
- Product Portfolio
- Key Developments
- Financial Performance
- Strategies
- ValueBlue
- Company Highlights
- Product Portfolio
- Key Developments
- Financial Performance
- Strategies
- UNICOM Global
- Company Highlights
- Product Portfolio
- Key Developments
- Financial Performance
- Strategies
- Clausmark
- Company Highlights
- Product Portfolio
- Key Developments
- Financial Performance
- Strategies
- Enterprise Architecture Solutions
- Company Highlights
- Product Portfolio
- Key Developments
- Financial Performance
- Strategies
- Planview
- Company Highlights
- Product Portfolio
- Key Developments
- Financial Performance
- Strategies
8. Analyst Recommendations
- Wheel of Fortune
- Analyst View
- Coherent Opportunity Map
9. References and Research Methodology
- References
- Research Methodology
- About us
