|
시장보고서
상품코드
1729696
스마트 시티 테크놀러지 시장 : 컴포넌트별, 용도별, 지역별Smart City Technologies Market, By Component, By Application, By Geography |
||||||
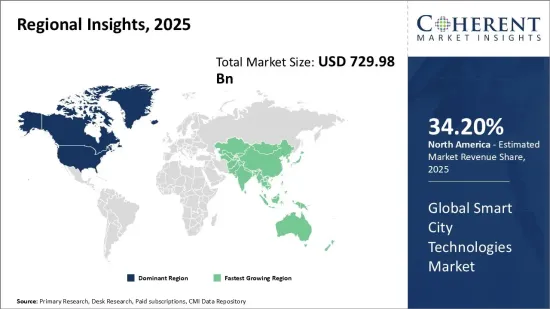
세계의 스마트 시티 테크놀러지 시장은 2025년에는 7,299억 8,000만 달러로 추정되며, 2032년에는 1조 9,536억 1,000만 달러에 달할 것으로 예측되며, 2025-2032년의 연평균 성장률(CAGR)은 15.1%로 성장할 것으로 예측됩니다.
| 리포트 범위 | 리포트 상세 | ||
|---|---|---|---|
| 기준연도 | 2024년 | 2025년 시장 규모 | 7,299억 8,000만 달러 |
| 실적 데이터 | 2020-2024년 | 예측 기간 | 2025-2032년 |
| 예측 기간 : 2025-2032년 CAGR : | 15.10% | 2032년 가치 예측 | 1조 9,536억 1,000만 달러 |

새로운 기술의 급속한 발전과 채택으로 전 세계 도시들은 인프라를 강화하고, 시민들에게 더 나은 서비스를 제공하며, 전반적인 효율성을 향상시킬 수 있게 되었습니다. 장기적인 지속가능성과 삶의 질을 향상시키는 데 있으며, 디지털화와 연결성이 중요한 역할을 한다는 인식이 확산됨에 따라 세계 스마트 시티 기술 시장은 빠른 속도로 성장하고 있습니다. 교통 관리, 공공안전, 유틸리티, 시민 참여에 걸친 최첨단 솔루션은 비용 절감, 협력 강화, 개발 잠재력을 입증하기 위해 신규 및 기존 도시 센터에 의해 활용되고 있습니다.
시장 역학:
세계 스마트 시티 기술 시장의 성장을 가속하는 주요 요인으로는 정부의 막대한 인프라 지출, IoT 솔루션 채택 증가, 도시 관리 강화 요구 등이 있습니다. 지능형 교통시스템, 환경 모니터링, 비상 대응 조정 등을 가능하게 하는 데이터 분석, AI, 디지털 플랫폼에 대한 수요가 높습니다. 그러나 높은 초기 투자 비용, 데이터 프라이버시 및 보안에 대한 우려는 첨단 스마트 시티 프로젝트의 광범위한 보급을 계속 방해하고 있습니다. 반면, 5G의 보급과 커넥티드 디바이스의 확산은 기술 프로바이더들이 혁신적인 용도과 솔루션을 개발할 수 있는 큰 기회를 제공합니다.
본 조사의 주요 특징
세계의 스마트 시티 기술 시장을 상세하게 분석했으며, 2024년을 기준 연도로 하여 예측 기간(2025-2032년) 시장 규모와 연평균 성장률(CAGR)을 조사하여 전해드립니다.
또한 다양한 부문에 걸친 잠재적 매출 기회를 밝히고, 이 시장의 매력적인 투자 제안 매트릭스를 설명합니다.
또한 시장 성장 촉진요인, 억제요인, 기회, 신제품 출시 및 승인, 시장 동향, 지역별 전망, 주요 기업의 경쟁 전략 등에 대한 주요 인사이트을 제공합니다.
이 보고서는 기업 하이라이트, 제품 포트폴리오, 주요 하이라이트, 재무 성과, 전략 등의 매개 변수를 기반으로 세계 스마트 시티 기술 시장의 주요 기업을 프로파일링합니다.
본 조사의 대상이 되는 주요 기업에는 Cisco Systems, Inc., IBM Corporation, Siemens AG, Microsoft Corporation, Huawei Technologies Co., Ltd., General Electric Company, Oracle Corporation, Schneider Electric SE, Honeywell International Inc., Hitachi Ltd., Panasonic Corporation, Accenture PLC, Itron, Inc., SAP SE, LG Corporation 등이 포함됩니다.
이 보고서의 인사이트를 통해 마케팅 담당자와 기업 경영진은 향후 제품 출시, 유형화, 시장 확대, 마케팅 전술에 대한 정보에 입각한 의사결정을 내릴 수 있습니다.
이 보고서는 투자자, 공급업체, 제품 제조업체, 유통업체, 신규 시장 진출기업, 재무 분석가 등 업계의 다양한 이해관계자를 대상으로 합니다.
이해관계자들은 세계 스마트 시티 기술 시장 분석에 사용되는 다양한 전략 매트릭스를 통해 의사결정을 쉽게 내릴 수 있습니다.
목차
제1장 조사의 목적과 전제조건
- 조사 목적
- 전제조건
- 약어
제2장 시장 전망
- 리포트 설명
- 시장의 정의와 범위
- 개요
제3장 시장 역학, 규제, 동향 분석
- 시장 역학
- 영향 분석
- 주요 하이라이트
- 규제 시나리오
- 제품의 발매/승인
- PEST 분석
- PORTER의 산업 분석
- 시장 기회
- 규제 시나리오
- 주요 발전
- 업계 동향
제4장 세계의 스마트 시티 테크놀러지 시장, 컴포넌트별, 2020-2032년
- 하드웨어
- 소프트웨어
- 서비스
제5장 세계의 스마트 시티 테크놀러지 시장, 용도별, 2020-2032년
- 스마트 교통
- 스마트 빌딩
- 스마트 유틸리티
- 스마트 시민 서비스
제6장 세계의 스마트 시티 테크놀러지 시장, 지역별, 2020-2032년
- 북미
- 미국
- 캐나다
- 라틴아메리카
- 브라질
- 아르헨티나
- 멕시코
- 기타 라틴아메리카
- 유럽
- 독일
- 영국
- 스페인
- 프랑스
- 이탈리아
- 러시아
- 기타 유럽
- 아시아태평양
- 중국
- 인도
- 일본
- 호주
- 한국
- ASEAN
- 기타 아시아태평양
- 중동
- GCC 국가
- 이스라엘
- 기타 중동
- 아프리카
- 남아프리카공화국
- 북아프리카
- 중앙아프리카
제7장 경쟁 구도
- Cisco Systems, Inc.
- IBM Corporation
- Siemens AG
- Microsoft Corporation
- Huawei Technologies Co., Ltd.
- General Electric Company
- Oracle Corporation
- Schneider Electric SE
- Honeywell International Inc.
- Hitachi Ltd.
- Panasonic Corporation
- Accenture PLC
- Itron, Inc.
- SAP SE
- LG Corporation
제8장 애널리스트의 권장사항
- 운명의 수레바퀴
- 애널리스트의 견해
- COM(Coherent Opportunity Map)
제9장 참고 문헌과 조사 방법
- 참고 문헌
- 조사 방법
- 출판사 소개
Global Smart City Technologies Market is estimated to be valued at USD 729.98 Bn in 2025 and is expected to reach USD 1,953.61 Bn by 2032, growing at a compound annual growth rate (CAGR) of 15.1% from 2025 to 2032.
| Report Coverage | Report Details | ||
|---|---|---|---|
| Base Year: | 2024 | Market Size in 2025: | USD 729.98 Bn |
| Historical Data for: | 2020 To 2024 | Forecast Period: | 2025 To 2032 |
| Forecast Period 2025 to 2032 CAGR: | 15.10% | 2032 Value Projection: | USD 1,953.61 Bn |
rapid development and adoption of new technologies have enabled cities worldwide to enhance infrastructure, offer better services to citizens, and elevate overall efficiency. The global smart city technologies market is growing at an exponential pace as municipalities acknowledge the role of digitalization and connectivity in achieving long-term sustainability and improved quality of life. Cutting-edge solutions spanning transportation management, public safety, utilities, and civic engagement are being leveraged by both new and existing urban centers to reduce costs, increase collaboration, and future proof their development.
Market Dynamics:
The key drivers fueling growth in the global smart city technologies market include massive infrastructure spending by governments, rising adoption of IoT solutions, and need for enhanced urban management. Data analytics, AI, and digital platforms that enable intelligent traffic systems, environmental monitoring, emergency response coordination, and others are high in demand. However, high initial investment costs, data privacy, and security concerns continue to hinder widespread deployment of advanced smart city projects. On the upside, 5G rollout and proliferation of connected devices present significant opportunities for technology providers to develop innovative applications and solutions.
Key Features of the Study:
This report provides in-depth analysis of the global smart city technologies market, and provides market size (US$ Billion) and compound annual growth rate (CAGR%) for the forecast period (2025-2032), considering 2024 as the base year
It elucidates potential revenue opportunities across different segments and explains attractive investment proposition matrices for this market
This study also provides key insights about market drivers, restraints, opportunities, new product launches or approvals, market trends, regional outlook, and competitive strategies adopted by key players
It profiles key players in the global smart city technologies market based on the following parameters - company highlights, products portfolio, key highlights, financial performance, and strategies
Key companies covered as a part of this study include Cisco Systems, Inc., IBM Corporation, Siemens AG, Microsoft Corporation, Huawei Technologies Co., Ltd., General Electric Company, Oracle Corporation, Schneider Electric SE, Honeywell International Inc., Hitachi Ltd., Panasonic Corporation, Accenture PLC, Itron, Inc., SAP SE, and LG Corporation
Insights from this report would allow marketers and the management authorities of the companies to make informed decisions regarding their future product launches, type up-gradation, market expansion, and marketing tactics
The global smart city technologies market report caters to various stakeholders in this industry including investors, suppliers, product manufacturers, distributors, new entrants, and financial analysts
Stakeholders would have ease in decision-making through various strategy matrices used in analyzing the global smart city technologies market
Market Segmentation
- Component Insights (Revenue, USD Bn, 2020 - 2032)
- Hardware
- Software
- Services
- Application Insights (Revenue, USD Bn, 2020 - 2032)
- Smart Transportation
- Smart Buildings
- Smart Utilities
- Smart Citizen Services
- Regional Insights (Revenue, USD Bn, 2020 - 2032)
- North America
- U.S.
- Canada
- Latin America
- Brazil
- Argentina
- Mexico
- Rest of Latin America
- Europe
- Germany
- U,K.
- Spain
- France
- Italy
- Russia
- Rest of Europe
- Asia Pacific
- China
- India
- Japan
- Australia
- South Korea
- ASEAN
- Rest of Asia Pacific
- Middle East
- GCC Countries
- Israel
- Rest of Middle East
- Africa
- South Africa
- North Africa
- Central Africa
- Company Profiles:
- Cisco Systems, Inc.
- IBM Corporation
- Siemens AG
- Microsoft Corporation
- Huawei Technologies Co., Ltd.
- General Electric Company
- Oracle Corporation
- Schneider Electric SE
- Honeywell International Inc.
- Hitachi Ltd.
- Panasonic Corporation
- Accenture PLC
- Itron, Inc.
- SAP SE
- LG Corporation
Table of Contents
1. Research Objectives and Assumptions
- Research Objectives
- Assumptions
- Abbreviations
2. Market Purview
- Report Description
- Market Definition and Scope
- Executive Summary
- Global Smart City Technologies Market, By Component
- Global Smart City Technologies Market, By Application
- Global Smart City Technologies Market, By Region
3. Market Dynamics, Regulations, and Trends Analysis
- Market Dynamics
- Impact Analysis
- Key Highlights
- Regulatory Scenario
- Product Launches/Approvals
- PEST Analysis
- PORTER's Analysis
- Market Opportunities
- Regulatory Scenario
- Key Developments
- Industry Trends
4. Global Smart City Technologies Market, By Component, 2020-2032, (USD Bn)
- Introduction
- Market Share Analysis, 2025 and 2032 (%)
- Y-o-Y Growth Analysis, 2021 - 2032
- Segment Trends
- Hardware
- Introduction
- Market Size and Forecast, and Y-o-Y Growth, 2020-2032, (USD Bn)
- Software
- Introduction
- Market Size and Forecast, and Y-o-Y Growth, 2020-2032, (USD Bn)
- Services
- Introduction
- Market Size and Forecast, and Y-o-Y Growth, 2020-2032, (USD Bn)
5. Global Smart City Technologies Market, By Application, 2020-2032, (USD Bn)
- Introduction
- Market Share Analysis, 2025 and 2032 (%)
- Y-o-Y Growth Analysis, 2021 - 2032
- Segment Trends
- Smart Transportation
- Introduction
- Market Size and Forecast, and Y-o-Y Growth, 2020-2032, (USD Bn)
- Smart Buildings
- Introduction
- Market Size and Forecast, and Y-o-Y Growth, 2020-2032, (USD Bn)
- Smart Utilities
- Introduction
- Market Size and Forecast, and Y-o-Y Growth, 2020-2032, (USD Bn)
- Smart Citizen Services
- Introduction
- Market Size and Forecast, and Y-o-Y Growth, 2020-2032, (USD Bn)
6. Global Smart City Technologies Market, By Region, 2020 - 2032, Value (USD Bn)
- Introduction
- Market Share (%) Analysis, 2025, 2028 & 2032, Value (USD Bn)
- Market Y-o-Y Growth Analysis (%), 2021 - 2032, Value (USD Bn)
- Regional Trends
- North America
- Introduction
- Market Size and Forecast, By Component, 2020 - 2032, Value (USD Bn)
- Market Size and Forecast, By Application, 2020 - 2032, Value (USD Bn)
- Market Size and Forecast, By Country, 2020 - 2032, Value (USD Bn)
- U.S.
- Canada
- Latin America
- Introduction
- Market Size and Forecast, By Component, 2020 - 2032, Value (USD Bn)
- Market Size and Forecast, By Application, 2020 - 2032, Value (USD Bn)
- Market Size and Forecast, By Country, 2020 - 2032, Value (USD Bn)
- Brazil
- Argentina
- Mexico
- Rest of Latin America
- Europe
- Introduction
- Market Size and Forecast, By Component, 2020 - 2032, Value (USD Bn)
- Market Size and Forecast, By Application, 2020 - 2032, Value (USD Bn)
- Market Size and Forecast, By Country, 2020 - 2032, Value (USD Bn)
- Germany
- U.K.
- Spain
- France
- Italy
- Russia
- Rest of Europe
- Asia Pacific
- Introduction
- Market Size and Forecast, By Component, 2020 - 2032, Value (USD Bn)
- Market Size and Forecast, By Application, 2020 - 2032, Value (USD Bn)
- Market Size and Forecast, By Country, 2020 - 2032, Value (USD Bn)
- China
- India
- Japan
- Australia
- South Korea
- ASEAN
- Rest of Asia Pacific
- Middle East
- Introduction
- Market Size and Forecast, By Component, 2020 - 2032, Value (USD Bn)
- Market Size and Forecast, By Application, 2020 - 2032, Value (USD Bn)
- Market Size and Forecast, By Country, 2020 - 2032, Value (USD Bn)
- GCC Countries
- Israel
- Rest of Middle East
- Africa
- Introduction
- Market Size and Forecast, By Component, 2020 - 2032, Value (USD Bn)
- Market Size and Forecast, By Application, 2020 - 2032, Value (USD Bn)
- Market Size and Forecast, By Country/Region, 2020 - 2032, Value (USD Bn)
- South Africa
- North Africa
- Central Africa
7. Competitive Landscape
- Cisco Systems, Inc.
- Company Highlights
- Product Portfolio
- Key Developments
- Financial Performance
- Strategies
- IBM Corporation
- Company Highlights
- Product Portfolio
- Key Developments
- Financial Performance
- Strategies
- Siemens AG
- Company Highlights
- Product Portfolio
- Key Developments
- Financial Performance
- Strategies
- Microsoft Corporation
- Company Highlights
- Product Portfolio
- Key Developments
- Financial Performance
- Strategies
- Huawei Technologies Co., Ltd.
- Company Highlights
- Product Portfolio
- Key Developments
- Financial Performance
- Strategies
- General Electric Company
- Company Highlights
- Product Portfolio
- Key Developments
- Financial Performance
- Strategies
- Oracle Corporation
- Company Highlights
- Product Portfolio
- Key Developments
- Financial Performance
- Strategies
- Schneider Electric SE
- Company Highlights
- Product Portfolio
- Key Developments
- Financial Performance
- Strategies
- Honeywell International Inc.
- Company Highlights
- Product Portfolio
- Key Developments
- Financial Performance
- Strategies
- Hitachi Ltd.
- Company Highlights
- Product Portfolio
- Key Developments
- Financial Performance
- Strategies
- Panasonic Corporation
- Company Highlights
- Product Portfolio
- Key Developments
- Financial Performance
- Strategies
- Accenture PLC
- Company Highlights
- Product Portfolio
- Key Developments
- Financial Performance
- Strategies
- Itron, Inc.
- Company Highlights
- Product Portfolio
- Key Developments
- Financial Performance
- Strategies
- SAP SE
- Company Highlights
- Product Portfolio
- Key Developments
- Financial Performance
- Strategies
- LG Corporation
- Company Highlights
- Product Portfolio
- Key Developments
- Financial Performance
- Strategies
8. Analyst Recommendations
- Wheel of Fortune
- Analyst View
- Coherent Opportunity Map
9. References and Research Methodology
- References
- Research Methodology
- About us