
|
시장보고서
상품코드
1698514
나노포토닉스 시장 기회, 성장 촉진요인, 산업 동향 분석, 예측(2025-2034년)Nanophotonics Market Opportunity, Growth Drivers, Industry Trend Analysis, and Forecast 2025-2034 |
||||||
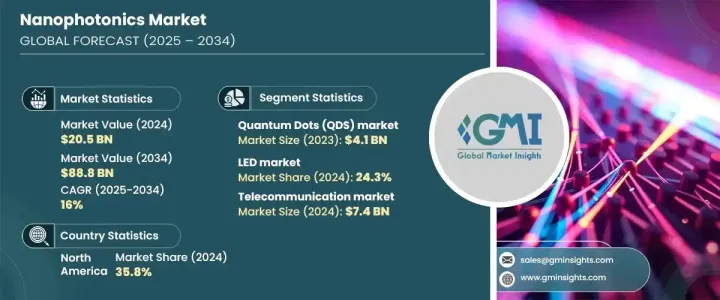
세계의 나노포토닉스 시장은 2024년에 205억 달러로 평가되었습니다. 고속 데이터 전송, 에너지 효율적인 솔루션, 양자 컴퓨팅의 진보에 견인되어 2025년부터 2034년에 걸쳐 16%의 견조한 CAGR를 나타낼 것으로 예측되고 있습니다.
광학 성능 향상, 계산 속도 향상, 전력 소비 최소화를 목적으로 나노포토닉스를 채용하는 산업이 늘어남에 따라, 이 기술은 다양한 분야에서 필수적이 되고 있습니다.
고성능 통신 네트워크 수요가 높아지는 가운데, 나노포토닉스는 데이터 전송 속도의 향상과 대기 시간의 단축에 중요한 역할을 하고 있습니다. 또한 장기간 추진하고 있으며, 지속가능한 솔루션으로의 이동이 진행되고 있으며, 에너지 효율이 높은 나노포토닉스 대응 LED, 태양전지, 광증폭기의 채용이 가속화되고 있습니다.
| 시장 범위 | |
|---|---|
| 시작 연도 | 2024년 |
| 예측 연도 | 2025-2034년 |
| 시작 금액 | 205억 달러 |
| 예측 금액 | 888억 달러 |
| CAGR | 16% |
시장은 재료별로 나노리본, 플라즈모닉, 포토닉 결정, 나노튜브, 양자점, 기타로 구분됩니다.
용도별로 보면 나노포토닉스 시장은 OLED, LED, 근접장 광학, 광전지, 광증폭기, 광스위치 등으로 분류됩니다. 산업이 지속 가능한 조명 기술로 전환함에 따라 나노광자 기반 LED는 소비자 가전, 자동차 조명, 스마트 시티 인프라에서 주목받고 있습니다.
북미는 2024년에 35.8%의 점유율로 세계의 나노포토닉스 시장을 선도했습니다. 광범위한 조사 이니셔티브에 의해 기세가 늘어나고 있으며, 선도적인 업계 기업의 존재와 학술기관과 하이테크 기업 간의 협업이 북미 시장에서 지배적 지위를 강화하고 있습니다.
목차
제1장 조사 방법과 조사 범위
- 시장 범위와 정의
- 기본 추정과 계산
- 예측 계산
- 데이터 소스
제2장 주요 요약
제3장 업계 인사이트
- 생태계 분석
- 밸류체인에 영향을 주는 요인
- 이익률 분석
- 파괴적 혁신
- 향후 전망
- 제조업체
- 유통업체
- 공급업체의 상황
- 이익률 분석
- 주요 뉴스
- 규제 상황
- 영향요인
- 성장 촉진요인
- 고속 데이터 전송 수요 증가
- 가전제품의 성장
- 첨단 센서 개발
- 지속가능한 기술에 대한 주목의 고조
- 업계의 잠재적 위험 및 과제
- 높은 연구개발비
- 복잡한 제조 공정
- 성장 촉진요인
- 성장 가능성 분석
- Porter's Five Forces 분석
- PESTEL 분석
제4장 경쟁 구도
- 서론
- 기업 점유율 분석
- 경쟁 포지셔닝 매트릭스
- 전략 전망 매트릭스
제5장 시장 추계·예측 : 재료별(2021-2034년)
- 주요 동향
- 플라즈모닉
- 광결정
- 나노튜브
- 나노리본
- 퀀텀닷
- 기타
제6장 시장 추계·예측 : 용도별(2021-2034년)
- 주요 동향
- LED
- OLED
- 근거리 광학
- 광전지
- 광증폭기
- 광스위치
- 기타
제7장 시장 추계·예측 : 최종 이용 산업별(2021-2034년)
- 주요 동향
- 통신
- 가전
- 에너지
- 항공우주 및 방위
- 헬스케어
- 기타
제8장 시장 추계·예측 : 지역별(2021-2034년)
- 주요 동향
- 북미
- 미국
- 캐나다
- 유럽
- 영국
- 독일
- 프랑스
- 이탈리아
- 스페인
- 러시아
- 아시아태평양
- 중국
- 인도
- 일본
- 한국
- 호주
- 라틴아메리카
- 브라질
- 멕시코
- 중동 및 아프리카
- 남아프리카
- 사우디아라비아
- 아랍에미리트(UAE)
제9장 기업 프로파일
- Anders Electronics PLC
- Cree Inc.
- Hamamatsu Photonics KK
- Intel Corporation
- Lumentum Holdings Inc.
- Lumileds Holding BV
- Merck Group
- Nanoco Group PLC
- NanoPhotonica, Inc.
- Nanosys Inc.
- OSRAM Opto Semiconductors GmbH
- Quantum Materials Corp.
- Samsung Electronics
- Schott AG
- Sharp Corporation
- Veeco Instruments Inc.
- WITec Wissenschaftliche Instrumente and Technologie GmbH
The Global Nanophotonics Market, valued at USD 20.5 billion in 2024, is projected to expand at a robust CAGR of 16% from 2025 to 2034, driven by advancements in high-speed data transmission, energy-efficient solutions, and quantum computing. As industries increasingly adopt nanophotonics to enhance optical performance, improve computational speeds, and minimize power consumption, the technology is becoming indispensable across various sectors.
With the rising demand for high-performance communication networks, nanophotonics is playing a crucial role in improving data transfer rates while reducing latency. The ability to manipulate light at the nanoscale is revolutionizing optical devices, semiconductor applications, and biosensing technologies. Governments and private organizations are investing heavily in research and development to explore new applications of nanophotonics, further propelling market growth. Additionally, the ongoing shift towards sustainable solutions is accelerating the adoption of energy-efficient nanophotonic-enabled LEDs, photovoltaic cells, and optical amplifiers. Increasing awareness about the benefits of nanophotonics in enhancing device efficiency, along with favorable regulatory policies supporting innovation, is expected to create lucrative opportunities for market players.
| Market Scope | |
|---|---|
| Start Year | 2024 |
| Forecast Year | 2025-2034 |
| Start Value | $20.5 Billion |
| Forecast Value | $88.8 Billion |
| CAGR | 16% |
The market is segmented by material into nanoribbons, plasmonic, photonic crystals, nanotubes, quantum dots, and others. Quantum dots emerged as a key segment, generating USD 4.1 billion in revenue in 2023. Their superior optical properties, high quantum efficiency, and tunable emission characteristics are driving adoption across industries, particularly in display technologies and medical imaging. Quantum dots are widely used in high-resolution displays, advanced sensors, and optoelectronic devices, making them a preferred choice in the evolving semiconductor industry. Ongoing innovations in quantum dot synthesis and integration are expected to unlock new applications, strengthening their market position.
By application, the nanophotonics market is classified into OLED, LED, near-field optics, photovoltaic cells, optical amplifiers, optical switches, and others. The LED segment accounted for 24.3% of the total market share in 2024, fueled by the growing demand for energy-efficient lighting solutions. As industries transition towards sustainable illumination technologies, nanophotonic-enabled LEDs are gaining traction in consumer electronics, automotive lighting, and smart city infrastructure. Their ability to offer extended lifespan, reduced energy consumption, and superior brightness is further contributing to increased adoption. Additionally, the integration of nanophotonic technology in OLED displays and optical switches is enhancing performance and broadening their commercial applications.
North America led the global nanophotonics market with a 35.8% share in 2024. The region is a hub for technological advancements and pioneering research in nanomaterials. The United States is witnessing strong growth, driven by increasing developments in advanced optical technologies and quantum computing. Surface-enhanced optical applications, particularly in biosensing and chemical analysis, are gaining momentum due to extensive research initiatives. Additionally, the presence of major industry players and collaborations between academic institutions and tech firms are reinforcing North America's dominant position in the market. As demand for high-speed, low-power optical solutions continues to rise, the nanophotonics sector is poised for significant expansion in the coming years.
Table of Contents
Chapter 1 Methodology & Scope
- 1.1 Market scope & definitions
- 1.2 Base estimates & calculations
- 1.3 Forecast calculations
- 1.4 Data sources
- 1.4.1 Primary
- 1.4.2 Secondary
- 1.4.2.1 Paid sources
- 1.4.2.2 Public sources
Chapter 2 Executive Summary
- 2.1 Industry synopsis, 2021-2034
Chapter 3 Industry Insights
- 3.1 Industry ecosystem analysis
- 3.1.1 Factor affecting the value chain
- 3.1.2 Profit margin analysis
- 3.1.3 Disruptions
- 3.1.4 Future outlook
- 3.1.5 Manufacturers
- 3.1.6 Distributors
- 3.2 Supplier landscape
- 3.3 Profit margin analysis
- 3.4 Key news & initiatives
- 3.5 Regulatory landscape
- 3.6 Impact forces
- 3.6.1 Growth drivers
- 3.6.1.1 Increasing demand for high-speed data transmission
- 3.6.1.2 Growth in consumer electronics
- 3.6.1.3 Development of advanced sensors
- 3.6.1.4 Increasing focus on sustainable technologies
- 3.6.2 Industry pitfalls & challenges
- 3.6.2.1 High cost of research and development
- 3.6.2.2 Complex manufacturing processes
- 3.6.1 Growth drivers
- 3.7 Growth potential analysis
- 3.8 Porter's analysis
- 3.9 PESTEL analysis
Chapter 4 Competitive Landscape, 2024
- 4.1 Introduction
- 4.2 Company market share analysis
- 4.3 Competitive positioning matrix
- 4.4 Strategic outlook matrix
Chapter 5 Market Estimates & Forecast, By Material, 2021-2034 (USD Million)
- 5.1 Key trends
- 5.2 Plasmonic
- 5.3 Photonic crystals
- 5.4 Nanotubes
- 5.5 Nanoribbons
- 5.6 Quantum dots
- 5.7 Others
Chapter 6 Market Estimates & Forecast, By Application, 2021-2034 (USD Million)
- 6.1 Key trends
- 6.2 LED
- 6.3 OLED
- 6.4 Near field optics
- 6.5 Photovoltaic cells
- 6.6 Optical amplifiers
- 6.7 Optical switches
- 6.8 Others
Chapter 7 Market Estimates & Forecast, By End Use Industry, 2021-2034 (USD Million)
- 7.1 Key trends
- 7.2 Telecommunication
- 7.3 Consumer electronics
- 7.4 Energy
- 7.5 Aerospace & defense
- 7.6 Healthcare
- 7.7 Others
Chapter 8 Market Estimates & Forecast, By Region, 2021-2034 (USD Million)
- 8.1 Key trends
- 8.2 North America
- 8.2.1 U.S.
- 8.2.2 Canada
- 8.3 Europe
- 8.3.1 UK
- 8.3.2 Germany
- 8.3.3 France
- 8.3.4 Italy
- 8.3.5 Spain
- 8.3.6 Russia
- 8.4 Asia Pacific
- 8.4.1 China
- 8.4.2 India
- 8.4.3 Japan
- 8.4.4 South Korea
- 8.4.5 Australia
- 8.5 Latin America
- 8.5.1 Brazil
- 8.5.2 Mexico
- 8.6 MEA
- 8.6.1 South Africa
- 8.6.2 Saudi Arabia
- 8.6.3 UAE
Chapter 9 Company Profiles
- 9.1 Anders Electronics PLC
- 9.2 Cree Inc.
- 9.3 Hamamatsu Photonics K.K.
- 9.4 Intel Corporation
- 9.5 Lumentum Holdings Inc.
- 9.6 Lumileds Holding B.V.
- 9.7 Merck Group
- 9.8 Nanoco Group PLC
- 9.9 NanoPhotonica, Inc.
- 9.10 Nanosys Inc.
- 9.11 OSRAM Opto Semiconductors GmbH
- 9.12 Quantum Materials Corp.
- 9.13 Samsung Electronics
- 9.14 Schott AG
- 9.15 Sharp Corporation
- 9.16 Veeco Instruments Inc.
- 9.17 WITec Wissenschaftliche Instrumente and Technologie GmbH

