|
시장보고서
상품코드
1699323
석유 및 가스 인프라 시장 기회, 성장 촉진요인, 산업 동향 분석, 예측(2025-2034년)Oil and Gas Infrastructure Market Opportunity, Growth Drivers, Industry Trend Analysis, and Forecast 2025-2034 |
||||||
세계의 석유 및 가스 인프라 시장은 2024년에 7,611억 달러에 이르렀으며, 2025년부터 2034년까지 연평균 복합 성장률(CAGR) 6.8%를 나타낼 것으로 예측됩니다.
신흥국을 중심으로 한 석유 및 가스 수요 증가와 대규모 인프라 프로젝트에 대한 투자의 급증이 업계 확대의 원동력이 되고 있습니다.

이 산업은 지상 설비·리스 설비, 수집·가공, 파이프라인, 저장, 정제·운송, 수출 터미널 등 여러 부문으로 분류됩니다. 지표 및 임대 장비는 탐사 및 생산 활동의 확장에 힘입어 2034년까지 6.5%의 연평균 성장률(CAGR)을 나타낼 것으로 예상됩니다. 타이트 가스와 셰일 가스 채굴 등 비전통적인 굴착 기술의 도입이 증가하고 있는 것으로, 조업을 지원하는 첨단 장비에 대한 수요를 더욱 높여 가고 있습니다.
| 시장 범위 | |
|---|---|
| 시작 연도 | 2024년 |
| 예측 연도 | 2025-2034년 |
| 시작 금액 | 7,611억 달러 |
| 예측 금액 | 1조 4,600억 달러 |
| CAGR | 6.8% |
석유 및 가스 저장 부문의 2024년 점유율은 3.5%였으며, 천연 가스를 기반으로 하는 경제로의 전환과 세계 무역의 확대로 수요가 증가하고 있습니다. 원유, 원료, 제트 연료, 디젤, 가솔린 등의 석유 정제품을 수용하기 위해 큰 용량이 필요합니다.
미국의 석유 및 가스 인프라 시장은 2024년에 804억 달러로 평가되었으며, 2034년에는 1,500억 달러에 달할 것으로 예상됩니다. 파이프라인 네트워크, 저장시설의 확장, 고도의 정제시설에 대한 자본지출 증가는 부문의 성장을 가속하고 미국이 석유 및 가스 인프라에서 지배적 기업으로서의 지위를 유지할 수 있도록 하고 있습니다.
목차
제1장 조사 방법과 조사 범위
- 시장 범위와 정의
- 시장 추계·예측 파라미터
- 예측 계산
- 데이터 소스
제2장 주요 요약
제3장 업계 인사이트
- 생태계 분석
- 규제 상황
- 업계에 미치는 영향요인
- 성장 촉진요인
- 업계의 잠재적 위험 및 과제
- 성장 가능성 분석
- Porter's Five Forces 분석
- PESTEL 분석
제4장 경쟁 구도
- 서론
- 전략적 전망
- 혁신과 지속가능성의 전망
제5장 시장 규모와 예측 : 카테고리별(2021-2034년)
- 주요 동향
- 지표 및 임대 장비
- 채굴 및 처리
- 석유,가스 및 NGL 파이프라인
- 석유 및 가스 저장
- 정제 및 석유 제품 운송
- 수출터미널
제6장 시장 규모와 예측 : 지역별(2021-2034년)
- 주요 동향
- 북미
- 미국
- 캐나다
- 유럽
- 노르웨이
- 영국
- 프랑스
- 이탈리아
- 러시아
- 아시아태평양
- 중국
- 인도
- 일본
- 한국
- 호주
- 중동 및 아프리카
- 사우디아라비아
- 카타르
- 나이지리아
- UAE
- 오만
- 이집트
- 라틴아메리카
- 브라질
- 아르헨티나
- 멕시코
제7장 기업 프로파일
- Baker Hughes Company
- BP
- Centrica
- Chevron Corporation
- ConocoPhillips
- Energy Transfer
- Enterprise Products Partners
- Exxon Mobil Corporation
- Hatch
- Halliburton
- Kinder Morgan
- Marathon Oil Company
- NGL Energy Partners
- Occidental Petroleum Corporation
- ONEOK
- Royal Vopak
- SLB
- Shell
- TotalEnergies
- WILLIAMS
The Global Oil and Gas Infrastructure Market reached USD 761.1 billion in 2024 and is projected to grow at a CAGR of 6.8% from 2025 to 2034. The increasing demand for oil and gas, especially in emerging economies, combined with surging investments in large-scale infrastructure projects, is set to drive industry expansion. With the energy sector undergoing rapid transformation, nations are allocating significant resources to strengthen their infrastructure and enhance operational efficiency. Rising energy consumption, coupled with advancements in technology, is accelerating the development of efficient transportation, storage, and processing facilities.
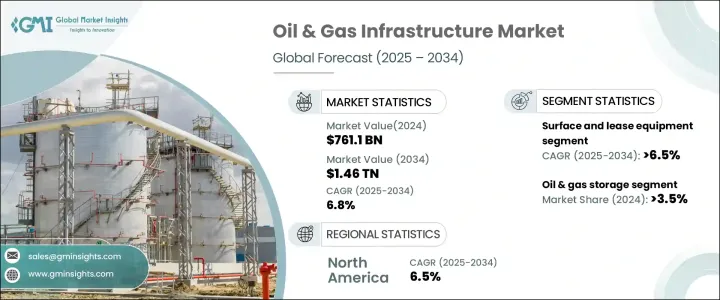
The industry is classified into several segments, including surface and lease equipment, gathering and processing, pipelines, storage, refining and transportation, and export terminals. Surface and lease equipment is expected to grow at a CAGR of 6.5% by 2034, driven by the expansion of exploration and production activities. The rising implementation of unconventional drilling techniques, such as tight gas and shale gas extraction, is further fueling demand for advanced equipment to support operations. As energy producers seek to enhance efficiency and optimize production, investment in surface infrastructure remains critical.
| Market Scope | |
|---|---|
| Start Year | 2024 |
| Forecast Year | 2025-2034 |
| Start Value | $761.1 Billion |
| Forecast Value | $1.46 Trillion |
| CAGR | 6.8% |
The oil & gas storage sector held a 3.5% share in 2024, with demand increasing due to a shift toward a natural gas-based economy and expanding global trade. The growing need for large-scale storage solutions stems from heightened petrochemical and refinery activities, where significant capacities are required to accommodate crude oil, feedstocks, and refined petroleum products, including jet fuel, diesel, and gasoline. The push for supply flexibility and enhanced storage infrastructure is reinforcing market growth, ensuring a stable energy supply to meet fluctuating demand.
United States oil & gas infrastructure market was valued at USD 80.4 billion in 2024, with projections expected to generate USD 150 billion by 2034. Strategic investments in energy infrastructure are reinforcing national energy security, minimizing supply chain vulnerabilities, and ensuring uninterrupted fuel distribution. The country is focusing on modernizing and expanding liquefaction plants and refining terminals, accelerating industry adoption of cutting-edge technologies. Increased capital expenditure in pipeline networks, storage expansions, and advanced refining facilities is fostering sectoral growth, allowing the US to maintain its position as a dominant player in the oil and gas infrastructure landscape.
Table of Contents
Chapter 1 Methodology & Scope
- 1.1 Market scope & definitions
- 1.2 Market estimates & forecast parameters
- 1.3 Forecast calculation
- 1.4 Data sources
- 1.4.1 Primary
- 1.4.2 Secondary
- 1.4.2.1 Paid
- 1.4.2.2 Public
Chapter 2 Executive Summary
- 2.1 Industry synopsis, 2021 - 2034
Chapter 3 Industry Insights
- 3.1 Industry ecosystem analysis
- 3.2 Regulatory landscape
- 3.3 Industry impact forces
- 3.3.1 Growth drivers
- 3.3.2 Industry pitfalls & challenges
- 3.4 Growth potential analysis
- 3.5 Porter's analysis
- 3.5.1 Bargaining power of suppliers
- 3.5.2 Bargaining power of buyers
- 3.5.3 Threat of new entrants
- 3.5.4 Threat of substitutes
- 3.6 PESTEL analysis
Chapter 4 Competitive Landscape, 2024
- 4.1 Introduction
- 4.2 Strategic outlook
- 4.3 Innovation & sustainability landscape
Chapter 5 Market Size and Forecast, By Category, 2021 – 2034 (USD Billion)
- 5.1 Key trends
- 5.2 Surface and lease equipment
- 5.3 Gathering & processing
- 5.4 Oil, gas & NGL pipelines
- 5.5 Oil & gas storage
- 5.6 Refining & oil products transport
- 5.7 Export terminals
Chapter 6 Market Size and Forecast, By Region, 2021 – 2034 (USD Billion)
- 6.1 Key trends
- 6.2 North America
- 6.2.1 U.S.
- 6.2.2 Canada
- 6.3 Europe
- 6.3.1 Norway
- 6.3.2 UK
- 6.3.3 France
- 6.3.4 Italy
- 6.3.5 Russia
- 6.4 Asia Pacific
- 6.4.1 China
- 6.4.2 India
- 6.4.3 Japan
- 6.4.4 South Korea
- 6.4.5 Australia
- 6.5 Middle East & Africa
- 6.5.1 Saudi Arabia
- 6.5.2 Qatar
- 6.5.3 Nigeria
- 6.5.4 UAE
- 6.5.5 Oman
- 6.5.6 Egypt
- 6.6 Latin America
- 6.6.1 Brazil
- 6.6.2 Argentina
- 6.6.3 Mexico
Chapter 7 Company Profiles
- 7.1 Baker Hughes Company
- 7.2 BP
- 7.3 Centrica
- 7.4 Chevron Corporation
- 7.5 ConocoPhillips
- 7.6 Energy Transfer
- 7.7 Enterprise Products Partners
- 7.8 Exxon Mobil Corporation
- 7.9 Hatch
- 7.10 Halliburton
- 7.11 Kinder Morgan
- 7.12 Marathon Oil Company
- 7.13 NGL Energy Partners
- 7.14 Occidental Petroleum Corporation
- 7.15 ONEOK
- 7.16 Royal Vopak
- 7.17 SLB
- 7.18 Shell
- 7.19 TotalEnergies
- 7.20 WILLIAMS