|
시장보고서
상품코드
1708243
소아용 이미징 시장 기회, 성장 촉진요인, 산업 동향 분석, 예측(2025-2034년)Pediatric Imaging Market Opportunity, Growth Drivers, Industry Trend Analysis, and Forecast 2025 - 2034 |
||||||
세계의 소아용 이미징 시장은 2024년에 87억 달러로 평가되며, 2025-2034년에 CAGR 7.7%로 성장할 것으로 예측됩니다.
소아 영상 진단은 영유아기부터 사춘기까지 소아청소년의 질병을 진단하고 평가하는 데 중요한 역할을 합니다. 의료 영상 기술의 발전은 소아 영상의학에 혁명을 가져왔으며, 방사선 노출에 따른 위험을 최소화하면서 안전성, 정확성, 효율성을 향상시키고 있습니다. 저방사선 영상, AI 기반 진단, 3D 영상 기술과 같은 최첨단 혁신은 환자 예후를 크게 개선하고 이 역동적인 분야의 성장을 가속하고 있습니다. 소아 질환의 유병률 증가, 의료 전문가들의 인식 증가, 영상 진단 양식의 지속적인 개발은 시장 확대를 더욱 촉진하고 있습니다. 또한 소아 영상 진단에 인공지능을 통합하여 진단 프로세스를 간소화하고 보다 신속하고 정확한 해석을 가능하게 함으로써 임상적 의사결정을 개선하고 있습니다. 비침습적 진단 절차의 중요성이 강조되고 전 세계에서 소아 전문 병원이 증가함에 따라 첨단 영상 솔루션에 대한 수요도 증가하고 있습니다.
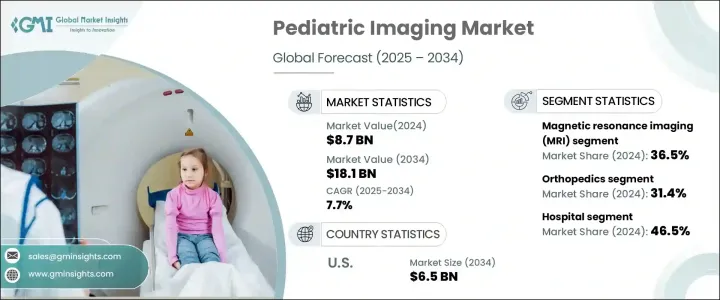
초음파, 자기공명영상(MRI), 컴퓨터단층촬영(CT), 엑스레이 등 영상 진단기법별로 분류되며, MRI는 2024년 36.5% 시장 점유율을 차지할 것으로 예상되며, 젊은 환자에게 전리방사선 노출 없이 고해상도 영상을 제공할 수 있으며, 선호되는 영상 진단기법으로 자리매김할 것으로 예측됩니다. MRI는 신경, 근골격계, 연부조직의 진단에 효과적이기 때문에 소아 의료에 필수적인 영상 진단 수단으로 자리 잡았습니다. 최근 소음 감소 기능, 고속 스캔 기능, 소아 친화적인 디자인 등의 발전으로 MRI 검사가 소아 환자들에게 더 친숙하고 스트레스가 적으며, 의료 시설에서 MRI 검사의 도입이 증가하고 있습니다.
| 시장 범위 | |
|---|---|
| 시작연도 | 2024년 |
| 예측연도 | 2025-2034년 |
| 시작 금액 | 87억 달러 |
| 예상 금액 | 181억 달러 |
| CAGR | 7.7% |
소아용 이미징은 용도별로도 분류되며, 신경학, 정형외과, 심장학, 종양학, 소화기학 등이 주요 분야입니다. 정형외과 분야는 2024년 31.4%로 가장 큰 점유율을 차지할 것으로 예상되며, 소아 근골격계 질환 및 상해의 발병률 증가가 그 요인으로 작용할 것으로 보입니다. 비침습적 진단 솔루션에 대한 수요가 증가하고 있으며, 3D 이미징, 콘빔 CT, 디지털 엑스레이 촬영과 같은 기술 혁신은 정형외과 진단의 정확성과 효율성을 높이는 데 매우 중요한 역할을 하고 있습니다. 이러한 기술 발전은 소아 정형외과 질환의 진단 및 치료 방법을 변화시키고 있으며, 시장 성장을 더욱 촉진하고 있습니다.
미국 소아 영상 시장은 2024년 30억 달러 규모로 평가되며, 2025-2034년 연평균 7.6%의 성장률을 보일 것으로 예측됩니다. 선천성 심장질환, 신경질환 등 소아 건강 상태의 확산이 진행되면서 첨단 영상 기술에 대한 수요가 증가하고 있습니다. 휴대용 초음파 진단 장비와 저선량 CT 스캔은 환자의 안전과 편안함을 보장하면서 고품질의 영상 진단을 제공할 수 있으며, 인기를 끌고 있습니다. 조기 진단에 대한 지속적인 강조와 소아 의료 인프라의 확대는 미국내 소아 영상 진단 서비스의 강력한 성장에 기여하는 주요 요인입니다.
목차
제1장 조사 방법과 조사 범위
제2장 개요
제3장 업계 인사이트
- 에코시스템 분석
- 업계에 대한 영향요인
- 촉진요인
- 소아 질환의 증가
- 영상 기술의 진보
- 인지도와 접근성의 향상
- 정부의 지원 구상
- 업계의 잠재적 리스크 & 과제
- 방사선 피폭 우려
- 첨단 영상 처리 기기의 고비용
- 촉진요인
- 성장 가능성 분석
- 규제 상황
- 기술적 전망
- 향후 시장 동향
- 갭 분석
- Porter의 산업 분석
- PESTEL 분석
제4장 경쟁 구도
- 서론
- 기업 점유율 분석
- 기업 매트릭스 분석
- 주요 시장 기업의 경쟁 분석
- 경쟁 포지셔닝 매트릭스
- 전략 대시보드
제5장 시장 추산·예측 : 이미징 모달리티별, 2021-2034년
- 주요 동향
- 초음파
- 자기공명영상(MRI)
- 컴퓨터 단층촬영(CT)
- X선
- 기타 영상 모달리티
제6장 시장 추산·예측 : 용도별, 2021-2034년
- 주요 동향
- 신경
- 정형외과
- 순환기
- 종양학
- 소화기 내과
- 기타 용도
제7장 시장 추산·예측 : 최종 용도별, 2021-2034년
- 주요 동향
- 병원
- 영상 진단 센터
- 소아과 클리닉
- 기타 최종 용도
제8장 시장 추산·예측 : 지역별, 2021-2034년
- 주요 동향
- 북미
- 미국
- 캐나다
- 유럽
- 독일
- 영국
- 프랑스
- 스페인
- 이탈리아
- 네덜란드
- 아시아태평양
- 중국
- 인도
- 일본
- 호주
- 한국
- 라틴아메리카
- 브라질
- 멕시코
- 아르헨티나
- 중동 및 아프리카
- 사우디아라비아
- 남아프리카공화국
- 아랍에미리트
제9장 기업 개요
- Agfa-Gevaert Group
- Analogic
- Canon
- Carestream Health
- Esaote
- FUJIFILM
- GE Healthcare
- Hyperfine
- Koninklijke Philips
- LMT Medical Systems
- Mindray
- Samsung Healthcare
- Shimadzu
- Siemens Healthineers
The Global Pediatric Imaging Market was valued at USD 8.7 billion in 2024 and is projected to grow at a CAGR of 7.7% from 2025 to 2034. Pediatric imaging plays a crucial role in diagnosing and assessing medical conditions in children, from infancy through adolescence. Advances in medical imaging technology have revolutionized pediatric radiology, enhancing safety, accuracy, and efficiency while minimizing risks associated with radiation exposure. Cutting-edge innovations such as low-radiation imaging, AI-driven diagnostics, and 3D imaging techniques are significantly improving patient outcomes, fostering growth in this dynamic sector. The increasing prevalence of pediatric disorders, rising awareness among healthcare professionals, and continuous developments in imaging modalities are further propelling market expansion. Additionally, the integration of artificial intelligence in pediatric imaging is streamlining diagnostic processes, allowing for faster and more precise interpretations, thereby improving clinical decision-making. The growing emphasis on non-invasive diagnostic procedures and the increasing number of pediatric specialty hospitals worldwide are also fueling the demand for advanced imaging solutions.

The market is segmented by imaging modalities, including ultrasound, magnetic resonance imaging (MRI), computed tomography (CT), X-ray, and others. MRI held a 36.5% market share in 2024, establishing itself as a preferred imaging modality due to its ability to provide high-resolution images without exposing young patients to ionizing radiation. Its effectiveness in diagnosing neurological, musculoskeletal, and soft tissue conditions makes it indispensable in pediatric healthcare. Recent advancements, such as noise reduction features, faster scanning capabilities, and child-friendly designs, have made MRI procedures more accessible and less stressful for young patients, leading to increased adoption across healthcare facilities.
| Market Scope | |
|---|---|
| Start Year | 2024 |
| Forecast Year | 2025-2034 |
| Start Value | $8.7 Billion |
| Forecast Value | $18.1 Billion |
| CAGR | 7.7% |
Pediatric imaging is also categorized by application, with key areas including neurology, orthopedics, cardiology, oncology, and gastroenterology. The orthopedics segment held the largest share at 31.4% in 2024, driven by the rising incidence of musculoskeletal disorders and injuries in children. The demand for non-invasive diagnostic solutions is escalating, and innovations such as 3D imaging, cone-beam CT, and digital radiography are playing a pivotal role in enhancing the accuracy and efficiency of orthopedic diagnostics. These technological advancements are transforming the way pediatric orthopedic conditions are diagnosed and treated, further bolstering market growth.
The U.S. Pediatric Imaging Market was valued at USD 3 billion in 2024 and is anticipated to grow at a CAGR of 7.6% from 2025 to 2034. The increasing prevalence of pediatric health conditions, including congenital heart defects and neurological disorders, is fueling demand for advanced imaging technologies. Portable ultrasound machines and low-radiation CT scans are gaining traction due to their ability to provide high-quality imaging while ensuring patient safety and comfort. The continued emphasis on early diagnosis and the expansion of pediatric healthcare infrastructure are key factors contributing to the strong growth of pediatric imaging services in the U.S.
Table of Contents
Chapter 1 Methodology and Scope
- 1.1 Market scope and definitions
- 1.2 Research design
- 1.2.1 Research approach
- 1.2.2 Data collection methods
- 1.3 Base estimates and calculations
- 1.3.1 Base year calculation
- 1.3.2 Key trends for market estimation
- 1.4 Forecast model
- 1.5 Primary research and validation
- 1.5.1 Primary sources
- 1.5.2 Data mining sources
Chapter 2 Executive Summary
- 2.1 Industry 3600 synopsis
Chapter 3 Industry Insights
- 3.1 Industry ecosystem analysis
- 3.2 Industry impact forces
- 3.2.1 Growth drivers
- 3.2.1.1 Increasing prevalence of pediatric diseases
- 3.2.1.2 Advancements in imaging technologies
- 3.2.1.3 Growing awareness and accessibility
- 3.2.1.4 Supportive government initiatives
- 3.2.2 Industry pitfalls and challenges
- 3.2.2.1 Radiation exposure concerns
- 3.2.2.2 High costs of advanced imaging equipment
- 3.2.1 Growth drivers
- 3.3 Growth potential analysis
- 3.4 Regulatory landscape
- 3.5 Technological landscape
- 3.6 Future market trends
- 3.7 Gap analysis
- 3.8 Porter's analysis
- 3.9 PESTEL analysis
Chapter 4 Competitive Landscape, 2024
- 4.1 Introduction
- 4.2 Company market share analysis
- 4.3 Company matrix analysis
- 4.4 Competitive analysis of major market players
- 4.5 Competitive positioning matrix
- 4.6 Strategy dashboard
Chapter 5 Market Estimates and Forecast, By Imaging Modality, 2021 - 2034 ($ Mn)
- 5.1 Key trends
- 5.2 Ultrasound
- 5.3 Magnetic resonance imaging (MRI)
- 5.4 Computed tomography (CT)
- 5.5 X-ray
- 5.6 Other imaging modalities
Chapter 6 Market Estimates and Forecast, By Application, 2021 - 2034 ($ Mn)
- 6.1 Key trends
- 6.2 Neurology
- 6.3 Orthopedics
- 6.4 Cardiology
- 6.5 Oncology
- 6.6 Gastroenterology
- 6.7 Other applications
Chapter 7 Market Estimates and Forecast, By End Use, 2021 - 2034 ($ Mn)
- 7.1 Key trends
- 7.2 Hospitals
- 7.3 Diagnostic imaging centers
- 7.4 Pediatric clinics
- 7.5 Other end use
Chapter 8 Market Estimates and Forecast, By Region, 2021 - 2034 ($ Mn)
- 8.1 Key trends
- 8.2 North America
- 8.2.1 U.S.
- 8.2.2 Canada
- 8.3 Europe
- 8.3.1 Germany
- 8.3.2 UK
- 8.3.3 France
- 8.3.4 Spain
- 8.3.5 Italy
- 8.3.6 Netherlands
- 8.4 Asia Pacific
- 8.4.1 China
- 8.4.2 India
- 8.4.3 Japan
- 8.4.4 Australia
- 8.4.5 South Korea
- 8.5 Latin America
- 8.5.1 Brazil
- 8.5.2 Mexico
- 8.5.3 Argentina
- 8.6 Middle East and Africa
- 8.6.1 Saudi Arabia
- 8.6.2 South Africa
- 8.6.3 UAE
Chapter 9 Company Profiles
- 9.1 Agfa-Gevaert Group
- 9.2 Analogic
- 9.3 Canon
- 9.4 Carestream Health
- 9.5 Esaote
- 9.6 FUJIFILM
- 9.7 GE Healthcare
- 9.8 Hyperfine
- 9.9 Koninklijke Philips
- 9.10 LMT Medical Systems
- 9.11 Mindray
- 9.12 Samsung Healthcare
- 9.13 Shimadzu
- 9.14 Siemens Healthineers