|
시장보고서
상품코드
1716521
석유 코크스 시장 기회, 성장 촉진 요인, 산업 동향 분석, 예측(2025-2034년)Petcoke Market Opportunity, Growth Drivers, Industry Trend Analysis, and Forecast 2025 - 2034 |
||||||
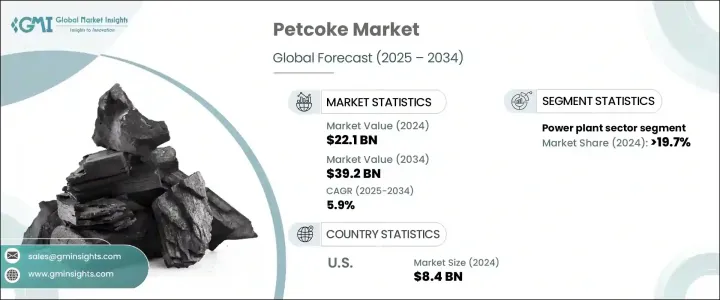
세계 석유 코크스 시장은 2024년 221억 달러로 평가되었으며, 2025년부터 2034년까지 연평균 복합 성장률(CAGR) 5.9%로 성장할 것으로 예측됩니다.
석유 정제에서 유래한 탄소가 풍부한 고체인 석유 코크스는 발전, 시멘트 제조, 철강 생산 등 산업에 여전히 중요한 연료원입니다. 높은 발열량과 비용 효과로 기존 연료보다 선호되는 옵션입니다. 그러나 환경문제에 대한 우려와 규제압력 증가가 산업계에 대체 에너지원의 탐구를 촉구하고 있습니다. 세계 각국의 정부는 석탄이 환경에 미치는 악영향, 특히 탄소와 황의 배출량이 많기 때문에 석탄의 사용을 억제하는 엄격한 정책을 실시했습니다. 이 변화는 석유 코크스의 사용을 계속하기 위해 더 깨끗한 대체 연료를 채택하거나 고급 배출 제어 기술을 도입하기 위해 기업을 강화하고 있습니다.
석유 정제 설비의 증강은 석유 코크스의 가용량을 증가시키는 중요한 요인입니다. 더 많은 원유가 정제됨에 따라 중질 오일을 처리할 때 제품별로 더 많은 양의 석유 코크스가 생산됩니다. 또한 시멘트 및 철강 산업의 안정적인 수요가 시장 성장을 더욱 강화하고 있습니다. 이러한 산업은 합리적인 가격과 높은 에너지 생산에서 석유 코크스에 의존하고 있으며,이 재료의 안정적인 수요를 보장합니다.
| 시장 범위 | |
|---|---|
| 시작 연도 | 2024년 |
| 예측 연도 | 2025-2034년 |
| 시작 금액 | 221억 달러 |
| 예측 금액 | 392억 달러 |
| CAGR | 5.9% |
석유 코크스 시장은 연료용과 소성용으로 구분됩니다. 연료 등급의 석유 코크스는 시멘트 공장, 발전소, 철강 생산 시설에서 널리 사용되고 있기 때문에 압도적인 점유율을 차지하고 있습니다.
용도별 시장 세분화에는 발전소, 시멘트, 철강, 알루미늄 산업 등이 포함되어 있습니다.
미국의 석유 코크스 시장은 현저한 성장을 이루고 있으며, 평가액은 2022년에 80억 달러, 2023년에 82억 달러, 2024년에 84억 달러에 달했습니다. 확장되는 철강 및 전력 산업은 펫코크의 경제적 이점, 높은 에너지 생산량, 용광로에서 탄소원으로서의 역할을 활용하여 이러한 수요를 주도합니다. 2024년의 미국의 소비량은 5,440만 톤에 이르고, 주로 이러한 산업용도에 사용됩니다.
목차
제1장 조사 방법과 조사 범위
제2장 주요 요약
제3장 업계 인사이트
- 생태계 분석
- 규제 상황
- 업계에 미치는 영향요인
- 성장 촉진요인
- 업계의 잠재적 위험 및 과제
- 성장 가능성 분석
- Porter's Five Forces 분석
- PESTEL 분석
제4장 경쟁 구도
- 소개
- 전략 대시보드
- 혁신과 기술의 전망
제5장 시장 규모와 예측 : 그레이드별, 2021년-2034년
- 주요 동향
- 연료 등급
- 소성 석유 코크스
제6장 시장 규모와 예측 : 물리적 형상별, 2021년-2034년
- 주요 동향
- 스폰지 코크스
- 퍼지 코크스
- 샷 코크스
- 니들 코크스
제7장 시장 규모와 예측 : 용도별, 2021년-2034년
- 주요 동향
- 발전소
- 시멘트 산업
- 철강 업계
- 알루미늄 산업
- 기타
제8장 시장 규모와 예측 : 지역별, 2021년-2034년
- 주요 동향
- 북미
- 미국
- 캐나다
- 유럽
- 영국
- 독일
- 프랑스
- 그리스
- 러시아
- 스페인
- 아시아태평양
- 중국
- 인도
- 일본
- 호주
- 중동 및 아프리카
- 사우디아라비아
- 튀르키예
- 쿠웨이트
- 라틴아메리카
- 브라질
- 아르헨티나
- 칠레
- 멕시코
제9장 기업 프로파일
- BP
- Chevron Corporation
- Exxon Mobil
- HF Sinclair Corporation
- Husky Energy
- Marathon Petroleum Corporation
- Oxbow Corporation
- Phillips 66 Company
- Reliance Industries
- Saudi Aramco
- Shell plc
- Valero Energy Corp
- Indian Oil Corporation
- Rosneft
- TotalEnergies
The Global Petcoke Market was valued at USD 22.1 billion in 2024 and is projected to expand at a CAGR of 5.9% from 2025 to 2034. Petcoke, a carbon-rich solid derived from oil refining, remains a key fuel source for industries such as power generation, cement manufacturing, and steel production. Its high calorific value and cost-effectiveness make it a preferred choice over conventional fuels. However, rising environmental concerns and regulatory pressures are prompting industries to explore alternative energy sources. Governments worldwide are implementing stringent policies to curb coal usage due to its adverse environmental impact, particularly high carbon and sulfur emissions. This shift is pushing companies to either adopt cleaner alternatives or implement advanced emission control technologies to continue using petcoke.

The increasing expansion of refinery capacities is a crucial factor contributing to the growing availability of petcoke. As more crude oil is refined, higher volumes of petcoke are produced as a byproduct of processing heavy oil. Additionally, the steady demand from cement and steel industries further propels market growth. These industries rely on petcoke for its affordability and high energy output, ensuring a consistent demand for the material.
| Market Scope | |
|---|---|
| Start Year | 2024 |
| Forecast Year | 2025-2034 |
| Start Value | $22.1 Billion |
| Forecast Value | $39.2 Billion |
| CAGR | 5.9% |
The petcoke market is segmented into fuel-grade and calcined petcoke. Fuel-grade petcoke holds a dominant share due to its widespread use in cement plants, power stations, and steel production facilities. It remains a cost-effective alternative to coal despite concerns regarding its high sulfur and metal content.
Market segmentation by application includes power plants, cement, steel, and aluminum industries, among others. In 2024, the power plant sector accounted for over 19.7% of the total petcoke market share, highlighting its critical role in energy production. Thermal power plants continue to rely on petcoke, especially in regions where cleaner fuels are not readily accessible.
The U.S. petcoke market has experienced notable growth, with valuations of USD 8 billion in 2022, USD 8.2 billion in 2023, and USD 8.4 billion in 2024. The expanding steel and power industries drive this demand, capitalizing on petcoke's economic advantages, high energy yield, and role as a carbon source in blast furnaces. In 2024, U.S. consumption reached 54.4 million metric tonnes, primarily for these industrial applications. The cost-efficiency of petcoke compared to natural gas and coal remains a key factor supporting its sustained demand.
Table of Contents
Chapter 1 Methodology & Scope
- 1.1 Market definitions
- 1.2 Base estimates & calculations
- 1.3 Forecast calculation
- 1.4 Data sources
- 1.4.1 Primary
- 1.4.2 Secondary
- 1.4.2.1 Paid
- 1.4.2.2 Public
Chapter 2 Executive Summary
- 2.1 Industry synopsis, 2021 - 2034
Chapter 3 Industry Insights
- 3.1 Industry ecosystem analysis
- 3.2 Regulatory landscape
- 3.3 Industry impact forces
- 3.3.1 Growth drivers
- 3.3.2 Industry pitfalls & challenges
- 3.4 Growth potential analysis
- 3.5 Porter's analysis
- 3.5.1 Bargaining power of suppliers
- 3.5.2 Bargaining power of buyers
- 3.5.3 Threat of new entrants
- 3.5.4 Threat of substitutes
- 3.6 PESTEL analysis
Chapter 4 Competitive landscape, 2024
- 4.1 Introduction
- 4.2 Strategic dashboard
- 4.3 Innovation & technology landscape
Chapter 5 Market Size and Forecast, By Grade, 2021 - 2034 (MT, USD Million)
- 5.1 Key trends
- 5.2 Fuel grade
- 5.3 Calcined petcoke
Chapter 6 Market Size and Forecast, By Physical Form, 2021 - 2034 (MT, USD Million)
- 6.1 Key trends
- 6.2 Sponge coke
- 6.3 Purge coke
- 6.4 Shot coke
- 6.5 Needle coke
Chapter 7 Market Size and Forecast, By Application, 2021 - 2034 (MT, USD Million)
- 7.1 Key trends
- 7.2 Power plants
- 7.3 Cement industry
- 7.4 Steel industry
- 7.5 Aluminum industry
- 7.6 Others
Chapter 8 Market Size and Forecast, By Region, 2021 - 2034 (MT, USD Million)
- 8.1 Key trends
- 8.2 North America
- 8.2.1 U.S.
- 8.2.2 Canada
- 8.3 Europe
- 8.3.1 UK
- 8.3.2 Germany
- 8.3.3 France
- 8.3.4 Greece
- 8.3.5 Russia
- 8.3.6 Spain
- 8.4 Asia Pacific
- 8.4.1 China
- 8.4.2 India
- 8.4.3 Japan
- 8.4.4 Australia
- 8.5 Middle East & Africa
- 8.5.1 Saudi Arabia
- 8.5.2 Turkey
- 8.5.3 Kuwait
- 8.6 Latin America
- 8.6.1 Brazil
- 8.6.2 Argentina
- 8.6.3 Chile
- 8.6.4 Mexico
Chapter 9 Company Profiles
- 9.1 BP
- 9.2 Chevron Corporation
- 9.3 Exxon Mobil
- 9.4 HF Sinclair Corporation
- 9.5 Husky Energy
- 9.6 Marathon Petroleum Corporation
- 9.7 Oxbow Corporation
- 9.8 Phillips 66 Company
- 9.9 Reliance Industries
- 9.10 Saudi Aramco
- 9.11 Shell plc
- 9.12 Valero Energy Corp
- 9.13 Indian Oil Corporation
- 9.14 Rosneft
- 9.15 TotalEnergies