
|
시장보고서
상품코드
1721517
전기자동차용 버스바 시장 기회, 성장 촉진요인, 산업 동향 분석 및 예측(2025-2034년)Electric Vehicle Busbar Market Opportunity, Growth Drivers, Industry Trend Analysis, and Forecast 2025 - 2034 |
||||||
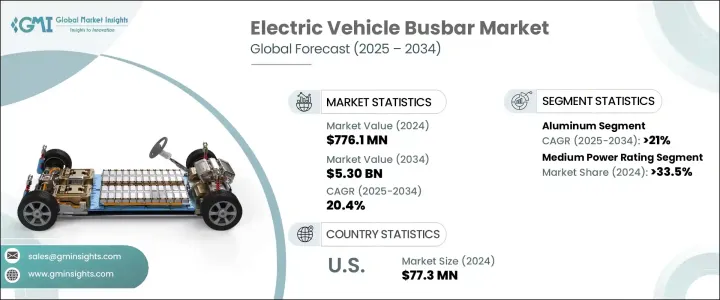
세계의 전기자동차용 버스바 시장 규모는 2024년에 7억 7,610만 달러가 되었고, CAGR 20.4%를 나타내 2034년에는 53억 달러에 달할 것으로 예측되고 있습니다. 전기자동차의 급속한 보급으로 효율적인 배전 시스템에 대한 수요가 증가하고 있으며, 버스바는 이러한 전환에서 중요한 구성 요소로 부상하고 있습니다. 자동차 섹터가 전기화로 이동하는 동안 버스바는 합리적인 전력 전달과 최적의 에너지 효율을 보장하는 능력으로 인해 EV 배터리 시스템에 필수적입니다. 환경 규제, 연비 목표, 탄소 중립에 대한 헌신에 힘입어 EV가 세계적으로 기세를 늘리고 있는 가운데 자동차 제조업체는 고성능 버스바를 필요로 하는 첨단 전기 시스템을 통합하고 있습니다. 또한 배터리 아키텍처와 차량 설계의 급속한 기술 진보와 EV 제조의 규모 확대를 위한 지속적인 노력으로 시장의 견인력이 높아지고 있습니다. 또한 EV 인프라, 특히 급속 충전 네트워크의 확대로 고전압 및 극단적인 온도를 견디는 고급 버스바 솔루션에 대한 수요가 계속 증가하고 있습니다.
EV 충전소의 설치가 세계적으로 증가하고 있는 것이 전기자동차용 버스바 시장의 확대에 중요한 역할을 하고 있습니다. 에 필수적입니다. EV의 보급이 진행됨에 따라, 빠르고 안정적이고 효율적인 충전 설정에 대한 요구도 높아지고 있으며, 에너지 손실을 최소화하면서 전류 흐름을 강화하는 견고한 버스바 기술의 필요성이 더욱 높아지고 있습니다.
| 시장 범위 | |
|---|---|
| 시작 연도 | 2024년 |
| 예측 연도 | 2025-2034년 |
| 시작 금액 | 7억 7,610만 달러 |
| 예측 금액 | 53억 달러 |
| CAGR | 20.4% |
시장은 소재별로, 주로 구리와 알루미늄으로 구분됩니다. 알루미늄 버스바는 경량이고 비용면에서 유리하기 때문에 중량과 가격이 중요한 소형 EV 모델에 최적이며, 2034년까지의 CAGR은 21%를 나타낼 것으로 예상됩니다. 한편, 구리 버스바는 그 뛰어난 전도성과 열성능에 의해 고급차나 고성능의 EV에서는 우위를 유지하고 있습니다.
시장 세분화는 정격전력으로 구분되어 낮음, 중간, 높은 카테고리가 있습니다.
미국의 전기자동차용 버스바 시장은 2024년에 7,730만 달러를 창출하였습니다. 이 정책을 통해 제조업체는 미국에서 제조 된 첨단 고효율 버스바 시스템에 투자할 것이며 세계 EV 공급망에서 미국의 역할이 더욱 커졌습니다.
세계의 전기자동차용 버스바 시장 주요 기업은 지멘스, 슈나이더 일렉트릭, TE 커넥티비티, 메르센 SA, 인피니언 테크놀로지스 AG, 루그랑, 리텔 퓨즈, 암페놀 코퍼레이션, 미쓰비시 전기 주식회사, Weidmuller Interface GmbH & Co.KG, EA 등이 있습니다. 이 회사는 차세대 전기자동차에 맞는 고성능 버스바 시스템을 제공하기 위해 R & D 투자, 생산 규모 확대 및 전략적 파트너십 형성에 적극적으로 참여하고 있습니다.
목차
제1장 조사 방법과 범위
제2장 주요 요약
제3장 업계 인사이트
- 생태계 분석
- 규제 상황
- 업계에 미치는 영향요인
- 성장 촉진요인
- 업계의 잠재적 위험 및 과제
- 성장 가능성 분석
- Porter's Five Forces 분석
- 공급기업의 협상력
- 구매자의 협상력
- 신규 참가업체의 위협
- 대체품의 위협
- PESTEL 분석
제4장 경쟁 구도
- 서론
- 전략적 대시보드
- 혁신 및 지속가능성 전망
제5장 시장 규모와 예측 : 재료별(2021-2034년)
- 주요 동향
- 구리
- 알루미늄
제6장 시장 규모와 예측 : 출력별(2021-2034년)
- 주요 동향
- 저
- 중
- 고
제7장 시장 규모와 예측 : 지역별(2021-2034년)
- 주요 동향
- 북미
- 미국
- 캐나다
- 유럽
- 노르웨이
- 독일
- 프랑스
- 네덜란드
- 영국
- 아시아태평양
- 중국
- 인도
- 일본
- 한국
- 싱가포르
- 중동 및 아프리카
- 사우디아라비아
- 아랍에미리트(UAE)
- 남아프리카
- 라틴아메리카
- 브라질
- 아르헨티나
제8장 기업 프로파일
- Amphenol Corporation
- Brar Elettromeccanica SpA
- EAE Group
- EG Electronics
- EMS Group
- Infineon Technologies AG
- Legrand
- Littelfuse, Inc.
- Mersen SA
- Mitsubishi Electric Corporation
- Rogers Corporation
- Schneider Electric
- Siemens
- TE Connectivity
- Weidmuller Interface GmbH &Co. KG
The Global Electric Vehicle Busbar Market was valued at USD 776.1 million in 2024 and is estimated to grow at a CAGR of 20.4% to reach USD 5.3 billion by 2034. The rapid acceleration in electric vehicle adoption is fueling a robust demand for efficient power distribution systems, and busbars are emerging as a critical component in this transition. As the automotive sector shifts toward electrification, busbars are becoming indispensable in EV battery systems for their ability to ensure streamlined power transfer and optimal energy efficiency. With EVs gaining momentum globally-driven by environmental regulations, fuel economy goals, and carbon neutrality commitments-automakers are integrating more advanced electrical systems that require high-performance busbars. The market is also witnessing increased traction due to rapid technological advancements in battery architecture and vehicle design, as well as ongoing efforts to scale EV manufacturing. Furthermore, the expansion of EV infrastructure, particularly in fast-charging networks, continues to boost demand for advanced busbar solutions that can withstand high voltage and extreme temperatures.

The rising installation of EV charging stations globally plays a key role in expanding the electric vehicle busbar market. These components are vital for managing high-voltage power transfers, especially in ultra-fast charging systems, which are now in high demand. As EV adoption grows, so does the requirement for fast, reliable, and efficient charging setups-further elevating the need for robust busbar technologies that enhance current flow while minimizing energy losses.
| Market Scope | |
|---|---|
| Start Year | 2024 |
| Forecast Year | 2025-2034 |
| Start Value | $776.1 Million |
| Forecast Value | $5.3 Billion |
| CAGR | 20.4% |
The market is segmented by material, primarily into copper and aluminum. Aluminum busbars are expected to witness a CAGR of 21% through 2034, owing to their lightweight nature and cost benefits, making them ideal for compact EV models where weight and affordability are critical. Meanwhile, copper busbars maintain dominance in luxury and high-performance EVs due to their superior conductivity and thermal performance. These attributes make copper an essential material in applications where power density and energy efficiency are paramount.
Segmented by power rating, the market includes low, medium, and high categories. The medium power rating segment held a 33.5% share in 2024, driven by rising demand for electric sports cars and high-end vehicles that require rapid acceleration, fast charging, and reliable energy delivery. With innovations in battery design and increasing consumer interest in premium EVs, this segment is poised to witness steady growth.
The U.S. Electric Vehicle Busbar Market generated USD 77.3 million in 2024. A key contributor to this growth is the Inflation Reduction Act (IRA), which has propelled EV demand through tax incentives for vehicles using domestically produced components like busbars. This policy is pushing manufacturers to invest in advanced, high-efficiency busbar systems made within the U.S., further enhancing the nation's role in the global EV supply chain.
Key players in the global EV busbar market include Siemens, Schneider Electric, TE Connectivity, Mersen SA, Infineon Technologies AG, Legrand, Littelfuse, Inc., Amphenol Corporation, Mitsubishi Electric Corporation, Weidmuller Interface GmbH & Co. KG, EAE Group, EG Electronics, EMS Group, and Rogers Corporation. These companies are heavily investing in R&D, scaling up production, and forming strategic partnerships to deliver high-performance busbar systems tailored to next-generation electric vehicles.
Table of Contents
Chapter 1 Methodology & Scope
- 1.1 Market definitions
- 1.2 Base estimates & calculations
- 1.3 Forecast calculation
- 1.4 Data sources
- 1.4.1 Primary
- 1.4.2 Secondary
- 1.4.2.1 Paid
- 1.4.2.2 Public
Chapter 2 Executive Summary
- 2.1 Industry synopsis, 2021 - 2034
Chapter 3 Industry Insights
- 3.1 Industry ecosystem analysis
- 3.2 Regulatory landscape
- 3.3 Industry impact forces
- 3.3.1 Growth drivers
- 3.3.2 Industry pitfalls & challenges
- 3.4 Growth potential analysis
- 3.5 Porter's analysis
- 3.5.1 Bargaining power of suppliers
- 3.5.2 Bargaining power of buyers
- 3.5.3 Threat of new entrants
- 3.5.4 Threat of substitutes
- 3.6 PESTEL analysis
Chapter 4 Competitive landscape, 2024
- 4.1 Introduction
- 4.2 Strategic dashboard
- 4.3 Innovation & sustainability landscape
Chapter 5 Market Size and Forecast, By Material, 2021 - 2034 (USD Million)
- 5.1 Key trends
- 5.2 Copper
- 5.3 Aluminum
Chapter 6 Market Size and Forecast, By Power Rating, 2021 - 2034 (USD Million)
- 6.1 Key trends
- 6.2 Low
- 6.3 Medium
- 6.4 High
Chapter 7 Market Size and Forecast, By Region, 2021 - 2034 (USD Million)
- 7.1 Key trends
- 7.2 North America
- 7.2.1 U.S.
- 7.2.2 Canada
- 7.3 Europe
- 7.3.1 Norway
- 7.3.2 Germany
- 7.3.3 France
- 7.3.4 Netherlands
- 7.3.5 UK
- 7.4 Asia Pacific
- 7.4.1 China
- 7.4.2 India
- 7.4.3 Japan
- 7.4.4 South Korea
- 7.4.5 Singapore
- 7.5 Middle East & Africa
- 7.5.1 Saudi Arabia
- 7.5.2 UAE
- 7.5.3 South Africa
- 7.6 Latin America
- 7.6.1 Brazil
- 7.6.2 Argentina
Chapter 8 Company Profiles
- 8.1 Amphenol Corporation
- 8.2 Brar Elettromeccanica SpA
- 8.3 EAE Group
- 8.4 EG Electronics
- 8.5 EMS Group
- 8.6 Infineon Technologies AG
- 8.7 Legrand
- 8.8 Littelfuse, Inc.
- 8.9 Mersen SA
- 8.10 Mitsubishi Electric Corporation
- 8.11 Rogers Corporation
- 8.12 Schneider Electric
- 8.13 Siemens
- 8.14 TE Connectivity
- 8.15 Weidmuller Interface GmbH & Co. KG

