|
시장보고서
상품코드
1740776
모듈식 변전소 시장 기회, 성장 촉진 요인, 산업 동향 분석, 예측(2025-2034년)Modular Substation Market Opportunity, Growth Drivers, Industry Trend Analysis, and Forecast 2025 - 2034 |
||||||
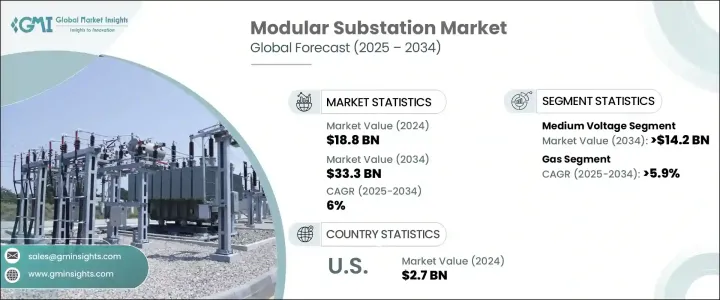
세계의 모듈식 변전소 시장은 2024년에 188억 달러로 평가되었으며, 급속한 도시화, 산업 확대, 신재생 에너지원의 국가 송전망으로의 통합 증가에 의해 CAGR 6%로, 2034년에는 333억 달러에 이를 것으로 추정되고 있습니다.
세계 전력 수요가 급증하고 있는 가운데, 모듈식 변전소는 전력 인프라의 근대화에 필수적인 솔루션으로서 기세를 늘리고 있습니다.

세계 정부와 전력 회사는 송전망의 탄력성과 스마트 그리드 업그레이드를 선호하며, 모듈식 변전소와 같은 유연하고 비용 효율적인 솔루션에 대한 필요성을 더욱 높여 왔습니다. 게다가 탈탄소화 목표에도 합치하고 있어 국가송전망의 전체적인 효율과 지속가능성을 높여가고 있습니다.
| 시장 범위 | |
|---|---|
| 시작 연도 | 2024년 |
| 예측 연도 | 2025-2034년 |
| 시작 금액 | 188억 달러 |
| 예측 금액 | 333억 달러 |
| CAGR | 6% |
모듈식 변전소는 명확한 이점에도 불구하고 고액의 초기 투자 비용과 규제상의 장애물과 같은 과제에 직면하고 있습니다. 특히 해외 공급업체에 대한 의존도가 높은 지역에서는 제조 비용을 상승시키고 있습니다. 이러한 경제적 압박은 소규모 유틸리티와 개발도상국에서 운영되는 사람들이 모듈 기술을 채택하는 것을 방해할 수 있습니다. 복잡한 허가 프로세스나, 대형 모듈 유닛의 수송과 설치에 관련하는 물류의 복잡성도, 프로젝트의 지연을 일으키게 합니다.
11kV에서 33kV까지의 중전압 부문은 2034년까지 모듈식 변전소 시장을 선도하며, 시장 규모는 142억 달러에 이를 것으로 예측됩니다. 효율적으로 배전하는데 중요한 역할을 하고 있습니다. 운전 용량과 전개 속도의 밸런스가 잡혀 있기 때문에 송전망의 강화, 네트워크의 확대, 급속한 전화 프로젝트에 중점을 두는 전력 회사에 있어서 바람직한 선택지가 되고 있습니다.
가스절연 모듈식 변전소 수요도 증가하는 경향이 있으며, 이 부문은 2034년까지 연평균 복합 성장률(CAGR) 5.9%로 성장할 것으로 예측됩니다. 컴팩트한 설계, 높은 안전 기준, 밀집한 환경에서의 강력한 성능으로 알려진 가스 절연 유닛은 대도시권이나 공업지역에서 필수적인 것으로 되어 있습니다.
미국 모듈식 변전소 시장은 2024년에 27억 달러에 달했고, 노후화한 전력망 시스템의 근대화를 추진하는 미국이 그 원동력이 되고 있습니다. 산형 발전의 중시에 따라, 모듈식 변전소는 송전망의 내장해성을 높여, 이상 기상시의 신뢰할 수 있는 전력 공급을 확보하기 위해서 불가결해지고 있습니다. ABB, Eaton Corporation, Siemens, General Electric, Schneider Electric 등에서 모두 기술 혁신, 전략적 파트너십, 스마트 그리드 기능의 확대에 주력하고 있습니다.
목차
제1장 조사 방법과 범위
제2장 주요 요약
제3장 업계 인사이트
- 생태계 분석
- 트럼프 정권의 관세 분석
- 무역에 미치는 영향
- 무역량의 혼란
- 보복조치
- 업계에 미치는 영향
- 공급측의 영향(원재료)
- 주요 원재료의 가격 변동
- 공급망 재구성
- 생산 비용에 미치는 영향
- 수요측의 영향(판매가격)
- 최종 시장에의 가격 전달
- 시장 점유율 동향
- 소비자의 반응 패턴
- 공급측의 영향(원재료)
- 영향을 받는 주요 기업
- 전략적인 업계 대응
- 공급망 재구성
- 가격 설정 및 제품 전략
- 정책관여
- 전망과 향후 검토 사항
- 무역에 미치는 영향
- 규제 상황
- 업계에 미치는 영향요인
- 성장 촉진요인
- 업계의 잠재적 위험 및 과제
- 성장 가능성 분석
- Porter's Five Forces 분석
- PESTEL 분석
제4장 경쟁 구도
- 전략적 대시보드
- 혁신과 지속가능성의 정세
제5장 시장 규모와 예측 : 전압별, 2021-2034년
- 주요 동향
- 저
- 중
- 고
제6장 시장 규모와 예측 : 절연별, 2021-2034년
- 주요 동향
- 공기
- 가스
제7장 시장 규모와 예측 : 용도별, 2021-2034년
- 주요 동향
- 상업
- 공업
- 유틸리티
제8장 시장 규모와 예측 : 지역별, 2021-2034년
- 주요 동향
- 북미
- 미국
- 캐나다
- 멕시코
- 유럽
- 영국
- 프랑스
- 독일
- 이탈리아
- 러시아
- 스페인
- 아시아태평양
- 중국
- 호주
- 인도
- 일본
- 한국
- 중동 및 아프리카
- 사우디아라비아
- 아랍에미리트(UAE)
- 튀르키예
- 남아프리카
- 이집트
- 라틴아메리카
- 브라질
- 아르헨티나
제9장 기업 프로파일
- ABB
- CHINT Global
- Doho Electric
- Eaton
- Federal Pacific
- General Electric
- Hitachi
- LS Electric
- Orecco Electric
- Schneider Electric
- Siemens
- TGOOD International
The Global Modular Substation Market was valued at USD 18.8 billion in 2024 and is estimated to grow at a CAGR of 6% to reach USD 33.3 billion by 2034, driven by rapid urbanization, industrial expansion, and the increasing integration of renewable energy sources into national grids. As global electricity demand continues to surge, modular substations are gaining momentum as a vital solution for modernizing power infrastructure. Their prefabricated, scalable designs enable quick deployment, especially critical in space-constrained urban settings and remote regions where traditional substations are impractical.
Governments and utilities worldwide are prioritizing grid resilience and smart grid upgrades, further boosting the need for flexible, cost-effective solutions like modular substations. In addition to supporting renewable energy projects, these substations align with decarbonization goals, enhancing the overall efficiency and sustainability of national grids. The growing emphasis on energy security, coupled with major investments in electrification initiatives, is setting the stage for an accelerated shift toward modular technologies over the next decade.
| Market Scope | |
|---|---|
| Start Year | 2024 |
| Forecast Year | 2025-2034 |
| Start Value | $18.8 Billion |
| Forecast Value | $33.3 Billion |
| CAGR | 6% |
Despite their clear advantages, modular substations face challenges such as high upfront investment costs and regulatory hurdles. Tariffs on imported components like transformers and switchgear have escalated production expenses, particularly in regions heavily reliant on international suppliers. These economic pressures can discourage smaller utilities and those operating in developing economies from adopting modular technologies. Complicated permitting processes and logistical complexities associated with transporting and installing large modular units can also create project delays. Overcoming these barriers calls for targeted investments in local manufacturing, strategic supply chain management, and streamlined regulatory frameworks that encourage faster deployment of modular substations.
The medium voltage segment, spanning from 11kV to 33kV, is projected to lead the modular substation market through 2034, with its value expected to hit USD 14.2 billion. Medium voltage systems play a critical role in efficiently distributing power across densely populated cities and growing rural landscapes. Their balance between operational capacity and deployment speed makes them a preferred choice for utilities focused on grid reinforcement, network expansion, and rapid electrification projects.
Demand for gas-insulated modular substations is also on the rise, with the segment anticipated to grow at a CAGR of 5.9% through 2034. Known for their compact design, high safety standards, and strong performance in dense environments, gas-insulated units have become essential in metropolitan areas and industrial zones. Their sealed enclosures protect critical components from harsh environmental factors, significantly reducing maintenance requirements and extending operational lifespan.
The United States Modular Substation Market reached USD 2.7 billion in 2024, driven by the country's push to modernize aging grid systems. With increasing electrification, renewable energy adoption, and a focus on decentralized power generation, modular substations are proving vital for boosting grid resilience and ensuring reliable power supply during extreme weather events. Key players leading the global market include ABB, Eaton Corporation, Siemens, General Electric, and Schneider Electric, all focusing on innovation, strategic partnerships, and expanding smart grid capabilities.
Table of Contents
Chapter 1 Methodology & Scope
- 1.1 Market definitions
- 1.2 Base estimates & calculations
- 1.3 Forecast calculation
- 1.4 Data sources
- 1.4.1 Primary
- 1.4.2 Secondary
- 1.4.2.1 Paid
- 1.4.2.2 Public
Chapter 2 Executive Summary
- 2.1 Industry synopsis, 2021 – 2034
Chapter 3 Industry Insights
- 3.1 Industry ecosystem analysis
- 3.2 Trump administration tariff analysis
- 3.2.1 Impact on trade
- 3.2.1.1 Trade volume disruptions
- 3.2.1.2 Retaliatory measures
- 3.2.2 Impact on the industry
- 3.2.2.1 Supply-side impact (raw materials)
- 3.2.2.1.1 Price volatility in key materials
- 3.2.2.1.2 Supply chain restructuring
- 3.2.2.1.3 Production cost implications
- 3.2.2.2 Demand-side impact (selling price)
- 3.2.2.2.1 Price transmission to end markets
- 3.2.2.2.2 Market share dynamics
- 3.2.2.2.3 Consumer response patterns
- 3.2.2.1 Supply-side impact (raw materials)
- 3.2.3 Key companies impacted
- 3.2.4 Strategic industry responses
- 3.2.4.1 Supply chain reconfiguration
- 3.2.4.2 Pricing and product strategies
- 3.2.4.3 Policy engagement
- 3.2.5 Outlook and future considerations
- 3.2.1 Impact on trade
- 3.3 Regulatory landscape
- 3.4 Industry impact forces
- 3.4.1 Growth drivers
- 3.4.2 Industry pitfalls & challenges
- 3.5 Growth potential analysis
- 3.6 Porter's analysis
- 3.6.1 Bargaining power of suppliers
- 3.6.2 Bargaining power of buyers
- 3.6.3 Threat of new entrants
- 3.6.4 Threat of substitutes
- 3.7 PESTEL analysis
Chapter 4 Competitive landscape, 2024
- 4.1 Strategic dashboard
- 4.2 Innovation & sustainability landscape
Chapter 5 Market Size and Forecast, By Voltage, 2021 - 2034 (USD Million)
- 5.1 Key trends
- 5.2 Low
- 5.3 Medium
- 5.4 High
Chapter 6 Market Size and Forecast, By Insulation, 2021 - 2034 (USD Million)
- 6.1 Key trends
- 6.2 Air
- 6.3 Gas
Chapter 7 Market Size and Forecast, By Application, 2021 - 2034 (USD Million)
- 7.1 Key trends
- 7.2 Commercial
- 7.3 Industrial
- 7.4 Utility
Chapter 8 Market Size and Forecast, By Region, 2021 - 2034 (USD Million)
- 8.1 Key trends
- 8.2 North America
- 8.2.1 U.S.
- 8.2.2 Canada
- 8.2.3 Mexico
- 8.3 Europe
- 8.3.1 UK
- 8.3.2 France
- 8.3.3 Germany
- 8.3.4 Italy
- 8.3.5 Russia
- 8.3.6 Spain
- 8.4 Asia Pacific
- 8.4.1 China
- 8.4.2 Australia
- 8.4.3 India
- 8.4.4 Japan
- 8.4.5 South Korea
- 8.5 Middle East & Africa
- 8.5.1 Saudi Arabia
- 8.5.2 UAE
- 8.5.3 Turkey
- 8.5.4 South Africa
- 8.5.5 Egypt
- 8.6 Latin America
- 8.6.1 Brazil
- 8.6.2 Argentina
Chapter 9 Company Profiles
- 9.1 ABB
- 9.2 CHINT Global
- 9.3 Doho Electric
- 9.4 Eaton
- 9.5 Federal Pacific
- 9.6 General Electric
- 9.7 Hitachi
- 9.8 LS Electric
- 9.9 Orecco Electric
- 9.10 Schneider Electric
- 9.11 Siemens
- 9.12 TGOOD International