
|
시장보고서
상품코드
1740863
스위치기어 모니터링 시스템 시장 기회, 성장 촉진요인, 산업 동향 분석 및 예측(2025-2034년)Switchgear Monitoring System Market Opportunity, Growth Drivers, Industry Trend Analysis, and Forecast 2025 - 2034 |
||||||
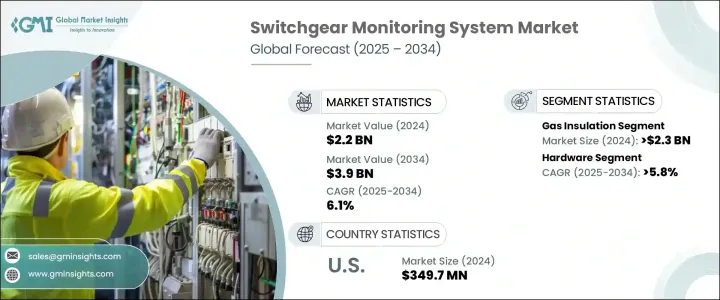
세계의 스위치기어 모니터링 시스템 시장 규모는 2024년에는 22억 달러에 달했고, CAGR 6.1%를 나타내 2034년에는 39억 달러에 이를 것으로 예측되고 있습니다.
스마트 전력 인프라의 진화와 함께 송전망의 안정성과 회복력에 대한 요구가 높아지고 있는 것이 이 수요 급증의 원동력이 되고 있습니다. 시간을 최소화하고 운영 효율성을 높이기 위해 실시간 모니터링 및 예측 유지 보수 솔루션을 찾고 있습니다.
특히 센서 통합, 데이터 분석, 자동화 분야의 기술 진보가 지능형 모니터링 솔루션의 채택에 박차를 가하고 있습니다. 발전과 배전에 변동을 가져오기 위해 시스템의 신뢰성을 유지하고 화석연료에 대한 의존도를 줄이기 위해서는 고도의 모니터링이 필수적입니다.
| 시장 범위 | |
|---|---|
| 시작 연도 | 2024년 |
| 예측 연도 | 2025-2034년 |
| 시작 금액 | 22억 달러 |
| 예측 금액 | 39억 달러 |
| CAGR | 6.1% |
2022년부터 2024년까지 스위치기어 모니터링 시스템 업계는 일관된 성장을 이루고 있습니다. 2024년에는 22억 달러에 달했습니다. 이 성장 궤도는 산업 제조, 상업 인프라, 유틸리티 네트워크 등의 부문에서 중단 없는 안정된 전력 공급에 대한 수요가 높습니다. 세계의 전력 수요가 높아짐에 따라 전기 부품을 보호하고 에너지 흐름을 최적화하는 시스템의 도입이 급선무가 되고 있습니다.
시장의 기세에 크게 기여하고 있는 것은 특히 신흥국 시장에서의 전기 인프라의 노후화입니다. 노후화된 송전망은 최신 에너지 수요를 충족하는 동시에 최신 규제 요건을 준수하기 위해 스마트 구성 요소에서 업그레이드되고 있습니다.
이 시장의 하드웨어 부문은 2034년까지 연평균 복합 성장률(CAGR) 5.8% 이상을 나타낼 것으로 예측됩니다. 실시간 진단 기능에 대한 수요가 센서, 릴레이, 회로 차단기, 통신 모듈 등의 하드웨어 구성 요소의 개발과 배포를 가속하고 있습니다. 절연체의 건전성, 온도 변동, 전기적 이상에 대한 중요한 인사이트를 제공합니다.
미국에서는 스위치기어 모니터링 시스템 시장이 일관된 성장을 이루고 있으며, 2022년에는 3억 2,210만 달러, 2023년에는 3억 3,530만 달러, 2024년에는 3억 4,970만 달러에 이르는 등 에너지 효율성과 운영 신뢰성을 촉진하는 연방 및 주 수준의 규제 이니셔티브가 이 증가에 있어 매우 중요한 역할을 하고 있습니다. 디지털 그리드 기술과 신재생에너지원의 통합에 대한 엄청난 투자는 전력회사와 산업사업자에게 자산 전체의 가시성과 제어를 강화하는 고급 모니터링 솔루션의 채용을 촉구하고 있습니다.
시장의 주요 기업은 기술 혁신, 전략적 세계 생산 기지 및 연구 능력을 통해 경쟁 구도를 형성하고 있습니다. 지역 시장의 성장을 지원하면서 고객에게 더 높은 가치를 제공합니다.
목차
제1장 조사 방법과 범위
제2장 주요 요약
제3장 업계 인사이트
- 생태계 분석
- 트럼프 정권의 관세 분석
- 무역에 미치는 영향
- 무역량의 혼란
- 보복 조치
- 업계에 미치는 영향
- 공급측의 영향(원재료)
- 주요 원재료의 가격 변동
- 공급망 재구성
- 생산 비용에 미치는 영향
- 수요측의 영향(판매가격)
- 최종 시장에의 가격 전달
- 시장 점유율 동향
- 소비자의 반응 패턴
- 공급측의 영향(원재료)
- 영향을 받는 주요 기업
- 전략적인 업계 대응
- 공급망 재구성
- 가격 설정 및 제품 전략
- 정책관여
- 전망과 향후 검토 사항
- 무역에 미치는 영향
- 규제 상황
- 업계에 미치는 영향요인
- 성장 촉진요인
- 업계의 잠재적 위험 및 과제
- 성장 가능성 분석
- Porter's Five Forces 분석
- PESTEL 분석
제4장 경쟁 구도
- 전략적 대시보드
- 혁신 및 지속가능성 전망
제5장 시장 규모와 예측 : 단열재별(2021-2034년)
- 주요 동향
- 가스 단열재
- 공기 단열재
제6장 시장 규모와 예측 : 구성 요소별(2021-2034년)
- 주요 동향
- 하드웨어
- 지능형 기기
- 배전망 피더
- 기타
- 소프트웨어
제7장 시장 규모와 예측 : 서비스별(2021-2034년)
- 주요 동향
- 부분 방전 모니터링
- 가스 모니터링
- 온도 모니터링
- 기타 서비스
제8장 시장 규모와 예측 : 전압별(2021-2034년)
- 주요 동향
- 낮음
- 중간
- 높음 및 매우 높음
제9장 시장 규모와 예측 : 최종 용도별(2021-2034년)
- 주요 동향
- 유틸리티
- 산업
- 상업
제10장 시장 규모와 예측 : 지역별(2021-2034년)
- 주요 동향
- 북미
- 미국
- 캐나다
- 멕시코
- 유럽
- 영국
- 프랑스
- 독일
- 이탈리아
- 러시아
- 스페인
- 아시아태평양
- 중국
- 호주
- 인도
- 일본
- 한국
- 중동 및 아프리카
- 사우디아라비아
- 아랍에미리트(UAE)
- 튀르키예
- 남아프리카
- 이집트
- 라틴아메리카
- 브라질
- 아르헨티나
제11장 기업 프로파일
- ABB
- Dynamic Ratings
- Eaton
- Emerson Electric
- General Electric
- Hitachi
- IPEC LTD.
- MEGGER
- Mitsubishi Electric
- OSENA Innovations
- Schneider Electric
- SENSEOR
- Siemens
The Global Switchgear Monitoring System Market was valued at USD 2.2 billion in 2024 and is estimated to grow at a CAGR of 6.1% to reach USD 3.9 billion by 2034. The increasing need for grid stability and resilience, combined with the evolution of smart power infrastructure, is driving this surge in demand. As electricity distribution networks around the world become more decentralized and complex, utility operators and infrastructure providers are seeking real-time monitoring and predictive maintenance solutions to minimize downtime and improve operational efficiency. These systems enable early detection of faults and performance degradation, which in turn helps prevent unexpected power outages and costly repairs.
Technological progress, especially in the areas of sensor integration, data analytics, and automation, is fueling the adoption of intelligent monitoring solutions. Modern power grids are undergoing major transformations to accommodate fluctuating energy loads and diverse generation sources, particularly renewable energy. The shift towards cleaner energy sources introduces variability in power generation and distribution, making advanced monitoring essential for maintaining system reliability and reducing dependency on fossil fuels. With a growing emphasis on environmental sustainability, real-time monitoring systems are becoming key enablers of energy efficiency, carbon reduction, and long-term infrastructure reliability.
| Market Scope | |
|---|---|
| Start Year | 2024 |
| Forecast Year | 2025-2034 |
| Start Value | $2.2 Billion |
| Forecast Value | $3.9 Billion |
| CAGR | 6.1% |
Between 2022 and 2024, the switchgear monitoring system industry has experienced consistent growth. It was valued at USD 2 billion in 2022, reached USD 2.1 billion in 2023, and hit USD 2.2 billion by 2024. This growth trajectory is largely influenced by the rising demand for uninterrupted and stable electricity supply across sectors such as industrial manufacturing, commercial infrastructure, and utility networks. Power demand worldwide is climbing, and with it, the urgency to implement systems that safeguard electrical components and optimize energy flow. Switchgear, being a critical element in power management and safety, is increasingly being equipped with advanced monitoring systems that ensure continuous performance, reduce operational risks, and extend equipment lifespan.
A significant contributor to the market's momentum is the aging electrical infrastructure, particularly in developed regions. Rather than replacing entire systems, many utility providers are opting for retrofitting solutions that include intelligent switchgear monitoring. These solutions offer a cost-effective way to boost reliability and safety without major overhauls. Aging grids are being upgraded with smart components to meet modern energy demands while also staying compliant with updated regulatory requirements. Predictive analytics, real-time data acquisition, and early fault alerts allow operators to plan maintenance efficiently and avoid catastrophic failures.
The hardware segment within this market is growing at a projected CAGR of over 5.8% through 2034. Demand for real-time diagnostic capabilities is accelerating the development and deployment of hardware components like sensors, relays, circuit breakers, and communication modules. These components form the core of monitoring systems, delivering critical insights into insulation health, temperature fluctuations, and electrical anomalies. As infrastructure operators seek greater transparency and control, hardware innovations are enabling more robust, responsive, and intelligent systems to handle the complexities of modern power distribution.
In the United States, the switchgear monitoring system market has seen consistent growth, reaching USD 322.1 million in 2022, USD 335.3 million in 2023, and USD 349.7 million in 2024. Federal and state-level regulatory initiatives promoting energy efficiency and operational reliability are playing a pivotal role in this increase. Additionally, substantial investments in digital grid technology and the integration of renewable energy sources have prompted utility companies and industrial operators to adopt advanced monitoring solutions that enhance visibility and control across their assets. As grids become more dynamic and demand patterns shift, real-time surveillance and fault detection are becoming indispensable tools for operational success.
Key market players continue to shape the competitive landscape through innovation, strategic global manufacturing footprints, and research capabilities. These companies benefit from established supply chains and strong reputations for quality and reliability. Their global operations help streamline delivery times and reduce production costs, offering enhanced value to customers while supporting regional market growth. As the demand for efficient, secure, and scalable power systems rises, these players are well-positioned to capitalize on emerging opportunities in both developed and developing markets.
Table of Contents
Chapter 1 Methodology & Scope
- 1.1 Market definitions
- 1.2 Base estimates & calculations
- 1.3 Forecast calculation
- 1.4 Data sources
- 1.4.1 Primary
- 1.4.2 Secondary
- 1.4.2.1 Paid
- 1.4.2.2 Public
Chapter 2 Executive Summary
- 2.1 Industry synopsis, 2021 - 2034
Chapter 3 Industry Insights
- 3.1 Industry ecosystem analysis
- 3.2 Trump administration tariff analysis
- 3.2.1 Impact on trade
- 3.2.1.1 Trade volume disruptions
- 3.2.1.2 Retaliatory measures
- 3.2.2 Impact on the industry
- 3.2.2.1 Supply-side impact (raw materials)
- 3.2.2.1.1 Price volatility in key materials
- 3.2.2.1.2 Supply chain restructuring
- 3.2.2.1.3 Production cost implications
- 3.2.2.2 Demand-side impact (selling price)
- 3.2.2.2.1 Price transmission to end markets
- 3.2.2.2.2 Market share dynamics
- 3.2.2.2.3 Consumer response patterns
- 3.2.2.1 Supply-side impact (raw materials)
- 3.2.3 Key companies impacted
- 3.2.4 Strategic industry responses
- 3.2.4.1 Supply chain reconfiguration
- 3.2.4.2 Pricing and product strategies
- 3.2.4.3 Policy engagement
- 3.2.5 Outlook and future considerations
- 3.2.1 Impact on trade
- 3.3 Regulatory landscape
- 3.4 Industry impact forces
- 3.4.1 Growth drivers
- 3.4.2 Industry pitfalls & challenges
- 3.5 Growth potential analysis
- 3.6 Porter's analysis
- 3.6.1 Bargaining power of suppliers
- 3.6.2 Bargaining power of buyers
- 3.6.3 Threat of new entrants
- 3.6.4 Threat of substitutes
- 3.7 PESTEL analysis
Chapter 4 Competitive Landscape, 2024
- 4.1 Strategic dashboard
- 4.2 Innovation & sustainability landscape
Chapter 5 Market Size and Forecast, By Insulation, 2021 - 2034 (USD Million)
- 5.1 Key trends
- 5.2 Gas insulation
- 5.3 Air insulation
Chapter 6 Market Size and Forecast, By Component, 2021 - 2034 (USD Million)
- 6.1 Key trends
- 6.2 Hardware
- 6.2.1 Intelligent equipment devices
- 6.2.2 Distribution network feeders
- 6.2.3 Others
- 6.3 Software
Chapter 7 Market Size and Forecast, By Service, 2021 - 2034 (USD Million)
- 7.1 Key trends
- 7.2 Partial discharge monitoring
- 7.3 Gas monitoring
- 7.4 Temperature monitoring
- 7.5 Other services
Chapter 8 Market Size and Forecast, By Voltage, 2021 - 2034 (USD Million)
- 8.1 Key trends
- 8.2 Low
- 8.3 Medium
- 8.4 High & extra high
Chapter 9 Market Size and Forecast, By End Use, 2021 - 2034 (USD Million)
- 9.1 Key trends
- 9.2 Utilities
- 9.3 Industrial
- 9.4 Commercial
Chapter 10 Market Size and Forecast, By Region, 2021 - 2034 (USD Million)
- 10.1 Key trends
- 10.2 North America
- 10.2.1 U.S.
- 10.2.2 Canada
- 10.2.3 Mexico
- 10.3 Europe
- 10.3.1 UK
- 10.3.2 France
- 10.3.3 Germany
- 10.3.4 Italy
- 10.3.5 Russia
- 10.3.6 Spain
- 10.4 Asia Pacific
- 10.4.1 China
- 10.4.2 Australia
- 10.4.3 India
- 10.4.4 Japan
- 10.4.5 South Korea
- 10.5 Middle East & Africa
- 10.5.1 Saudi Arabia
- 10.5.2 UAE
- 10.5.3 Turkey
- 10.5.4 South Africa
- 10.5.5 Egypt
- 10.6 Latin America
- 10.6.1 Brazil
- 10.6.2 Argentina
Chapter 11 Company Profiles
- 11.1 ABB
- 11.2 Dynamic Ratings
- 11.3 Eaton
- 11.4 Emerson Electric
- 11.5 General Electric
- 11.6 Hitachi
- 11.7 IPEC LTD.
- 11.8 MEGGER
- 11.9 Mitsubishi Electric
- 11.10 OSENA Innovations
- 11.11 Schneider Electric
- 11.12 SENSEOR
- 11.13 Siemens
