|
시장보고서
상품코드
1740976
자동차용 3D 지도 시스템 시장 : 기회, 성장 촉진요인, 산업 동향 분석, 예측(2025-2034년)Automotive 3D Map System Market Opportunity, Growth Drivers, Industry Trend Analysis, and Forecast 2025 - 2034 |
||||||
세계의 자동차용 3D 지도 시스템 시장 규모는 2024년 54억 달러였고, CAGR 11.1%로 성장하여 2034년까지 149억 달러에 이를 것으로 추정됩니다. 보다 스마트한 모빌리티 솔루션으로 축족을 옮기는 중, 제조업체는 3D 맵의 역할을 강화하는 기술에 다액의 투자를 실시했습니다. 실시간으로 상황을 파악할 수 있는 네비게이션에 대한 소비자의 기대가 높아지는 가운데 자동차 제조업체는 3D 매핑 시스템을 차량 라인업 전체의 표준 컴포넌트로 하고 있습니다.

시장은 컴포넌트별로 하드웨어, 소프트웨어, 서비스로 구분됩니다. 인공지능과 클라우드 컴퓨팅의 진보로 매핑 소프트웨어는 변화하는 교통 상황, 도로 폐쇄, 환경 요인에 실시간으로 적응하는 고도로 역동적인 플랫폼으로 변모하고 있습니다. 자동차 제조업체는 현재 예측 경로 계획과 운전 행동 분석을 개선하기 위해 클라우드 지원 지도 시스템을 선호하고 사용하고 있습니다. 자동차 제조업체는 독자적인 사용자 프로파일, 미적 테마, 풍부한 데이터 오버레이를 지원하는 다목적 플랫폼을 도입하여 지도 소프트웨어를 인포테인먼트 시스템에서 중요한 차별화 요인으로 삼고 있습니다.
| 시장 범위 | |
|---|---|
| 시작 연도 | 2024년 |
| 예측 연도 | 2025-2034년 |
| 시작 금액 | 54억 달러 |
| 예측 금액 | 149억 달러 |
| CAGR | 11.1% |
하드웨어는 또한 3D 매핑 기술을 지원하는 데 중요한 역할을 하고 있습니다. 물체 검출, 심도 추정, 도로 경계 인식에 크게 기여하고 있습니다.
차량 유형별로 분류하면 승용차, 상용차, 오프로드 차량이 포함되어 있습니다. 차선 유지 지원과 적응 크루즈 컨트롤과 같은 기능은 고정밀도 지도에 크게 의존하기 때문에 자동차 제조업체는 보다 폭넓은 차종에 고급 지도 시스템을 탑재하게 되어 있습니다.
또한 시장은 네비게이션 디스플레이 형태별로 대시보드 내 시스템, 헤드업 디스플레이(HUD), 증강현실(AR) 네비게이션으로 구분됩니다. 소비자는 애프터마켓의 GPS 장치에서 점차 멀어지고 통합된 공장 설치 시스템을 선호합니다. 대시 맵을 고해상도 디스플레이 및 지능형 오버레이와 결합하면 사용자 만족도가 더욱 향상됩니다. 3D 맵핑과 AR의 통합은 HUD 기반 시스템을 더욱 강화하고 대화식으로 시각적으로 직관적인 것으로 만듭니다.
판매 채널의 관점에서 OEM이 2024년에는 60% 이상의 점유율을 차지하고 시장을 독점했습니다. 자동차 센서와의 완벽한 통합을 보장하고 자율 주행 기능과 관련된 규제 요구 사항을 충족하기 위해 공장 수준에서 3D지도 시스템을 자동차에 통합합니다. 이 시스템은 차량 전체를 교체하지 않고도 네비게이션과 ADAS 기능을 강화하기 위한 확장 가능하고 개조에 적합한 솔루션을 제공합니다.
지역별로는 북미가 2024년 세계 시장을 선도해 총 매출의 35% 이상을 차지했습니다. 하이테크 섹터의 투자, 광대한 교통 인프라의 조합은 3D 매핑 기술 혁신의 중심적인 거점이 되고 있습니다.
이 시장에는 세계적인 기술 공급자, 매핑 소프트웨어 개발 기업, 지역 밀착형 기업이 혼재되어 있습니다. 지역 기업은 신흥 시장에서 급속히 확대하고 있으며, 지역의 도로 상황이나 소비자 요구에 맞춘, 저렴한 가격으로 확장성과 적응성이 있는 솔루션을 제공합니다.
목차
제1장 조사 방법과 범위
제2장 주요 요약
제3장 업계 인사이트
- 업계 생태계 분석
- 공급자의 상황
- 부품 공급자
- 기술 공급자
- 소프트웨어 제공업체
- 리셀러
- 최종 용도
- 트럼프 정권에 의한 관세에 대한 영향
- 무역에 미치는 영향
- 무역량의 혼란
- 보복 조치
- 업계에 미치는 영향
- 공급측의 영향(원재료)
- 주요 원재료의 가격 변동
- 공급망 재구성
- 생산 비용에 미치는 영향
- 수요측의 영향(고객에 대한 비용)
- 최종 시장에의 가격 전달
- 시장 점유율 동향
- 소비자의 반응 패턴
- 공급측의 영향(원재료)
- 영향을 받는 주요 기업
- 전략적인 업계 대응
- 공급망 재구성
- 가격 설정 및 제품 전략
- 정책관여
- 전망과 향후 검토 사항
- 무역에 미치는 영향
- 이익률 분석
- 기술과 혁신의 상황
- 특허 분석
- 주요 뉴스와 대처
- 규제 상황
- 이용 사례
- 영향요인
- 성장 촉진요인
- 실시간 고정밀 지도를 필요로 하는 자율주행차 수요 증가
- ADAS와 안전기술의 도입을 추진하는 정부규제
- OEM 공장 출하 시 인포테인먼트 시스템에 3D 맵 통합
- V2X 통신을 지원하는 스마트 시티와 커넥티드 인프라 확대
- 업계의 잠재적 리스크 및 과제
- 실시간의 고해상도 지도 개발 및 유지보수에 드는 비용이 증가
- 위치 정보 서비스와 관련된 데이터 프라이버시 및 사이버 보안 우려
- 성장 촉진요인
- 성장 가능성 분석
- Porter's Five Forces 분석
- PESTEL 분석
제4장 경쟁 구도
- 소개
- 기업의 시장 점유율 분석
- 경쟁 포지셔닝 매트릭스
- 전략적 전망 매트릭스
제5장 시장 추계 및 예측 : 컴포넌트별, 2021-2034년
- 주요 동향
- 하드웨어
- 소프트웨어
- 서비스
제6장 시장 추계 및 예측 : 내비게이션별, 2021-2034년
- 주요 동향
- 인 대시 내비게이션
- 헤드업 디스플레이(HUD)
- 증강현실(AR) 내비게이션
제7장 시장 추계 및 예측 : 차량별, 2021-2034년
- 주요 동향
- 승용차
- 해치백
- 세단
- SUV
- 상용차
- 소형 상용차(LCV)
- 중형 상용차(MCV)
- 대형 상용차(HCV)
- 오프로드 자동차
제8장 시장 추계 및 예측 : 용도별, 2021-2034년
- 주요 동향
- ADAS
- 자율주행
- 자동차 네비게이션
- 차량 및 물류 관리
- 기타
제9장 시장 추계 및 예측 : 판매 채널별, 2021-2034년
- 주요 동향
- OEM
- 애프터마켓
제10장 시장 추계 및 예측 : 지역별, 2021-2034년
- 주요 동향
- 북미
- 미국
- 캐나다
- 유럽
- 영국
- 독일
- 프랑스
- 이탈리아
- 스페인
- 러시아
- 북유럽 국가
- 아시아태평양
- 중국
- 인도
- 일본
- 한국
- 호주 및 뉴질랜드
- 동남아시아
- 라틴아메리카
- 브라질
- 멕시코
- 아르헨티나
- 중동 및 아프리카
- 아랍에미리트(UAE)
- 사우디아라비아
- 남아프리카
제11장 기업 프로파일
- 3D Mapping
- Carmera
- Civil Maps
- Deepmap
- Dynamic Map Platform
- Elektrobit
- Garmin
- HERE Technologies
- Inrix
- MapBox
- Microsoft
- Mitsubishi
- Mobileye
- NavInfo
- Nvidia
- Telenav
- TomTom
- Trimble
- Valeo
The Global Automotive 3D Map System Market was valued at USD 5.4 billion in 2024 and is estimated to grow at a CAGR of 11.1% to reach USD 14.9 billion by 2034. This growth is largely driven by the rapid expansion of autonomous vehicle technologies. As vehicles become increasingly automated, 3D maps are emerging as a critical enabler of advanced features such as precise lane localization, real-time obstacle detection, and intelligent route planning. High-definition mapping is essential for vehicles operating at Levels 3 to 5 autonomy, delivering an environmental context that goes beyond the line of sight of onboard sensors. Without these detailed maps, autonomous systems lack the necessary data for complex decision-making. As the industry pivots toward smarter mobility solutions, manufacturers are heavily investing in technologies that enhance the role of 3D maps. These maps not only boost safety and performance but also help create a better in-vehicle experience. Research and development in autonomous driving and advanced driver assistance systems (ADAS) continue to accelerate innovations in 3D mapping. With increasing consumer expectations for real-time, context-aware navigation, automakers are making 3D mapping systems a standard component across vehicle lineups. Collaborations between car manufacturers and digital map developers are becoming more common as they aim to deliver integrated and branded navigation experiences.
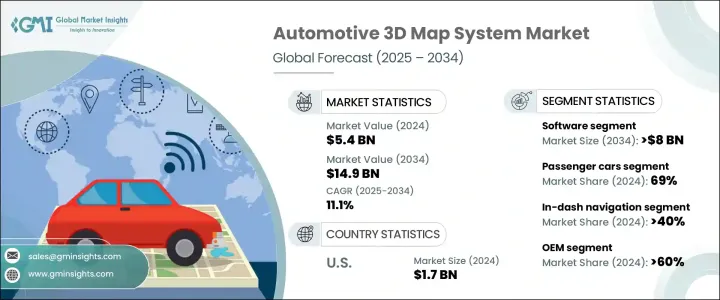
The market is segmented by component into hardware, software, and services. In 2024, the software segment dominated the industry with approximately 50% of the overall market share and is forecasted to surpass USD 8 billion by 2034. Advancements in artificial intelligence and cloud computing are transforming mapping software into highly dynamic platforms that adapt in real-time to changing traffic conditions, road closures, and environmental factors. Automakers are now favoring cloud-enabled mapping systems to improve predictive route planning and driving behavior analysis. As drivers increasingly seek personalized digital experiences, the demand for customizable map software continues to rise. Automakers are deploying versatile platforms that support unique user profiles, aesthetic themes, and data-rich overlays, making mapping software a key differentiator in infotainment systems.
| Market Scope | |
|---|---|
| Start Year | 2024 |
| Forecast Year | 2025-2034 |
| Start Value | $5.4 Billion |
| Forecast Value | $14.9 Billion |
| CAGR | 11.1% |
Hardware also plays a vital role in supporting 3D mapping technology. Vehicles equipped with LiDAR, radar, and HD cameras generate detailed spatial data essential for accurate map creation. These sensors contribute significantly to object detection, depth estimation, and road boundary recognition. As the cost of sensors drops, mid-range vehicles are also expected to feature such technologies, boosting the hardware segment's growth in the coming decade.
When segmented by vehicle type, the market includes passenger cars, commercial vehicles, and off-road vehicles. Passenger cars led the market in 2024, holding a 69% share. Drivers navigating increasingly dense and complex roadways are now relying on 3D maps for a clearer, more interactive understanding of their surroundings. Features like lane-keeping assistance and adaptive cruise control depend heavily on precision mapping, prompting automakers to incorporate advanced map systems into a wider range of car models. As digital cockpits become more sophisticated, 3D maps are turning into essential features that enhance the overall driving experience.
The market is also divided based on navigation display formats: in-dash systems, Heads-Up Displays (HUD), and Augmented Reality (AR) navigation. In-dash navigation currently leads the segment with over 40% market share. Consumers are gradually moving away from aftermarket GPS devices and favoring integrated, factory-installed systems. These in-dash displays offer seamless user experiences, enhanced reliability, and minimal driver distraction. Pairing in-dash maps with high-resolution displays and intelligent overlays further improves user satisfaction. Meanwhile, HUD technology is gaining traction as a safety-forward innovation, allowing drivers to keep their eyes on the road while receiving real-time route and hazard data. The integration of 3D mapping with AR will further strengthen HUD-based systems, making them interactive and visually intuitive.
From a sales channel perspective, OEMs dominate the market with a share exceeding 60% in 2024. This segment is projected to grow at over 11.5% CAGR through 2034. Automakers are embedding 3D map systems into vehicles at the factory level to ensure seamless integration with onboard sensors and to meet regulatory requirements associated with autonomous features. These built-in solutions offer better performance, system reliability, and consumer trust compared to aftermarket alternatives. That said, aftermarket 3D map systems continue to gain traction among owners of older vehicles and fleet operators looking for cost-effective upgrades. These systems offer scalable, retrofit-friendly solutions for enhancing navigation and ADAS capabilities without replacing entire vehicle fleets.
Regionally, North America led the global market in 2024, contributing over 35% of total revenue. The U.S. alone accounted for USD 1.7 billion, driven by growing advancements in autonomous vehicle testing, smart infrastructure initiatives, and increasing consumer demand for safety-oriented features. The country has become a central hub for innovation in 3D mapping technologies, thanks to a combination of legal frameworks, tech-sector investment, and an expansive transportation infrastructure. These factors enable the rapid deployment and real-time testing of high-definition mapping systems under a wide range of driving conditions.
The market features a mix of global tech providers, mapping software developers, and localized players. Tier 1 suppliers offer cloud-based platforms, AI-enhanced perception tools, and vehicle-to-everything (V2X) integration capabilities tailored to OEM needs. Meanwhile, regional firms are rapidly expanding in emerging markets, offering affordable, scalable, and adaptable solutions tailored to local road conditions and consumer needs.
Table of Contents
Chapter 1 Methodology & Scope
- 1.1 Research design
- 1.1.1 Research approach
- 1.1.2 Data collection methods
- 1.2 Base estimates and calculations
- 1.2.1 Base year calculation
- 1.2.2 Key trends for market estimates
- 1.3 Forecast model
- 1.4 Primary research & validation
- 1.4.1 Primary sources
- 1.4.2 Data mining sources
- 1.5 Market definitions
Chapter 2 Executive Summary
- 2.1 Industry 3600 synopsis, 2021 - 2034
Chapter 3 Industry Insights
- 3.1 Industry ecosystem analysis
- 3.2 Supplier landscape
- 3.2.1 Component supplier
- 3.2.2 Technology providers
- 3.2.3 Software providers
- 3.2.4 Distributors
- 3.2.5 End use
- 3.3 Impact of Trump administration tariffs
- 3.3.1 Trade impact
- 3.3.1.1 Trade volume disruptions
- 3.3.1.2 Retaliatory measures
- 3.3.2 Impact on industry
- 3.3.2.1 Supply-side impact (raw materials)
- 3.3.2.1.1 Price volatility in key materials
- 3.3.2.1.2 Supply chain restructuring
- 3.3.2.1.3 Production cost implications
- 3.3.2.2 Demand-side impact (Cost to customers)
- 3.3.2.2.1 Price transmission to end markets
- 3.3.2.2.2 Market share dynamics
- 3.3.2.2.3 Consumer response patterns
- 3.3.2.1 Supply-side impact (raw materials)
- 3.3.3 Key companies impacted
- 3.3.4 Strategic industry responses
- 3.3.4.1 Supply chain reconfiguration
- 3.3.4.2 Pricing and product strategies
- 3.3.4.3 Policy engagement
- 3.3.5 Outlook & future considerations
- 3.3.1 Trade impact
- 3.4 Profit margin analysis
- 3.5 Technology & innovation landscape
- 3.6 Patent analysis
- 3.7 Key news & initiatives
- 3.8 Regulatory landscape
- 3.9 Use cases
- 3.10 Impact on forces
- 3.10.1 Growth drivers
- 3.10.1.1 Rising demand for autonomous vehicles requiring real-time, high-precision maps
- 3.10.1.2 Government regulations pushing adoption of ADAS and safety technologies
- 3.10.1.3 Integration of 3D maps into factory-installed infotainment systems by OEMs
- 3.10.1.4 Expansion of smart cities and connected infrastructure supporting V2X communication
- 3.10.2 Industry pitfalls & challenges
- 3.10.2.1 High development and maintenance costs for real-time, high-resolution maps
- 3.10.2.2 Data privacy and cybersecurity concerns related to location-based services
- 3.10.1 Growth drivers
- 3.11 Growth potential analysis
- 3.12 Porter's analysis
- 3.13 PESTEL analysis
Chapter 4 Competitive Landscape, 2024
- 4.1 Introduction
- 4.2 Company market share analysis
- 4.3 Competitive positioning matrix
- 4.4 Strategic outlook matrix
Chapter 5 Market Estimates & Forecast, By Component, 2021 - 2034 ($Bn)
- 5.1 Key trends
- 5.2 Hardware
- 5.3 Software
- 5.4 Services
Chapter 6 Market Estimates & Forecast, By Navigation, 2021 - 2034 ($Bn)
- 6.1 Key trends
- 6.2 In-dash navigation
- 6.3 Heads-Up Display (HUD)
- 6.4 Augmented Reality (AR) navigation
Chapter 7 Market Estimates & Forecast, By Vehicle, 2021 - 2034 ($Bn)
- 7.1 Key trends
- 7.2 Passenger cars
- 7.2.1 Hatchback
- 7.2.2 Sedan
- 7.2.3 SUV
- 7.3 Commercial vehicles
- 7.3.1 Light Commercial Vehicles (LCV)
- 7.3.2 Medium Commercial Vehicles (MCV)
- 7.3.3 Heavy Commercial Vehicles (HCV)
- 7.4 Off-road vehicles
Chapter 8 Market Estimates & Forecast, By Application, 2021 - 2034 ($Bn)
- 8.1 Key trends
- 8.2 ADAS
- 8.3 Autonomous driving
- 8.4 In-vehicle navigation
- 8.5 Fleet and logistics management
- 8.6 Others
Chapter 9 Market Estimates & Forecast, By Sales Channel, 2021 - 2034 ($Bn)
- 9.1 Key trends
- 9.2 OEM
- 9.3 Aftermarket
Chapter 10 Market Estimates & Forecast, By Region, 2021 - 2034 ($Bn)
- 10.1 Key trends
- 10.2 North America
- 10.2.1 U.S.
- 10.2.2 Canada
- 10.3 Europe
- 10.3.1 UK
- 10.3.2 Germany
- 10.3.3 France
- 10.3.4 Italy
- 10.3.5 Spain
- 10.3.6 Russia
- 10.3.7 Nordics
- 10.4 Asia Pacific
- 10.4.1 China
- 10.4.2 India
- 10.4.3 Japan
- 10.4.4 South Korea
- 10.4.5 ANZ
- 10.4.6 Southeast Asia
- 10.5 Latin America
- 10.5.1 Brazil
- 10.5.2 Mexico
- 10.5.3 Argentina
- 10.6 MEA
- 10.6.1 UAE
- 10.6.2 Saudi Arabia
- 10.6.3 South Africa
Chapter 11 Company Profiles
- 11.1 3D Mapping
- 11.2 Carmera
- 11.3 Civil Maps
- 11.4 Deepmap
- 11.5 Dynamic Map Platform
- 11.6 Elektrobit
- 11.7 Garmin
- 11.8 Google
- 11.9 HERE Technologies
- 11.10 Inrix
- 11.11 MapBox
- 11.12 Microsoft
- 11.13 Mitsubishi
- 11.14 Mobileye
- 11.15 NavInfo
- 11.16 Nvidia
- 11.17 Telenav
- 11.18 TomTom
- 11.19 Trimble
- 11.20 Valeo