|
시장보고서
상품코드
1755345
수소 생성 시장 : 기회, 성장 촉진 요인, 산업 동향 분석, 예측(2025-2034년)Hydrogen Generation Market Opportunity, Growth Drivers, Industry Trend Analysis, and Forecast 2025 - 2034 |
||||||
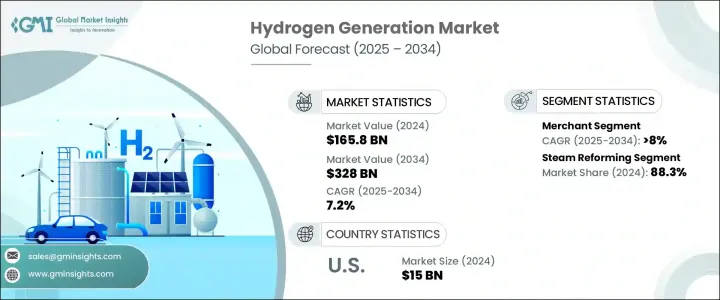
세계 수소 생성 시장 규모는 2024년 1,658억 달러로 평가되었고, 저탄소 산업용 연료 수요 증가와 기존 화석 유래 원료에서 보다 깨끗한 대체 원료로의 전환으로 CAGR 7.2%로 성장해 2034년에는 3,280억 달러에 이를 것으로 추정됩니다.
게다가 암모니아 제조, 정제, 합성 연료 제조와 같은 섹터의 탈탄소화를 위한 지속적인 대처가 저탄소 수소의 채택을 크게 밀어줍니다.

탄소 배출 감소를 목적으로 한 철강 생산, 화학 제조, 정제 등의 산업에 있어서의 수소의 응용의 고조도, 시장을 견인하는 중요한 역할을 완수할 것으로 보입니다. 개발자의 자본 지출을 증가시키고 프로젝트 일정을 늦출 수 있기 때문에 성장에 영향을 줄 수 있습니다.
| 시장 범위 | |
|---|---|
| 시작 연도 | 2024년 |
| 예측 기간 | 2025-2034년 |
| 초기 시장 규모 | 1,658억 달러 |
| 시장 규모 예측 | 3,280억 달러 |
| CAGR | 7.2% |
수소생성 시장의 수증기 개질 부문은 2024년에 88.3%의 점유율을 차지했습니다.
사내 소비 분야는 2034년까지 2,680억 달러에 이를 것으로 예상되며, 산업용/상업용 온사이트 수소 생성에 대한 투자 증가로 혜택을 받을 것으로 보입니다. 석유정제 및 화학산업에서는 자가소비용 그린수소기술의 이용이 확대되고 있어 시장확대를 한층 더 자극할 것으로 보입니다.
2024년 미국 수소 생산 시장 규모는 150억 달러로 발전과 수송 섹터 모두에서 수소의 역할이 늘어나고 있습니다. 수소는 중공업이나 화물 및 버스를 포함한 수송의 탈탄소화에 있어 점점 중요한 역할을 하게 되고 있습니다.
세계 수소 생성 시장의 주요 기업으로는 Linde, Air Products and Chemicals, Air Liquide, McPhy Energy, and Plug Power 등이 포함되어 있습니다. 시장에서의 지위를 강화하기 위해 다양한 전략을 채택하고 있습니다. 많은 기업은 재생 가능한 수소 솔루션을 통합하여 제품 제공을 확대하고 수소 인프라를 구축하기 위해 다른 업계 기업와 전략적 파트너십을 맺고 있습니다.
목차
제1장 분석 방법과 범위
제2장 주요 요약
제3장 업계 인사이트
- 업계 에코시스템
- 트럼프 정권의 관세 분석
- 무역에 미치는 영향
- 무역량의 혼란
- 보복 조치
- 업계에 미치는 영향
- 공급측의 영향(원재료)
- 주요 원재료의 가격 변동
- 공급망 재구성
- 생산 비용에 미치는 영향
- 수요측의 영향(판매가격)
- 최종 시장에의 가격 전달
- 시장 점유율 동향
- 소비자의 반응 패턴
- 공급측의 영향(원재료)
- 영향을 받는 주요 기업
- 전략적인 업계 대응
- 공급망 재구성
- 가격 설정 및 제품 전략
- 정책관여
- 전망과 향후 검토 사항
- 무역에 미치는 영향
- 규제 상황
- 업계에 미치는 영향요인
- 성장 촉진요인
- 업계의 잠재적 위험과 과제
- 성장 가능성 분석
- Porter's Five Forces 분석
- PESTEL 분석
제4장 경쟁 구도
- 소개
- 기업의 시장 점유율
- 전략적 노력
- 경쟁 벤치마킹
- 전략적 대시보드
- 혁신과 지속가능성의 정세
제5장 시장의 추정 및 예측 : 제공 모드별(2021-2034년)
- 주요 동향
- 사내 소비
- 외부 판매
제6장 시장의 추정 및 예측 : 용도별(2021-2034년)
- 주요 동향
- 석유 정제
- 화학
- 금속
- 기타
제7장 시장의 추정 및 예측 : 공정별(2021-2034년)
- 주요 동향
- 수증기 개질
- 전기분해
- 기타
제8장 시장의 추정 및 예측 : 지역별(2021-2034년)
- 주요 동향
- 북미
- 미국
- 캐나다
- 멕시코
- 유럽
- 독일
- 프랑스
- 영국
- 이탈리아
- 네덜란드
- 러시아
- 아시아태평양
- 중국
- 인도
- 일본
- 중동 및 아프리카
- 사우디아라비아
- 이란
- 아랍에미리트(UAE)
- 남아프리카
- 라틴아메리카
- 브라질
- 아르헨티나
- 칠레
제9장 기업 프로파일
- Air Liquide
- Air Products and Chemicals
- Ballard Power Systems
- Ally Hi-Tech
- Claind
- Engie
- Caloric
- HyGear
- Iwatani Corporation
- Linde
- Mahler
- Messer
- McPhy Energy
- Nel ASA
- Nuvera Fuel Cells
- Plug Power
- Resonac Holdings Corporation
- Taiyo Nippon Sanso Corporation
- Teledyne Technologies Incorporated
- Xebec Adsorption
The Global Hydrogen Generation Market was valued at USD 165.8 billion in 2024 and is estimated to grow at a CAGR of 7.2% to reach USD 328 billion by 2034, driven by the increasing demand for low-carbon industrial fuels and a shift from traditional fossil-based feedstocks to cleaner alternatives. Additionally, the ongoing focus on decarbonizing sectors like ammonia production, refining, and synthetic fuel manufacturing will significantly boost the adoption of low-carbon hydrogen. The growing popularity of hydrogen fuel cell vehicles (FCVs), including buses, trucks, and ships, alongside the expansion of hydrogen refueling stations, will further stimulate market growth.
The rising application of hydrogen in industries such as steel production, chemical manufacturing, and refining, aimed at reducing carbon emissions, will also play a crucial role in driving the market. Financial incentives, grants, and subsidies for developing hydrogen infrastructure and technologies enhance the market outlook. However, tariffs imposed on imported hydrogen production equipment and components may affect growth, raising capital expenditures for developers and potentially delaying project timelines. The hydrogen generation market is divided into segments such as steam reforming, electrolysis, and others, with steam reforming holding the largest share due to its cost-effectiveness and established infrastructure.
| Market Scope | |
|---|---|
| Start Year | 2024 |
| Forecast Year | 2025-2034 |
| Start Value | $165.8 Billion |
| Forecast Value | $328 Billion |
| CAGR | 7.2% |
The steam reforming segment in the hydrogen generation market held 88.3% share in 2024. This is largely due to its cost-effective production capabilities and the well-established infrastructure that supports its widespread use. Steam reforming has long been the preferred method for hydrogen production, especially within industries like refining and petrochemicals, where it plays a crucial role in generating the hydrogen needed for various processes.
The captive segment is expected to reach USD 268 billion by 2034 and will benefit from increasing investments in on-site hydrogen generation for industrial and commercial use. This shift is aimed at mitigating supply chain risks and improving energy security. The growing use of green hydrogen technologies for in-house consumption, particularly in the refining and chemical industries, will further stimulate market expansion. Additionally, policy incentives encouraging the integration of clean energy will support the ongoing adoption of hydrogen across various sectors.
United States Hydrogen Generation Market was valued at USD 15 billion in 2024, driven by the increasing role of hydrogen in both power generation and the transportation sector. The demand for hydrogen-based solutions is driven by the desire to improve grid flexibility, reduce dependence on fossil fuels, and support the transition to clean energy. Hydrogen is increasingly a key player in decarbonizing heavy industries and transportation, including freight and buses. Public and private sector initiatives to decarbonize the economy are further propelling the adoption of hydrogen technologies, which is expected to lead to significant market growth in the years ahead.
Key players in the Global Hydrogen Generation Market include Linde, Air Products and Chemicals, Air Liquide, McPhy Energy, and Plug Power, among others. These companies are employing various strategies to strengthen their market position, including investments in research and development to enhance the efficiency and sustainability of hydrogen production technologies. Many companies are expanding their product offerings by integrating renewable hydrogen solutions and forming strategic partnerships with other industry players to build hydrogen infrastructure.
Table of Contents
Chapter 1 Methodology & Scope
- 1.1 Research design
- 1.2 Base estimates & calculations
- 1.3 Forecast calculation
- 1.4 Primary research & validation
- 1.4.1 Primary sources
- 1.4.2 Data mining sources
- 1.5 Market definitions
Chapter 2 Executive Summary
- 2.1 Industry synopsis, 2021 – 2034
Chapter 3 Industry Insights
- 3.1 Industry ecosystem
- 3.2 Trump administration tariff analysis
- 3.2.1 Impact on trade
- 3.2.1.1 Trade volume disruptions
- 3.2.1.2 Retaliatory measures
- 3.2.2 Impact on the industry
- 3.2.2.1 Supply-side impact (raw materials)
- 3.2.2.1.1 Price volatility in key materials
- 3.2.2.1.2 Supply chain restructuring
- 3.2.2.1.3 Production cost implications
- 3.2.2.2 Demand-side impact (selling price)
- 3.2.2.2.1 Price transmission to end markets
- 3.2.2.2.2 Market share dynamics
- 3.2.2.2.3 Consumer response patterns
- 3.2.2.1 Supply-side impact (raw materials)
- 3.2.3 Key companies impacted
- 3.2.4 Strategic industry responses
- 3.2.4.1 Supply chain reconfiguration
- 3.2.4.2 Pricing and product strategies
- 3.2.4.3 Policy engagement
- 3.2.5 Outlook and future considerations
- 3.2.1 Impact on trade
- 3.3 Regulatory landscape
- 3.4 Industry impact forces
- 3.4.1 Growth drivers
- 3.4.2 Industry pitfalls & challenges
- 3.5 Growth potential analysis
- 3.6 Porter's analysis
- 3.6.1 Bargaining power of suppliers
- 3.6.2 Bargaining power of buyers
- 3.6.3 Threat of new entrants
- 3.6.4 Threat of substitutes
- 3.7 PESTEL analysis
Chapter 4 Competitive landscape, 2024
- 4.1 Introduction
- 4.2 Company market share
- 4.3 Strategic initiative
- 4.4 Competitive benchmarking
- 4.5 Strategic dashboard
- 4.6 Innovation & sustainability landscape
Chapter 5 Market Size and Forecast, By Delivery Mode, 2021 - 2034 (USD Billion)
- 5.1 Key trends
- 5.2 Captive
- 5.3 Merchant
Chapter 6 Market Size and Forecast, By Application, 2021 - 2034 (USD Billion)
- 6.1 Key trends
- 6.2 Petroleum refinery
- 6.3 Chemical
- 6.4 Metal
- 6.5 Others
Chapter 7 Market Size and Forecast, By Process, 2021 - 2034 (USD Billion)
- 7.1 Key trends
- 7.2 Steam reformer
- 7.3 Electrolysis
- 7.4 Others
Chapter 8 Market Size and Forecast, By Region, 2021 - 2034 (USD Billion)
- 8.1 Key trends
- 8.2 North America
- 8.2.1 U.S.
- 8.2.2 Canada
- 8.2.3 Mexico
- 8.3 Europe
- 8.3.1 Germany
- 8.3.2 France
- 8.3.3 UK
- 8.3.4 Italy
- 8.3.5 Netherlands
- 8.3.6 Russia
- 8.4 Asia Pacific
- 8.4.1 China
- 8.4.2 India
- 8.4.3 Japan
- 8.5 Middle East & Africa
- 8.5.1 Saudi Arabia
- 8.5.2 Iran
- 8.5.3 UAE
- 8.5.4 South Africa
- 8.6 Latin America
- 8.6.1 Brazil
- 8.6.2 Argentina
- 8.6.3 Chile
Chapter 9 Company Profiles
- 9.1 Air Liquide
- 9.2 Air Products and Chemicals
- 9.3 Ballard Power Systems
- 9.4 Ally Hi-Tech
- 9.5 Claind
- 9.6 Engie
- 9.7 Caloric
- 9.8 HyGear
- 9.9 Iwatani Corporation
- 9.10 Linde
- 9.11 Mahler
- 9.12 Messer
- 9.13 McPhy Energy
- 9.14 Nel ASA
- 9.15 Nuvera Fuel Cells
- 9.16 Plug Power
- 9.17 Resonac Holdings Corporation
- 9.18 Taiyo Nippon Sanso Corporation
- 9.19 Teledyne Technologies Incorporated
- 9.20 Xebec Adsorption