
|
시장보고서
상품코드
1766264
배전 변전소 감시 시스템 시장 : 기회, 성장 촉진요인, 산업 동향 분석, 예측(2025-2034년)Distribution Substation Monitoring System Market Opportunity, Growth Drivers, Industry Trend Analysis, and Forecast 2025 - 2034 |
||||||
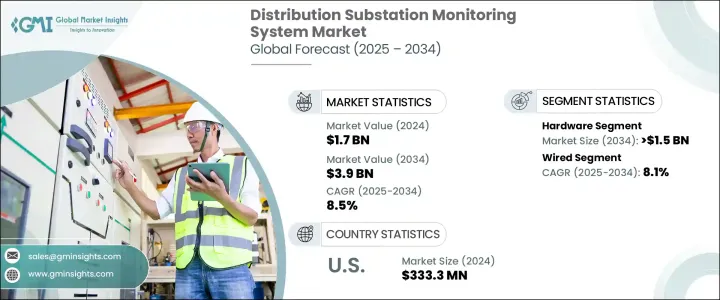
세계의 배전 변전소 감시 시스템 시장 규모는 2024년 17억 달러에 달했고, CAGR 8.5%로 성장해 2034년까지 39억 달러에 이를 것으로 예측되고 있습니다.
이 시장은 특히 도시와 산업지역에서의 효율적인 배전에 대한 수요가 높아짐에 따라 전력소비량이 증가함에 따라 전력회사는 다운타임을 최소화하고 시스템 성능을 최적화할 필요가 있습니다. 스마트 그리드 시스템으로의 전환과 변전소의 자동화가 진행되고 있는 것이, 시장의 성장을 가속하는 주된 요인이 되고 있습니다.
게다가 풍력발전이나 태양광발전 등의 재생가능에너지의 도입이 증가하고 있는 것도 배전변전소 감시시스템 수요를 계속 밀어 올리고 있습니다. 풍력발전이나 태양광발전은 기상조건에 따라 변동될 가능성이 있으므로 이러한 변동을 효과적으로 관리하기 위해서는 실시간 모니터링이 필요합니다.
| 시장 범위 | |
|---|---|
| 시작 연도 | 2024년 |
| 예측 연도 | 2025-2034년 |
| 시작 금액 | 17억 달러 |
| 예측 금액 | 39억 달러 |
| CAGR | 8.5% |
2024년 소프트웨어 분야의 점유율은 32.2%이었습니다. 성장의 배경은 고급 분석, 실시간 데이터 시각화, 집중 제어에 대한 수요 증가가 있습니다. 그리드 성능 향상, 다운타임 절감, 의사결정 최적화를 가능하게 하는 실용적인 통찰력으로 변환하는 데 필수적입니다.
시장의 대부분을 차지하는 유선 부문은 2034년까지 연평균 복합 성장률(CAGR) 8.1%를 보일 것으로 예측됩니다. 광섬유 및 이더넷 기반 네트워크와 같은 유선 시스템은 안정적이고 안전하며 간섭이 없는 데이터 전송을 제공합니다. 유선 솔루션은 신호 간섭 및 사이버 보안 문제가 발생하기 쉬운 무선 기술에 비해 성능의 일관성과 데이터 보호가 뛰어납니다.
미국의 배전 변전소 감시 시스템 2024년 시장 규모는 3억 3,330만 달러로, 재생에너지로의 시프트가 현저합니다. 지속 가능한 에너지 솔루션에 대한 국가의 헌신을 반영합니다. 이 동향은 정부의 자금 지원, 기술 혁신의 가속화, 친환경적인 배전 시스템에 대한 필요성 증가로 더욱 강화되고 있습니다.
세계의 배전 변전소 감시 시스템 시장의 주요 기업으로는 ABB Ltd., Cadillac Automation and Controls, Cisco, Eaton Corporation, Emerson Electric, GE Vernova, Honeywell, iGRID t&, Novatech, Schneider Electric, Schweitzer Engineering Laboratories, Inc., Sentient Energy, Sentient Energy Inc. 등이 포함됩니다. 시장 포지션을 강화하기 위해 배전 변전소 모니터링 시스템 부문의 기업은 지속적인 기술 발전에 주력하고 있습니다.
자동화 및 스마트 그리드 시스템과의 통합에 투자하고, 보다 효율적인 실시간 모니터링 솔루션을 제공합니다.
목차
제1장 조사 방법과 범위
제2장 주요 요약
제3장 업계 인사이트
- 생태계 분석
- 규제 상황
- 업계에 미치는 영향요인
- 성장 촉진요인
- 업계의 잠재적 위험 및 과제
- 성장 가능성 분석
- Porter's Five Forces 분석
- PESTEL 분석
제4장 경쟁 구도
- 전략적 대시보드
- 혁신과 지속가능성의 정세
제5장 시장 규모와 예측 : 컴포넌트별, 2021-2034년
- 주요 동향
- 하드웨어
- 소프트웨어
- 서비스
제6장 시장 규모와 예측 : 기술별, 2021-2034년
- 주요 동향
- 유선
- 무선
제7장 시장 규모와 예측 : 용도별, 2021-2034년
- 주요 동향
- 산업용
- 상업용
- 유틸리티
제8장 시장 규모와 예측 : 전개별, 2021-2034년
- 주요 동향
- On-Premise
- 클라우드 기반
제9장 시장 규모와 예측 : 지역별, 2021-2034년
- 주요 동향
- 북미
- 미국
- 캐나다
- 멕시코
- 유럽
- 영국
- 프랑스
- 독일
- 이탈리아
- 러시아
- 스페인
- 아시아태평양
- 중국
- 호주
- 인도
- 일본
- 한국
- 중동 및 아프리카
- 사우디아라비아
- 아랍에미리트(UAE)
- 튀르키예
- 남아프리카
- 이집트
- 라틴아메리카
- 브라질
- 아르헨티나
제10장 기업 프로파일
- ABB Ltd.
- Cadillac Automation and Controls
- Cisco
- Eaton Corporation
- Emerson Electric
- GE Vernova
- Honeywell
- iGRID t&D
- Novatech
- Schneider Electric
- Schweitzer Engineering Laboratories, Inc.
- Sentient Energy
- Siemens
- Tekvel
- Trilliant Holdings Inc.
The Global Distribution Substation Monitoring System Market was valued at USD 1.7 billion in 2024 and is estimated to grow at a CAGR of 8.5% to reach USD 3.9 billion by 2034. The market is expanding due to the increasing demand for efficient power distribution, especially in urban and industrial areas. As electricity consumption grows, utility companies are under pressure to minimize downtime and optimize system performance. Distribution substation monitoring systems play a critical role by providing real-time data and helping operators make informed decisions. The shift toward smart grid systems and the ongoing automation of substations are major factors driving market growth. Automation facilitates remote control of key components, reducing the need for manual inspections and enhancing both maintenance efficiency and cost-effectiveness.

Additionally, the increasing adoption of renewable energy sources such as wind and solar power continues to drive the demand for distribution substation monitoring systems. As power grids evolve to accommodate these intermittent energy sources, there is a growing need for advanced monitoring systems that ensure stable grid performance. Unlike traditional energy sources, wind and solar power can experience fluctuations based on weather conditions, which requires real-time monitoring to manage these variations effectively. The integration of renewable energy sources often involves complex grid management strategies, and monitoring systems help in optimizing the distribution of power, minimizing losses, and enhancing grid reliability.
| Market Scope | |
|---|---|
| Start Year | 2024 |
| Forecast Year | 2025-2034 |
| Start Value | $1.7 Billion |
| Forecast Value | $3.9 Billion |
| CAGR | 8.5% |
In 2024, the software segment held 32.2% share. This growth is attributed to the increasing demand for advanced analytics, real-time data visualization, and centralized control. These software platforms are essential for transforming raw data from substations into actionable insights that can enhance grid performance, reduce downtime, and optimize decision-making. As utilities focus on improving system efficiency, software tools have become indispensable.
The wired segment, accounting for a significant portion of the market, is projected to grow at a CAGR of 8.1% through 2034. Wired systems like fiber optics and Ethernet-based networks offer reliable, secure, and interference-free data transmission. These systems are particularly preferred in critical substation environments, where real-time monitoring and high data integrity are crucial. Wired solutions provide better performance consistency and data protection compared to wireless technologies, which can be more prone to signal interference and cybersecurity issues. This makes wired technologies a top choice for utilities operating in areas with high-voltage equipment or dense urban populations.
U.S. Distribution Substation Monitoring System Market was valued at USD 333.3 million in 2024, with a significant shift towards renewable energy. Investments in solar and wind energy far outpace those in fossil fuels, reflecting the country's commitment to sustainable energy solutions. This trend is further supported by government funding, innovation acceleration, and a growing need for eco-friendly power distribution systems.
Key players in the Global Distribution Substation Monitoring System Market include ABB Ltd., Cadillac Automation and Controls, Cisco, Eaton Corporation, Emerson Electric, GE Vernova, Honeywell, iGRID t&D, Novatech, Schneider Electric, Schweitzer Engineering Laboratories, Inc., Sentient Energy, Siemens, Tekvel, and Trilliant Holdings Inc. To strengthen their market position, companies in the distribution substation monitoring system sector are focusing on continuous technological advancements.
They are investing in automation and integration with smart grid systems to offer more efficient, real-time monitoring solutions. Additionally, companies are forming strategic partnerships and expanding their product portfolios to cater to the growing demand for renewable energy integration. Many players are also focusing on enhancing the security and reliability of their wired solutions to attract clients in high-risk substation environments.
Table of Contents
Chapter 1 Methodology & Scope
- 1.1 Market definitions
- 1.2 Base estimates & calculations
- 1.3 Forecast calculation
- 1.4 Data sources
- 1.4.1 Primary
- 1.4.2 Secondary
- 1.4.2.1 Paid
- 1.4.2.2 Public
Chapter 2 Executive Summary
- 2.1 Industry synopsis, 2021 – 2034
Chapter 3 Industry Insights
- 3.1 Industry ecosystem analysis
- 3.2 Regulatory landscape
- 3.3 Industry impact forces
- 3.3.1 Growth drivers
- 3.3.2 Industry pitfalls & challenges
- 3.4 Growth potential analysis
- 3.5 Porter's analysis
- 3.5.1 Bargaining power of suppliers
- 3.5.2 Bargaining power of buyers
- 3.5.3 Threat of new entrants
- 3.5.4 Threat of substitutes
- 3.6 PESTEL analysis
Chapter 4 Competitive landscape, 2024
- 4.1 Strategic dashboard
- 4.2 Innovation & sustainability landscape
Chapter 5 Market Size and Forecast, By Component, 2021 - 2034 (USD Million)
- 5.1 Key trends
- 5.2 Hardware
- 5.3 Software
- 5.4 Services
Chapter 6 Market Size and Forecast, By Technology, 2021 - 2034 (USD Million)
- 6.1 Key trends
- 6.2 Wired
- 6.3 Wireless
Chapter 7 Market Size and Forecast, By Application, 2021 - 2034 (USD Million)
- 7.1 Key trends
- 7.2 Industrial
- 7.3 Commercial
- 7.4 Utility
Chapter 8 Market Size and Forecast, By Deployment, 2021 - 2034 (USD Million)
- 8.1 Key trends
- 8.2 On premises
- 8.3 Cloud based
Chapter 9 Market Size and Forecast, By Region, 2021 - 2034 (USD Million)
- 9.1 Key trends
- 9.2 North America
- 9.2.1 U.S.
- 9.2.2 Canada
- 9.2.3 Mexico
- 9.3 Europe
- 9.3.1 UK
- 9.3.2 France
- 9.3.3 Germany
- 9.3.4 Italy
- 9.3.5 Russia
- 9.3.6 Spain
- 9.4 Asia Pacific
- 9.4.1 China
- 9.4.2 Australia
- 9.4.3 India
- 9.4.4 Japan
- 9.4.5 South Korea
- 9.5 Middle East & Africa
- 9.5.1 Saudi Arabia
- 9.5.2 UAE
- 9.5.3 Turkey
- 9.5.4 South Africa
- 9.5.5 Egypt
- 9.6 Latin America
- 9.6.1 Brazil
- 9.6.2 Argentina
Chapter 10 Company Profiles
- 10.1 ABB Ltd.
- 10.2 Cadillac Automation and Controls
- 10.3 Cisco
- 10.4 Eaton Corporation
- 10.5 Emerson Electric
- 10.6 GE Vernova
- 10.7 Honeywell
- 10.8 iGRID t&D
- 10.9 Novatech
- 10.10 Schneider Electric
- 10.11 Schweitzer Engineering Laboratories, Inc.
- 10.12 Sentient Energy
- 10.13 Siemens
- 10.14 Tekvel
- 10.15 Trilliant Holdings Inc.

