|
시장보고서
상품코드
1892892
자율주행차 시장 기회, 성장 촉진요인, 업계 동향 분석 및 예측(2026-2035년)Autonomous Vehicle Market Opportunity, Growth Drivers, Industry Trend Analysis, and Forecast 2026 - 2035 |
||||||
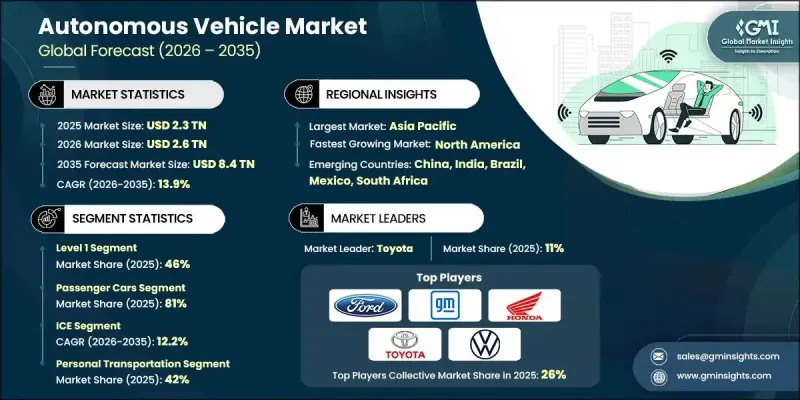
세계의 자율주행차 시장은 2025년 2조 3,000억 달러로 평가되었으며, 2035년까지 연평균 복합 성장률(CAGR) 13.9%를 나타내 8조 4,000억 달러에 이를 것으로 예측됩니다.

이 시장은 자율주행시스템의 개발, 검증, 개선에 있어서 기본적인 기둥이 되고 있습니다. 이러한 시뮬레이션 기술은 제어 가능하고 재현성이 뛰어나고 확장성이 뛰어난 가상 환경을 구축하고 개발자가 차량이 다양한 복잡한 운전 시나리오에 어떻게 반응하는지 분석할 수 있도록 합니다. 자동차 제조업체, 기술 공급업체 및 연구 기관은 엄격한 성능, 안전성 및 규제 요구 사항을 충족하기 위해 자율주행 차량 개발의 전체 수명주기를 통해 시뮬레이션에 대한 의존도를 높이고 있습니다. 인공지능, 머신러닝 및 컴퓨팅 인프라의 지속적인 발전은 이러한 플랫폼의 깊이와 정확성을 향상시키고 있습니다. 오늘날의 시뮬레이션 환경은 상세한 환경 모델링부터 클라우드 지원 시뮬레이션, 완벽한 엔드 투 엔드 테스트 워크플로우를 지원하는 확장된 개발 파이프라인에 이르기까지 다양합니다. 반자율 시스템이 성숙함에 따라 시뮬레이션 툴은 보다 풍부하고 다층적인 가상 평가를 필요로 하는 인간과 기계의 상호작용 연구, 운전자의 반응 예측, 공유 의사결정 평가에 중요한 역할을 합니다.
| 시장 범위 | |
|---|---|
| 시작 연도 | 2025년 |
| 예측 연도 | 2026-2035년 |
| 시작 가치 | 2조 3,000억 달러 |
| 예측 금액 | 8조 4,000억 달러 |
| CAGR | 13.9% |
레벨 1 부문은 2025년에 46%의 점유율을 차지했고 2026년부터 2035년에 걸쳐 CAGR 13%를 나타낼 것으로 예측됩니다. 이 부문의 견조한 성과는 규제 측면에서의 지원과 대중 시장을 위한 차량에서의 광범위한 채용에 의해 지원됩니다. 레벨 1 시스템은 적응형 크루즈 제어 및 차선 유지 지원과 같은 단일 기능의 운전 지원을 제공하지만 운전자에게는 완전한 주의력을 유지해야 합니다. 차량 안전에 대한 규제 강화와 사고 위험 감소를 보여주는 보험 데이터가 결합되어 상당한 성장 기회가 창출될 것으로 예측됩니다. 레벨 1 시장은 2035년까지 3조 6,900억 달러에 달할 것으로 예상됩니다.
승용차 부문은 2025년에 81%의 점유율을 차지했으며, 2035년까지 연평균 복합 성장률(CAGR) 12.6%를 나타낼 것으로 전망됩니다. 그 우수성은 ADAS(첨단 운전자 보조 시스템)의 레벨 1 및 레벨 2가 널리 통합되어 있기 때문에 선진지역에서는 신차의 70% 이상에 표준 장비되어 있습니다. 정부의 규제, 안전성 향상, 고급차에서 중급차에 이르기까지의 보급 확대가 더해져 운전지원기술의 소비자 수용이 가속화되어 세계적으로 주류의 기능이 되고 있습니다.
미국의 자율주행차 시장은 2025년 4,102억 달러에 달했습니다. 이 지역의 기업들은 인공지능과 머신러닝을 활용하여 차량의 안전성 향상, 교통 예측의 정확성 향상, 복잡한 도시 및 고속도로 환경에서 보다 현명한 의사결정을 실현하기 위해 노력하고 있습니다. 선도적인 기술 기업과 혁신적인 신생 기업 모두 라이드 쉐어링 및 배송 서비스 등의 용도를 위한 자율주행 차량 개발을 진행하고 있으며, 도시 이동성을 위한 비용 효율적이고 확장 가능한 솔루션을 제공하여 운송 업무를 변화시키고 있습니다.
자주 묻는 질문
목차
제1장 조사 방법
제2장 주요 요약
제3장 업계 인사이트
- 생태계 분석
- 공급업체 현황
- 이익률
- 비용 구조
- 각 단계별 부가가치
- 밸류체인에 영향을 주는 요인
- 파괴적 혁신
- 업계에 미치는 영향요인
- 성장 촉진요인
- 도로 안전에 대한 수요 증가
- AI 및 센서 기술의 진보
- 정부규제와 인센티브
- 확대하는 라이드 쉐어링 및 모빌리티 서비스
- 업계의 잠재적 위험 및 과제
- 규제 및 법적 불확실성
- 높은 R&D 비용 및 도입 비용
- 시장 기회
- 도시 모빌리티 솔루션 확대
- 기술계 스타트업 기업 및 OEM 제조업체와의 제휴
- 자율 주행 차량군으로부터의 데이터 수익화
- 스마트 시티 인프라와의 통합
- 성장 촉진요인
- 성장 가능성 분석
- 규제 상황
- 세계
- UNECE WP.29 체계 및 작업반
- UN 규정 155
- UN 규정 156
- UN 규정 157
- 북미
- 미국 연방 정부의 틀
- 미국 도로교통안전국(NHTSA) 자동운전차정책 및 가이던스
- 유럽
- EU 형식 인증 규제 2019/2144
- 차량 일반 안전 규제(GSR)
- 아시아태평양
- 중국 공업 정보화부(MIIT) 및 국가 발전 개혁 위원회(NDRC)에 의한 국가 전략
- 중국의 지능형 커넥티드카 기준
- 라틴아메리카
- 중동 및 아프리카
- 세계
- Porter's Five Forces 분석
- PESTEL 분석
- 기술 및 혁신 현황
- 현재 기술 동향
- LiDAR 기술(기계식, 고체식, FMCW 방식)
- 레이더 기술(77-79GHz 대역, 4D 이미징 그레이더)
- V2X 통신 프로토콜
- 5G 네트워크 통합
- 신흥 기술
- 주파수 변조 연속파(FMCW) LiDAR
- 고도 검출 기능이있는 4D Imagen Grader
- 열화상 카메라 및 적외선 카메라
- 하드웨어 보안 모듈(HSM)
- 현재 기술 동향
- 가격 분석
- 부품 가격 동향
- 차량 추가 비용 분석
- 서비스 가격 설정 모델
- 생산 통계
- 생산 거점
- 소비 거점
- 수출과 수입
- 코스트 내역 분석
- 자동 운전 차량 시스템의 비용 구조
- 제조·생산 비용
- 운영 비용 분석
- R&D 투자요건
- 밸류체인의 이익률 분석
- 특허 분석
- 세계 특허 출원 동향
- 기술 분야별 특허 분포
- 주요 특허 보유 기업 및 혁신 리더
- 지적재산 활동의 지리적 분포
- 지속가능성과 환경면
- 지속가능한 실천
- 폐기물 감축 전략
- 생산에 있어서 에너지 효율
- 환경에 배려한 대처
- 탄소발자국에 관한 고려 사항
- 투자·자금 조달 분석
- 벤처캐피탈 및 프라이빗 주식 투자 동향
- 기업투자와 전략적 인수
- M&A 활동과 평가 배율
- 국가별 정부 자금·연구개발 프로그램
- 최종 사용자 행동 및 도입 분석
- 소비자용 승용차 부문
- 상용 차량 운영사의 행동
- 라이드 헤일링 및 MaaS(이동의 이동성) 유저 행동
- 배송 서비스에 있어서 최종 용도 행동
- 산업용·비도로용 최종 용도 행동
- 리스크 평가 및 경감 프레임워크
- 기술 위험
- 사이버 보안 위험
- 안전·책임 위험
- 규제·정책 리스크
- 공급 체인 위험
제4장 경쟁 구도
- 서론
- 기업의 시장 점유율 분석
- 북미
- 유럽
- 아시아태평양
- 라틴아메리카
- 중동 및 아프리카
- 주요 시장 기업의 경쟁 분석
- 경쟁 포지셔닝 매트릭스
- 전략적 전망 매트릭스
- 주요 발전
- 인수합병
- 파트너십 및 협력
- 신제품 출시
- 사업 확대 계획과 자금 조달
제5장 시장 추계·예측 : 자율성 레벨별(2022-2035년)
- 레벨 1
- 레벨 2
- 레벨 3
- 레벨 4
- 레벨 5
제6장 시장 추계·예측 : 차량별(2022-2035년)
- 승용차
- SUV
- 세단
- 해치백
- 상용차
- 소형 상용차(LCV)
- 중형 상용차(MCV)
- 대형 상용차(HCV)
제7장 시장 추계·예측 : 연료별(2022-2035년)
- 내연기관(ICE)
- 전기자동차
- 하이브리드
제8장 시장 추계·예측 : 용도별(2022-2035년)
- 개인 교통수단
- 대중교통
- 화물 운송
- 산업용 적용
- 기타
제9장 시장 추계·예측 : 센서별(2022-2035년)
- LiDAR
- 레이더
- 카메라
- 초음파 센서
- GPS/IMU 시스템
제10장 시장 추계·예측 : 지역별(2022-2035년)
- 북미
- 미국
- 캐나다
- 유럽
- 독일
- 영국
- 프랑스
- 이탈리아
- 스페인
- 북유럽 국가
- 러시아
- 폴란드
- 루마니아
- 아시아태평양
- 중국
- 인도
- 일본
- 한국
- ANZ
- 베트남
- 인도네시아
- 라틴아메리카
- 브라질
- 멕시코
- 아르헨티나
- 중동 및 아프리카
- 남아프리카
- 사우디아라비아
- 아랍에미리트(UAE)
제11장 기업 프로파일
- 세계 기업
- Toyota
- Volkswagen
- General Motors
- Tesla
- BMW
- Mercedes-Benz
- Ford
- Nissan
- Honda
- Hyundai
- Waymo(Alphabet)
- 지역별 톱 기업
- Aurora Innovation
- AutoX
- Einride
- Motional (Hyundai-Aptiv JV)
- Oxbotica
- Plus(Formerly Plus.ai)
- Pony.ai
- Wayve Technologies
- WeRide
- Zoox
- 신흥 기업
- Beep
- EasyMile SAS
- Gatik
- Ghost Autonomy
- Helm.ai
- Kodiak Robotics
- May Mobility
- Navya
- Nuro
The Global Autonomous Vehicle Market was valued at USD 2.3 trillion in 2025 and is estimated to grow at a CAGR of 13.9% to reach USD 8.4 trillion by 2035.
This market is becoming a fundamental pillar in developing, validating, and refining autonomous driving systems. These simulation technologies create controlled, repeatable, and highly scalable virtual settings that allow developers to analyze how vehicles react to a wide range of complex driving scenarios. Automakers, technology providers, and research organizations increasingly depend on simulation throughout the entire lifecycle of autonomous vehicle development as they work to meet strict performance, safety, and regulatory requirements. Continuous progress in artificial intelligence, machine learning, and computing infrastructure is also improving the depth and accuracy of these platforms. Today's simulation environments span from detailed environment modeling to cloud-enabled simulations and expanded development pipelines that support full end-to-end testing workflows. As semi-autonomous systems mature, simulation tools play a crucial role in studying human-machine interaction, forecasting driver reactions, and evaluating shared decision-making, which requires richer, layered virtual assessments.
| Market Scope | |
|---|---|
| Start Year | 2025 |
| Forecast Year | 2026-2035 |
| Start Value | $2.3 Trillion |
| Forecast Value | $8.4 Trillion |
| CAGR | 13.9% |
The Level 1 segment held a 46% share in 2025 and is projected to grow at a CAGR of 13% between 2026 and 2035. This segment's strong performance is driven by regulatory support and its widespread adoption in mass-market vehicles. Level 1 systems offer single-function driver assistance, such as adaptive cruise control and lane-keeping support, while requiring the driver to remain fully attentive. Increasing regulatory focus on vehicle safety, along with insurance data highlighting reduced accident risks, is expected to create significant growth opportunities, with the Level 1 market projected to reach USD 3.69 trillion by 2035.
The passenger car segment accounted for an 81% share in 2025 and is expected to grow at a CAGR of 12.6% through 2035. Its dominance is due to the widespread integration of Level 1 and Level 2 advanced driver-assistance systems (ADAS), which are now standard in over 70% of new vehicles in developed regions. Government mandates, enhanced safety benefits, and increasing availability of these technologies across premium and mid-range vehicles are accelerating consumer acceptance of assisted driving, making it a mainstream feature globally.
U.S. Autonomous Vehicle Market reached USD 410.2 billion in 2025. Companies in the region are leveraging artificial intelligence and machine learning to enhance vehicle safety, improve traffic prediction, and enable smarter decision-making in complex urban and highway environments. Both major tech firms and innovative startups are exploring autonomous vehicles for applications such as ride-hailing and delivery services, offering cost-efficient, scalable solutions for urban mobility and transforming transportation operations.
Key companies active in the Global Autonomous Vehicle Market include aiMotive, Altair, Ansys, Dassault, Foretellix, Hexagon AB, IPG Automotive, LG, Mechanical Simulation, and Siemens. Companies in this market are reinforcing their competitive edge by enhancing simulation realism, building higher-fidelity digital twins, and integrating AI-driven analytics that improve scenario generation and automated validation. Many are expanding cloud-based platforms to support scalable testing for global teams, while still offering secure on-premises systems for customers with strict data governance needs. Vendors are also forming partnerships with OEMs, Tier 1 suppliers, and sensor manufacturers to create unified testing ecosystems that replicate full-vehicle behavior. Continuous updates that incorporate new driving regulations, road environments, and edge-case libraries help strengthen long-term customer reliance on their platforms.
Table of Contents
Chapter 1 Methodology
- 1.1 Market scope and definition
- 1.2 Research design
- 1.2.1 Research approach
- 1.2.2 Data collection methods
- 1.3 Data mining sources
- 1.3.1 Global
- 1.3.2 Regional/Country
- 1.4 Base estimates and calculations
- 1.4.1 Base year calculation
- 1.4.2 Key trends for market estimation
- 1.5 Primary research and validation
- 1.5.1 Primary sources
- 1.6 Forecast model
- 1.7 Research assumptions and limitations
Chapter 2 Executive Summary
- 2.1 Industry 3600 synopsis
- 2.2 Key market trends
- 2.2.1 Regional
- 2.2.2 Level of autonomy
- 2.2.3 Vehicle
- 2.2.4 Fuel
- 2.2.5 Application
- 2.2.6 Sensor
- 2.3 TAM analysis, 2026-2035
- 2.4 CXO perspectives: Strategic imperatives
- 2.4.1 Executive decision points
- 2.4.2 Critical success factors
- 2.5 Future outlook
- 2.6 Strategic recommendations
Chapter 3 Industry Insights
- 3.1 Industry ecosystem analysis
- 3.1.1 Supplier landscape
- 3.1.2 Profit margin
- 3.1.3 Cost structure
- 3.1.4 Value addition at each stage
- 3.1.5 Factor affecting the value chain
- 3.1.6 Disruptions
- 3.2 Industry impact forces
- 3.2.1 Growth drivers
- 3.2.1.1 Increasing demand for road safety
- 3.2.1.2 Advances in AI and sensor technologies
- 3.2.1.3 Government regulations and incentives
- 3.2.1.4 Growing ridesharing and mobility services
- 3.2.2 Industry pitfalls and challenges
- 3.2.2.1 Regulatory and legal uncertainties
- 3.2.2.2 High R&D and deployment costs
- 3.2.3 Market opportunities
- 3.2.3.1 Expansion in urban mobility solutions
- 3.2.3.2 Collaboration with tech startups and OEMs
- 3.2.3.3 Data monetization from autonomous fleets
- 3.2.3.4 Integration with smart city infrastructure
- 3.2.1 Growth drivers
- 3.3 Growth potential analysis
- 3.4 Regulatory landscape
- 3.4.1 Global
- 3.4.1.1 UNECE WP.29 framework & working groups
- 3.4.1.2 UN Regulation 155
- 3.4.1.3 UN Regulation 156
- 3.4.1.4 UN Regulation 157
- 3.4.2 North America
- 3.4.2.1 United States federal framework
- 3.4.2.2 NHTSA automated vehicles policy & guidance
- 3.4.3 Europe
- 3.4.3.1 EU Type-Approval Regulation 2019/2144
- 3.4.3.2 Vehicle General Safety Regulation (GSR)
- 3.4.4 Asia Pacific
- 3.4.4.1 China MIIT & NDRC National Strategy
- 3.4.4.2 China Intelligent & Connected Vehicle Standards
- 3.4.5 Latin America
- 3.4.6 Middle East & Africa
- 3.4.1 Global
- 3.5 Porter's analysis
- 3.6 PESTEL analysis
- 3.7 Technology and innovation landscape
- 3.7.1 Current technological trends
- 3.7.1.1 LiDAR Technology (Mechanical, Solid-State, FMCW)
- 3.7.1.2 Radar Technology (77-79 GHz, 4D Imaging Radar)
- 3.7.1.3 V2X communication protocols
- 3.7.1.4 5G network integration
- 3.7.2 Emerging technologies
- 3.7.2.1 Frequency-modulated continuous wave (FMCW) LiDAR
- 3.7.2.2 4D imaging radar with elevation detection
- 3.7.2.3 Thermal & infrared cameras
- 3.7.2.4 Hardware security modules (HSM)
- 3.7.1 Current technological trends
- 3.8 Pricing analysis
- 3.8.1.1 Component pricing trends
- 3.8.1.2 Vehicle incremental cost analysis
- 3.8.1.3 Service pricing models
- 3.9 Production statistics
- 3.9.1 Production hubs
- 3.9.2 Consumption hubs
- 3.9.3 Export and import
- 3.10 Cost breakdown analysis
- 3.10.1 Autonomous vehicle system cost structure
- 3.10.2 Manufacturing & production costs
- 3.10.3 Operating cost analysis
- 3.10.4 R&D investment requirements
- 3.10.5 Value chain margin analysis
- 3.11 Patent analysis
- 3.11.1 Global patent filing trends
- 3.11.2 Patent distribution by technology domain
- 3.11.3 Leading patent holders & innovation leaders
- 3.11.4 Geographic distribution of IP activity
- 3.12 Sustainability and environmental aspects
- 3.12.1 Sustainable practices
- 3.12.2 Waste reduction strategies
- 3.12.3 Energy efficiency in production
- 3.12.4 Eco-friendly initiatives
- 3.12.5 Carbon footprint considerations
- 3.13 Investment & funding analysis
- 3.13.1 Venture capital & private equity investment trends
- 3.13.2 Corporate investment & strategic acquisitions
- 3.13.3 M&A activity & valuation multiples
- 3.13.4 Government funding & R&D programs by country
- 3.14 End use behavior & adoption analysis
- 3.14.1 Consumer passenger vehicle segment
- 3.14.2 Commercial fleet operator behavior
- 3.14.3 Ride-hailing & maas user behavior
- 3.14.4 Delivery service End use behavior
- 3.14.5 Industrial & off-road End use behavior
- 3.15 Risk assessment & mitigation framework
- 3.15.1 Technology risks
- 3.15.2 Cybersecurity risks
- 3.15.3 Safety & liability risks
- 3.15.4 Regulatory & policy risks
- 3.15.5 Supply chain risks
Chapter 4 Competitive Landscape, 2025
- 4.1 Introduction
- 4.2 Company market share analysis
- 4.2.1 North America
- 4.2.2 Europe
- 4.2.3 Asia Pacific
- 4.2.4 LATAM
- 4.2.5 MEA
- 4.3 Competitive analysis of major market players
- 4.4 Competitive positioning matrix
- 4.5 Strategic outlook matrix
- 4.6 Key developments
- 4.6.1 Mergers & acquisitions
- 4.6.2 Partnerships & collaborations
- 4.6.3 New product launches
- 4.6.4 Expansion plans and funding
Chapter 5 Market Estimates & Forecast, By Level of Autonomy, 2022 - 2035 ($Bn, Units)
- 5.1 Key trends
- 5.2 Level 1
- 5.3 Level 2
- 5.4 Level 3
- 5.5 Level 4
- 5.6 Level 5
Chapter 6 Market Estimates & Forecast, By Vehicle, 2022 - 2035 ($Bn, Units)
- 6.1 Key trends
- 6.2 Passenger cars
- 6.2.1 SUV
- 6.2.2 Sedan
- 6.2.3 Hatchback
- 6.3 Commercial vehicles
- 6.3.1 Light commercial vehicles (LCV)
- 6.3.2 Medium commercial vehicles (MCV)
- 6.3.3 Heavy commercial vehicles (HCV)
Chapter 7 Market Estimates & Forecast, By Fuel, 2022 - 2035 ($Bn, Units)
- 7.1 Key trends
- 7.2 ICE
- 7.3 Electric
- 7.4 Hybrid
Chapter 8 Market Estimates & Forecast, By Application, 2022 - 2035 ($Bn, Units)
- 8.1 Key trends
- 8.2 Personal transportation
- 8.3 Public transportation
- 8.4 Goods transportation
- 8.5 Industrial applications
- 8.6 Others
Chapter 9 Market Estimates & Forecast, By Sensor, 2022 - 2035 ($Bn, Units)
- 9.1 Key trends
- 9.2 LiDAR
- 9.3 Radar
- 9.4 Cameras
- 9.5 Ultrasonic sensors
- 9.6 GPS/IMU systems
Chapter 10 Market Estimates & Forecast, By Region, 2022 - 2035 ($Bn, Units)
- 10.1 Key trends
- 10.2 North America
- 10.2.1 US
- 10.2.2 Canada
- 10.3 Europe
- 10.3.1 Germany
- 10.3.2 UK
- 10.3.3 France
- 10.3.4 Italy
- 10.3.5 Spain
- 10.3.6 Nordics
- 10.3.7 Russia
- 10.3.8 Poland
- 10.3.9 Romania
- 10.4 Asia Pacific
- 10.4.1 China
- 10.4.2 India
- 10.4.3 Japan
- 10.4.4 South Korea
- 10.4.5 ANZ
- 10.4.6 Vietnam
- 10.4.7 Indonesia
- 10.5 Latin America
- 10.5.1 Brazil
- 10.5.2 Mexico
- 10.5.3 Argentina
- 10.6 MEA
- 10.6.1 South Africa
- 10.6.2 Saudi Arabia
- 10.6.3 UAE
Chapter 11 Company Profiles
- 11.1 Global companies
- 11.1.1 Toyota
- 11.1.2 Volkswagen
- 11.1.3 General Motors
- 11.1.4 Tesla
- 11.1.5 BMW
- 11.1.6 Mercedes-Benz
- 11.1.7 Ford
- 11.1.8 Nissan
- 11.1.9 Honda
- 11.1.10 Hyundai
- 11.1.11 Waymo (Alphabet)
- 11.2 Regional Champions
- 11.2.1 Aurora Innovation
- 11.2.2 AutoX
- 11.2.3 Einride
- 11.2.4 Motional (Hyundai-Aptiv JV)
- 11.2.5 Oxbotica
- 11.2.6 Plus (Formerly Plus.ai)
- 11.2.7 Pony.ai
- 11.2.8 Wayve Technologies
- 11.2.9 WeRide
- 11.2.10 Zoox
- 11.3 Emerging players
- 11.3.1 Beep
- 11.3.2 EasyMile SAS
- 11.3.3 Gatik
- 11.3.4 Ghost Autonomy
- 11.3.5 Helm.ai
- 11.3.6 Kodiak Robotics
- 11.3.7 May Mobility
- 11.3.8 Navya
- 11.3.9 Nuro