|
시장보고서
상품코드
1928881
제로 액체 배출(ZLD) 시스템 시장 기회, 성장 동인, 업계 동향 분석 및 예측(2026-2035년)Zero Liquid Discharge (ZLD) Systems Market Opportunity, Growth Drivers, Industry Trend Analysis, and Forecast 2026 - 2035 |
||||||
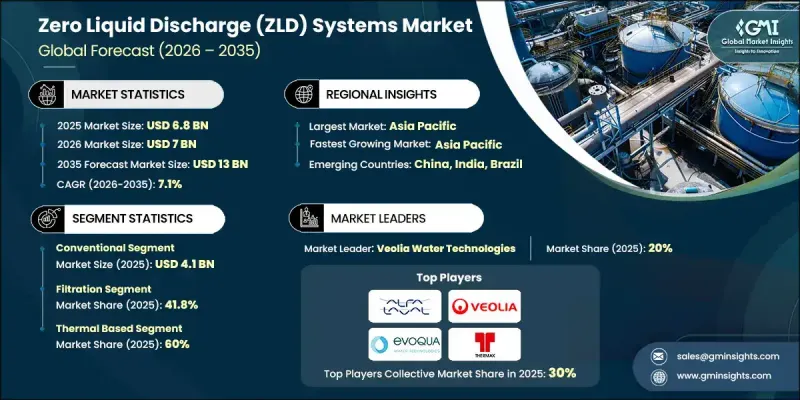
세계의 제로 액체 배출(ZLD) 시스템 시장은 2025년에 68억 달러로 평가되었고, 2035년까지 연평균 복합 성장률(CAGR) 7.1%로 성장하여 130억 달러에 달할 것으로 예측됩니다.

산업 분야에서 수자원 관리, 규제 준수 및 장기적인 지속가능성 목표에 대한 우선순위가 높아짐에 따라 시장의 모멘텀이 강화되고 있습니다. 제조 부문의 다양한 조직이 폐수 처리 위험을 최소화하고, 환경적 책임을 지원하며, 재사용 가능한 수자원에 대한 안정적인 접근을 보장하기 위해 폐수 무방류 솔루션을 채택하고 있습니다. 이러한 전환은 물 스트레스가 증가하는 지역에서 특히 두드러지며, 안정적인 물 회수 시스템은 비즈니스 연속성을 위해 필수적입니다. 기업들이 폐기물 발생량을 줄이고 탄력성을 높이기 위해 노력하는 가운데, ZLD 기술은 광범위한 지속가능성 및 효율성 전략의 필수 요소로 자리 잡고 있습니다. 막분리, 증발, 결정화 기술의 지속적인 발전으로 시스템의 성능과 신뢰성이 향상되어 ZLD는 장기적인 산업 활용에 더욱 실용적입니다. 검증된 성능과 운영 유연성의 균형 잡힌 솔루션을 원하는 산업에서 기존 및 하이브리드 시스템 구성이 주목받고 있습니다. 화학, 제약, 발전 등의 분야에서는 환경적 기대에 부응하는 동시에 공급의 안전성과 운영의 안정성을 강화하기 위한 수단으로 ZLD에 대한 투자를 가속화하고 있습니다.
| 시장 범위 | |
|---|---|
| 개시 연도 | 2025년 |
| 예측 연도 | 2026-2035년 |
| 개시 연도 시장 규모 | 68억 달러 |
| 예측 금액 | 130억 달러 |
| CAGR | 7.1% |
2025년, 기존 시스템은 41억 달러의 수익을 창출했습니다. 이러한 선도적인 위치는 오랜 기간 축적된 열처리 공정에 대한 산업적 지식을 바탕으로 일관성 있고 예측 가능한 결과를 제공합니다. 많은 조직들은 검증된 신뢰성과 기존 수처리 인프라에 쉽게 통합할 수 있다는 장점 때문에 이러한 시스템을 계속해서 선호하고 있습니다.
2025년 기준, 열처리 기반 솔루션은 60%의 점유율을 차지했습니다. 이러한 시스템은 가혹한 조건에서도 효과적으로 물을 회수할 수 있기 때문에 고염분 및 복잡한 산업 폐수 처리에 있어 여전히 우선적인 선택이 되고 있습니다. 극한의 폐수 구성에도 대응할 수 있는 능력은 중공업 사용자들의 지속적인 수요를 뒷받침하고 있습니다.
미국 내 ZLD(Zero Liquid Discharge) 시스템 시장은 88%의 점유율을 차지하며 12억 5,000만 달러 규모에 달했습니다. 이 지역에서는 엄격한 환경 규제와 산업 분야 전반에서 지속 가능한 폐수 관리에 대한 관심이 높아짐에 따라 첨단 ZLD 기술의 채택이 계속 증가하고 있습니다.
자주 묻는 질문
목차
제1장 조사 방법과 범위
제2장 주요 요약
제3장 업계 인사이트
제4장 경쟁 구도
제5장 시장 추산 및 예측 : 시스템 유형별, 2022-2035년
제6장 시장 추산 및 예측 : 기술별, 2022-2035년
제7장 시장 추산 및 예측 : 제조 공정별, 2022-2035년
제8장 시장 추산 및 예측 : 최종 이용 산업별, 2022-2035년
제9장 시장 추산 및 예측 : 유통 채널별, 2022-2035년
제10장 시장 추산 및 예측 : 지역별, 2022-2035년
제11장 기업 개요
LSH 26.02.27The Global Zero Liquid Discharge (ZLD) Systems Market was valued at USD 6.8 billion in 2025 and is estimated to grow at a CAGR of 7.1% to reach USD 13 billion by 2035.
Market momentum is strengthening as industries increasingly prioritize water stewardship, regulatory compliance, and long-term sustainability goals. Organizations across manufacturing sectors are adopting zero liquid discharge solutions to minimize wastewater disposal risks, support environmental responsibility, and ensure consistent access to reusable water resources. This transition is particularly strong in regions facing mounting water stress, where dependable water recovery systems are essential for operational continuity. As companies work to lower waste generation and improve resilience, ZLD technologies are becoming an integral part of broader sustainability and efficiency strategies. Ongoing improvements in membrane separation, evaporation, and crystallization are enhancing system performance and reliability, making ZLD more practical for long-term industrial use. Both conventional and hybrid system configurations are gaining attention as industries seek solutions that balance proven performance with operational flexibility. Sectors such as chemicals, pharmaceuticals, and power generation are accelerating adoption, viewing ZLD investments to meet environmental expectations while reinforcing supply security and operational stability.
| Market Scope | |
|---|---|
| Start Year | 2025 |
| Forecast Year | 2026-2035 |
| Start Value | $6.8 Billion |
| Forecast Value | $13 Billion |
| CAGR | 7.1% |
In 2025, the conventional systems generated USD 4.1 billion. Their leadership is supported by long-standing industrial familiarity with established thermal processes that deliver consistent and predictable outcomes. Many organizations continue to favor these systems due to their proven reliability and ease of integration into existing water treatment infrastructure.
The thermal-based solutions accounted for 60% share in 2025. These systems remain the preferred option for treating highly saline and complex industrial effluents, as they can recover water effectively even under challenging conditions. Their ability to handle extreme wastewater compositions supports continued demand from heavy industrial users.
United States Zero Liquid Discharge (ZLD) Systems Market held 88% share generating USD 1.25 billion. The region benefits from strict environmental oversight and heightened focus on sustainable wastewater management across industrial sectors, which continues to encourage adoption of advanced ZLD technologies.
Key companies active in the Global Zero Liquid Discharge (ZLD) Systems Market include Veolia Water Technologies, Aquatech International, Alfa Laval, GEA Group, Thermax, Toshiba, IDE Water Technologies, Evoqua Water Technologies, Saltworks Technologies, Mitsubishi Power, Praj Industries, Petro Sep Corporation, Aquarion, SafBon Water Technology, and H2O. Companies in the Global Zero Liquid Discharge (ZLD) Systems Market are strengthening their market position by investing in technology innovation to improve energy efficiency and reduce operational costs. Many players are developing modular and hybrid system designs to address diverse industrial wastewater profiles. Strategic partnerships with industrial clients help tailor solutions and secure long-term service contracts. Firms are also expanding regional footprints to serve water-stressed markets more effectively. Emphasis on lifecycle services, digital monitoring, and predictive maintenance enhances system reliability and customer retention.
Table of Contents
Chapter 1 Methodology and Scope
- 1.1 Market scope and definition
- 1.2 Research design
- 1.2.1 Research approach
- 1.2.2 Data collection methods
- 1.3 Data mining sources
- 1.3.1 Global
- 1.3.2 Regional/Country
- 1.4 Base estimates and calculations
- 1.4.1 Base year calculation
- 1.4.2 Key trends for market estimation
- 1.5 Primary research and validation
- 1.5.1 Primary sources
- 1.6 Forecast model
- 1.7 Research assumptions and limitations
Chapter 2 Executive Summary
- 2.1 Industry 360° synopsis
- 2.2 Key market trends
- 2.2.1 By Regional
- 2.2.2 By System type
- 2.2.3 By Technology
- 2.2.4 By Process
- 2.2.5 By End user industry
- 2.2.6 By Distribution channel
- 2.3 CXO perspectives: Strategic imperatives
- 2.3.1 Key decision points for industry executives
- 2.3.2 Critical success factors for market players
- 2.4 Future outlook and strategic recommendations
Chapter 3 Industry Insights
- 3.1 Industry ecosystem analysis
- 3.1.1 Supplier landscape
- 3.1.2 Profit margin
- 3.1.3 Value addition at each stage
- 3.1.4 Factor affecting the value chain
- 3.2 Industry impact forces
- 3.2.1 Growth drivers
- 3.2.1.1 Increasing Focus on Water Conservation and Resource Efficiency
- 3.2.1.2 Stricter Environmental Regulations and Compliance Mandates
- 3.2.1.3 Growing Industry Shift Toward Sustainable Wastewater Management
- 3.2.2 Industry pitfalls & challenges
- 3.2.2.1 High Capital Investment Requirements
- 3.2.2.2 High Operational and Maintenance Costs
- 3.2.3 Opportunities
- 3.2.3.1 Advancements in Membrane and Thermal Technologies
- 3.2.3.2 Expansion in Emerging Economies Driven by Sustainability Priorities
- 3.2.1 Growth drivers
- 3.3 Growth potential analysis
- 3.4 Major market trends and disruptions
- 3.5 Future market trends
- 3.6 Risk and mitigation Analysis
- 3.7 Technology and innovation landscape
- 3.7.1 Current technological trends
- 3.7.2 Emerging technologies
- 3.8 Price trends
- 3.8.1 By Region
- 3.9 Regulatory landscape
- 3.9.1 North America
- 3.9.2 Europe
- 3.9.3 Asia-Pacific
- 3.9.4 Middle East and Africa
- 3.9.5 Latin America
- 3.10 Porter';s analysis
- 3.11 PESTEL analysis
Chapter 4 Competitive Landscape, 2025
- 4.1 Introduction
- 4.2 Company market share analysis
- 4.2.1 By region
- 4.2.1.1 North America
- 4.2.1.2 Europe
- 4.2.1.3 Asia Pacific
- 4.2.1.4 Latin America
- 4.2.1.5 Middle East and Africa
- 4.2.1 By region
- 4.3 Company matrix analysis
- 4.4 Competitive analysis of major market players
- 4.5 Competitive positioning matrix
- 4.6 Key developments
- 4.6.1 Mergers & acquisitions
- 4.6.2 Partnerships & collaborations
- 4.6.3 New product launches
- 4.6.4 Expansion plans
Chapter 5 Market Estimates & Forecast, By System Type, 2022-2035 (USD Billion) (Thousand Units)
- 5.1 Key trends
- 5.2 Conventional
- 5.3 Smart
Chapter 6 Market Estimates & Forecast, By Technology, 2022-2035 (USD Billion) (Thousand Units)
- 6.1 Key trends
- 6.2 Thermal Based
- 6.3 Membrane Based
Chapter 7 Market Estimates & Forecast, By Process, 2022-2035 (USD Billion) (Thousand Units)
- 7.1 Key trends
- 7.2 Pre-treatment
- 7.3 Filtration
- 7.4 Evaporation/crystallization
Chapter 8 Market Estimates & Forecast, By End Use Industry, 2022-2035 (USD Billion) (Thousand Units)
- 8.1 Key trends
- 8.2 Oil and Gas
- 8.3 Pharmaceutical
- 8.4 Energy and Power
- 8.5 Chemicals and Petrochemicals
- 8.6 Others
Chapter 9 Market Estimates & Forecast, By Distribution Channel, 2022-2035 (USD Billion) (Thousand Units)
- 9.1 Key trends
- 9.2 Direct sales
- 9.3 Indirect sales
Chapter 10 Market Estimates and Forecast, By Region, 2022 - 2035 (USD Billion) (Thousand Units)
- 10.1 Key trends
- 10.2 North America
- 10.2.1 U.S.
- 10.2.2 Canada
- 10.3 Europe
- 10.3.1 Germany
- 10.3.2 UK
- 10.3.3 France
- 10.3.4 Italy
- 10.3.5 Spain
- 10.3.6 Turkey
- 10.4 Asia Pacific
- 10.4.1 China
- 10.4.2 Japan
- 10.4.3 India
- 10.4.4 Australia
- 10.4.5 South Korea
- 10.5 Latin America
- 10.5.1 Brazil
- 10.5.2 Mexico
- 10.5.3 Argentina
- 10.6 Middle East and Africa
- 10.6.1 South Africa
- 10.6.2 Saudi Arabia
- 10.6.3 UAE
Chapter 11 Company Profiles
- 11.1 Alfa Laval
- 11.2 Aquarion
- 11.3 Aquatech International
- 11.4 Evoqua Water Technologies
- 11.5 GEA Group
- 11.6 H2O
- 11.7 IDE Water Technologies
- 11.8 Mitsubishi Power
- 11.9 Petro Sep Corporation
- 11.10 Praj Industries
- 11.11 SafBon Water Technology
- 11.12 Saltworks Technologies
- 11.13 Thermax
- 11.14 Toshiba
- 11.15 Veolia Water Technologies