
|
시장보고서
상품코드
1928954
화학 폐열 회수 시스템 시장 기회, 성장요인, 업계 동향 분석 및 예측(2026-2035년)Chemical Waste Heat Recovery Systems Market Opportunity, Growth Drivers, Industry Trend Analysis, and Forecast 2026 - 2035 |
||||||
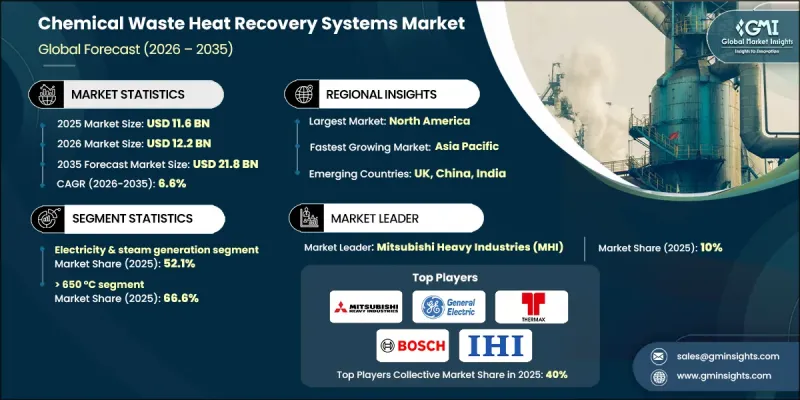
세계의 화학 폐열 회수 시스템 시장은 2025년에 116억 달러로 평가되었고, 2035년까지 연평균 복합 성장률(CAGR) 6.6%로 성장하여 218억 달러에 이를 것으로 예측됩니다.

성장을 뒷받침하는 것은 주요 화학업체들이 설정한 보다 엄격한 탈탄소화 목표와 연료 기반 증기 발생 및 공정 열 소비 감소에 초점을 맞추는 경향이 강화되고 있다는 점입니다. 폐열회수는 배출량을 줄이면서 에너지 효율을 향상시키는 직접적이고 비용 효율적인 솔루션으로 채택되고 있습니다. 기업이 배출량 목표를 비즈니스 성과 지표와 일치시키면서, 이러한 시스템은 선택적 업그레이드가 아닌 전략적 투자로 간주되고 있습니다. 이러한 변화는 변동하는 에너지 비용 속에서 영업이익률을 안정화시키는데 도움이 되고 있습니다. 고객이 저탄소 화학제품공급을 점점 더 많이 요구하고 있는 가운데, 내부 탄소 회계 및 제품 수준의 배출량 추적의 보급이 수요를 더욱 가속화하고 있습니다. 규제 프레임워크도 신규 설비 승인 전에 상세한 에너지 평가와 잉여 열에너지 회수를 의무화하여 효율성 우선의 계획 수립을 강화하고 있습니다. 재정적 인센티브와 지원적인 정책 구조로 인해 이러한 시스템의 도입은 장기적인 자본 계획에 쉽게 포함될 수 있으며, 그 정당성도 높아졌습니다.
| 시장 범위 | |
|---|---|
| 개시 연도 | 2025년 |
| 예측 연도 | 2026-2035년 |
| 개시 연도 가치 | 116억 달러 |
| 예측 금액 | 218억 달러 |
| CAGR | 6.6% |
전력 및 증기 발전 부문은 2025년 52.1%의 점유율을 차지할 것으로 예상되며, 2035년까지 연평균 7.5%의 성장률을 보일 것으로 전망됩니다. 화학업체들은 배출 강도를 줄이면서 현장의 전력 및 증기 수요를 지원하기 위해 회수된 열을 이용 가능한 에너지로 전환하는 움직임을 가속화하고 있습니다.
650℃ 이상에서 작동하는 시스템은 2025년 66.6%의 점유율을 차지하며 2035년까지 연평균 복합 성장률(CAGR) 6%를 나타낼 것으로 예측됩니다. 고온 공정에서는 회수 가능한 열이 다량으로 발생하며, 이 에너지를 회수하는 것이 에너지 집약적 화학 공정에서 차세대 열효율 전략의 핵심이 되고 있습니다.
미국 화학 폐열 회수 시스템 시장은 2025년 82%의 점유율을 차지하며 47억 달러 규모에 달할 것으로 예측됩니다. 이 지역의 성장은 효율화 투자를 지원하고 화학 및 석유화학 시설에서 첨단 폐열 회수 솔루션의 도입을 가속화하는 유리한 정책적 메커니즘에 의해 촉진되고 있습니다.
자주 묻는 질문
목차
제1장 조사 방법과 범위
제2장 주요 요약
제3장 업계 인사이트
- 생태계 분석
- 규제 상황
- 업계에 대한 영향요인
- 성장 촉진요인
- 업계의 잠재적 리스크&과제
- 성장 가능성 분석
- Porter의 Five Forces 분석
- 공급 기업의 교섭력
- 바이어의 교섭력
- 신규 진출업체의 위협
- 대체품의 위협
- PESTEL 분석
- 새로운 기회와 동향
- 디지털화와 IoT 통합
- 신흥 시장에의 진출
제4장 경쟁 구도
- 서론
- 기업의 시장 점유율 분석
- 전략적 이니셔티브
- 경쟁 벤치마킹
- 전략적 대시보드
- 혁신과 기술 동향
제5장 시장 규모와 예측 : 용도별, 2022-2035
- 예열
- 전력·증기 발생
- 증기 런킨 사이클
- 유기 랭킨 사이클
- 카리나사이크루
- 기타
제6장 시장 규모와 예측 : 온도별, 2022-2035
- 230℃미만
- 230оC-650оC
- 650℃초
제7장 시장 규모와 예측 : 지역별, 2022-2035
- 북미
- 미국
- 캐나다
- 멕시코
- 유럽
- 영국
- 프랑스
- 독일
- 이탈리아
- 스페인
- 아시아태평양
- 중국
- 인도
- 일본
- 호주
- 한국
- 중동 및 아프리카
- 사우디아라비아
- 남아프리카공화국
- 아랍에미리트(UAE)
- 라틴아메리카
- 브라질
- 아르헨티나
제8장 기업 개요
- Aura
- BIHL
- Bosch
- Climeon
- Cochran
- Durr Group
- Echogen
- Exergy International
- Forbes Marshall
- General Electric
- IHI Power Systems
- John Wood Group
- Mitsubishi Heavy Industries
- Ormat
- Promec Engineering
- Rentech Boilers
- Siemens Energy
- Sofinter
- Thermax
- Viessmann
The Global Chemical Waste Heat Recovery Systems Market was valued at USD 11.6 billion in 2025 and is estimated to grow at a CAGR of 6.6% to reach USD 21.8 billion by 2035.
Growth is supported by stricter decarbonization targets set by large chemical producers, with increasing focus on reducing fuel-based steam generation and process heat consumption. Waste heat recovery is being adopted as a direct and cost-effective solution to lower emissions while improving energy efficiency. As companies align emissions targets with operational performance metrics, these systems are increasingly viewed as strategic investments rather than optional upgrades. This shift helps stabilize operating margins amid fluctuating energy costs. Broader adoption of internal carbon accounting and product-level emissions tracking is further accelerating demand, as customers increasingly expect lower-carbon chemical outputs. Regulatory frameworks are also reinforcing efficiency-first planning by requiring detailed energy assessments and recovery of excess thermal energy before approving new capacity. Financial incentives and supportive policy structures are making these systems easier to justify and integrate into long-term capital programs.
| Market Scope | |
|---|---|
| Start Year | 2025 |
| Forecast Year | 2026-2035 |
| Start Value | $11.6 Billion |
| Forecast Value | $21.8 Billion |
| CAGR | 6.6% |
The electricity and steam generation segment accounted for 52.1% share in 2025 and is projected to grow at a CAGR of 7.5% through 2035. Chemical producers are increasingly converting recovered heat into usable energy to support on-site power and steam needs while reducing emissions intensity.
The systems operating above 650°C represented 66.6% share in 2025 and are expected to grow at a CAGR of 6% by 2035. High-temperature processes generate substantial recoverable heat, and capturing this energy is becoming central to next-generation thermal efficiency strategies across energy-intensive chemical operations.
U.S. Chemical Waste Heat Recovery Systems Market held 82% share in 2025 and generated USD 4.7 billion. Regional growth is being driven by favorable policy mechanisms that support efficiency investments and accelerate the adoption of advanced heat recovery solutions across chemical and petrochemical facilities.
Key companies active in the Global Chemical Waste Heat Recovery Systems Market include Siemens Energy, Mitsubishi Heavy Industries, General Electric, Bosch, Thermax, Viessmann, John Wood Group, Ormat, Exergy International, Sofinter, Durr Group, IHI Power Systems, Rentech Boilers, Climeon, Forbes Marshall, Aura, BIHL, Cochran, Promec Engineering, and Echogen. Companies operating in the Chemical Waste Heat Recovery Systems Market are strengthening their positions through technology advancement, project integration capabilities, and strategic collaborations. Manufacturers are focusing on developing scalable, high-efficiency solutions that can be deployed across multiple plant configurations. Many players are expanding service offerings to include system design, optimization, and long-term maintenance to improve customer value. Geographic expansion into regions with strong regulatory support is also a key priority.
Table of Contents
Chapter 1 Methodology & Scope
- 1.1 Research approach
- 1.2 Quality commitment
- 1.2.1 GMI AI policy & data integrity commitment
- 1.2.1.1 Source consistency protocol
- 1.2.1 GMI AI policy & data integrity commitment
- 1.3 Research Trail & Confidence Scoring
- 1.3.1 Research Trail Components
- 1.3.2 Scoring Components
- 1.4 Data Collection
- 1.4.1 Partial list of primary sources
- 1.5 Data mining sources
- 1.5.1 Paid sources
- 1.5.1.1 Sources, by region
- 1.5.1 Paid sources
- 1.6 Base estimates and calculations
- 1.6.1 Base year calculation for any one approach
- 1.7 Forecast model
- 1.8 Research transparency addendum
- 1.8.1 Source attribution framework
- 1.8.2 Quality assurance metrics
- 1.8.3 Our commitment to trust
- 1.9 Market definitions
Chapter 2 Executive Summary
- 2.1 Industry synopsis, 2022 - 2035
- 2.1.1 Business trends
- 2.1.2 Application trends
- 2.1.3 Temperature trends
- 2.1.4 Regional trends
Chapter 3 Industry Insights
- 3.1 Industry ecosystem analysis
- 3.2 Regulatory landscape
- 3.3 Industry impact forces
- 3.3.1 Growth drivers
- 3.3.2 Industry pitfalls & challenges
- 3.4 Growth potential analysis
- 3.5 Porter';s analysis
- 3.5.1 Bargaining power of suppliers
- 3.5.2 Bargaining power of buyers
- 3.5.3 Threat of new entrants
- 3.5.4 Threat of substitutes
- 3.6 PESTEL analysis
- 3.6.1 Political factors
- 3.6.2 Economic factors
- 3.6.3 Social factors
- 3.6.4 Technology factors
- 3.6.5 environmental factors
- 3.6.6 Legal factors
- 3.7 Emerging opportunities & trends
- 3.7.1 Digitalization and IoT integration
- 3.7.2 Emerging market penetration
Chapter 4 Competitive landscape, 2025
- 4.1 Introduction
- 4.2 Company market share analysis, 2025
- 4.3 Strategic initiatives
- 4.4 Competitive benchmarking
- 4.5 Strategic dashboard
- 4.6 Innovation & technology landscape
Chapter 5 Market Size and Forecast, By Application, 2022 - 2035 (USD Billion)
- 5.1 Key trends
- 5.2 Pre-heating
- 5.3 Electricity & steam generation
- 5.3.1 Steam rankine cycle
- 5.3.2 Organic rankine cycle
- 5.3.3 Kalina cycle
- 5.4 Other
Chapter 6 Market Size and Forecast, By Temperature, 2022 - 2035 (USD Billion)
- 6.1 Key trends
- 6.2 < 230°C
- 6.3 230°C - 650 °C
- 6.4 > 650 °C
Chapter 7 Market Size and Forecast, By Region, 2022 - 2035 (USD Billion)
- 7.1 Key trends
- 7.2 North America
- 7.2.1 U.S.
- 7.2.2 Canada
- 7.2.3 Mexico
- 7.3 Europe
- 7.3.1 UK
- 7.3.2 France
- 7.3.3 Germany
- 7.3.4 Italy
- 7.3.5 Spain
- 7.4 Asia Pacific
- 7.4.1 China
- 7.4.2 India
- 7.4.3 Japan
- 7.4.4 Australia
- 7.4.5 South Korea
- 7.5 Middle East & Africa
- 7.5.1 Saudi Arabia
- 7.5.2 South Africa
- 7.5.3 UAE
- 7.6 Latin America
- 7.6.1 Brazil
- 7.6.2 Argentina
Chapter 8 Company Profiles
- 8.1 Aura
- 8.2 BIHL
- 8.3 Bosch
- 8.4 Climeon
- 8.5 Cochran
- 8.6 Durr Group
- 8.7 Echogen
- 8.8 Exergy International
- 8.9 Forbes Marshall
- 8.10 General Electric
- 8.11 IHI Power Systems
- 8.12 John Wood Group
- 8.13 Mitsubishi Heavy Industries
- 8.14 Ormat
- 8.15 Promec Engineering
- 8.16 Rentech Boilers
- 8.17 Siemens Energy
- 8.18 Sofinter
- 8.19 Thermax
- 8.20 Viessmann
