|
시장보고서
상품코드
1959333
산업용 액추에이터 시장 기회, 성장요인, 업계 동향 분석 및 예측(2026-2035년)Industrial Actuators Market Opportunity, Growth Drivers, Industry Trend Analysis, and Forecast 2026 - 2035 |
||||||
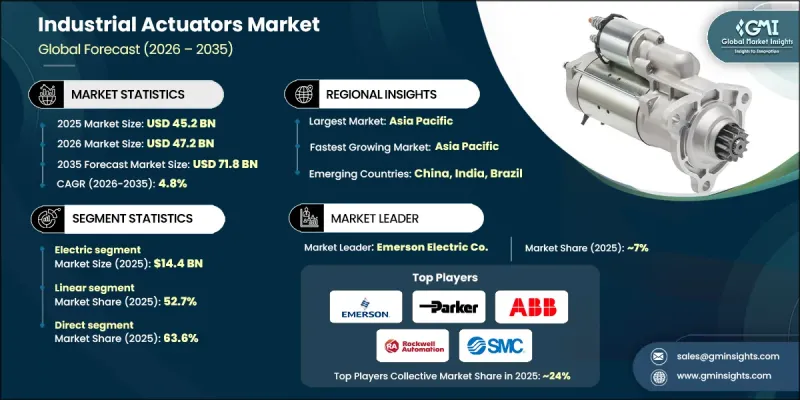
세계의 산업용 액추에이터 시장은 2025년에 452억 달러로 평가되었고, 2035년까지 연평균 복합 성장률(CAGR) 4.8%로 성장하여 718억 달러에 이를 것으로 예측되고 있습니다.

이러한 성장은 운영 효율성 향상, 정확도 개선, 확장 가능한 생산량을 지원하기 위한 자동화 생산 시스템의 채택 증가를 반영하고 있습니다. 액추에이터는 자동화 설비 내에서 제어된 동작을 가능하게 하며, 현대 모션 제어 시스템의 기본 요소입니다. 생산 환경 전반에 걸쳐 자동화가 심화됨에 따라 액추에이터 기술에 대한 의존도는 더욱 높아지고 있습니다. 제조 공정의 지속적인 발전은 액추에이터의 설계, 성능 및 통합 능력을 꾸준히 향상시키고 있습니다. 제조업체들은 자동화 대응력을 기반으로 생산성 및 효율성 목표를 설정하는 경향이 증가하고 있으며, 이는 첨단 액추에이터 솔루션의 중요성을 직접적으로 증가시키고 있습니다. 따라서 액추에이터 기술의 지속적인 혁신은 앞으로도 전 세계 산업 자동화의 발전에 핵심적인 역할을 할 것으로 예측됩니다.
| 시장 범위 | |
|---|---|
| 개시 연도 | 2025년 |
| 예측 연도 | 2026-2035년 |
| 개시 연도 가치 | 452억 달러 |
| 예측 금액 | 718억 달러 |
| CAGR | 4.8% |
전동 액추에이터 부문은 2025년 144억 달러 시장 규모를 기록할 것으로 예상되며, 2026년부터 2035년까지 연평균 복합 성장률(CAGR) 4.6%로 성장할 것으로 전망됩니다. 이러한 시스템은 높은 에너지 효율, 낮은 유지보수 요구 사항, 디지털 제어 플랫폼과의 원활한 호환성으로 인해 채택이 확대되고 있습니다. 유압 및 공압식 대체품에 비해 전기 액추에이터는 에너지 소비가 적고 더 정밀한 모션 제어를 지원합니다. 센서, 커넥티드 시스템, 예측 모니터링 도구와의 통합 기능은 최신 자동화 프레임워크와 지속가능성 목표를 지원합니다. 이러한 장점으로 인해 전동 액추에이터는 향후 자동화 투자에 있어 주요한 선택으로 자리매김하고 있습니다.
선형 액추에이터 부문은 2025년 52.7%의 점유율을 차지할 것으로 예상되며, 2035년까지 연평균 4.1%의 성장률을 보일 것으로 예측됩니다. 리니어 액추에이터는 신뢰할 수 있는 성능, 설계의 단순성, 폭넓은 기능 적응성으로 높은 평가를 받고 있습니다. 산업용 모션 시스템 및 유량 제어 시스템에 광범위하게 도입되어 주요 수익원으로 자리매김하고 있습니다. 이 부문의 탄탄한 입지는 플랜트 운영 및 설비 인프라에서 선형 모션 솔루션이 차지하는 구조적 역할을 강조하고 있습니다.
미국 산업용 액추에이터 시장은 2025년 60억 달러 규모에 달할 것으로 예상되며, 2026년부터 2035년까지 연평균 4.9%의 성장률을 보일 것으로 전망됩니다. 선진화된 자동화 생태계와 정밀 모션 기술에 대한 높은 수요로 인해 북미에서 선도적인 점유율을 차지하고 있습니다. 대규모 산업 인프라에 대한 적극적인 투자와 지속적인 공정 최적화가 액추에이터 도입을 촉진하고 있습니다. 이 시장은 효율성, 신뢰성, 고도의 제어 기능을 중시하는 성숙한 제조거점의 혜택을 누리고 있습니다.
자주 묻는 질문
목차
제1장 조사 방법과 범위
제2장 주요 요약
제3장 업계 인사이트
제4장 경쟁 구도
제5장 시장 추산 및 예측 : 제품 유형별, 2022-2035
제6장 시장 추산 및 예측 : 동작 유형별, 2022-2035
제7장 시장 추산 및 예측 : 용도별, 2022-2035
제8장 시장 추산 및 예측 : 최종 용도별, 2022-2035
제9장 시장 추산 및 예측 : 유통 채널별, 2022-2035
제10장 시장 추산 및 예측 : 지역별, 2022-2035
제11장 기업 개요
LSH 26.03.18The Global Industrial Actuators Market was valued at USD 45.2 billion in 2025 and is estimated to grow at a CAGR of 4.8% to reach USD 71.8 billion by 2035.
The growth reflects the increasing adoption of automated production systems designed to enhance operational efficiency, improve precision, and support scalable manufacturing output. Actuators enable controlled motion within automated equipment, making them a foundational element of modern motion control systems. As automation deepens across production environments, reliance on actuator technology continues to intensify. Ongoing advancements in manufacturing processes are prompting consistent upgrades in actuator design, performance, and integration capabilities. Manufacturers increasingly define their productivity and efficiency goals around automation readiness, which directly elevates the importance of advanced actuator solutions. Continuous innovation in actuator technology is therefore expected to remain central to the evolution of industrial automation worldwide.
| Market Scope | |
|---|---|
| Start Year | 2025 |
| Forecast Year | 2026-2035 |
| Start Value | $45.2 Billion |
| Forecast Value | $71.8 Billion |
| CAGR | 4.8% |
The electric actuators segment generated USD 14.4 billion in 2025 and is expected to grow at a CAGR of 4.6% from 2026 to 2035. These systems are gaining preference due to higher energy efficiency, reduced servicing requirements, and smooth compatibility with digital control platforms. Compared to hydraulic and pneumatic alternatives, electric actuators consume less energy and support more precise motion control. Their ability to integrate with sensors, connected systems, and predictive monitoring tools supports modern automation frameworks and sustainability goals. The advantages position electric actuators as a primary choice for future automation investments.
The linear actuator segment accounted for 52.7% share in 2025 and is forecast to grow at a CAGR of 4.1% through 2035. Linear actuators are valued for dependable performance, design simplicity, and broad functional adaptability. Their extensive deployment across industrial motion and flow control systems has established them as a dominant revenue contributor. The segment's strong position highlights the structural role linear motion solutions play within plant operations and equipment infrastructure.
U.S. Industrial Actuators Market reached USD 6 billion in 2025 and is projected to grow at a CAGR of 4.9% from 2026 to 2035. The country holds a leading share within North America due to its advanced automation ecosystem and high demand for precision motion technologies. Strong investment in large-scale industrial infrastructure and process optimization continues to support actuator adoption. The market benefits from a mature manufacturing base that prioritizes efficiency, reliability, and advanced control capabilities.
Key companies operating in the Global Industrial Actuators Market include Parker Hannifin Corp, ABB, Emerson Electric Co., SMC Corporation, Rotork plc, Eaton Corporation plc, Rockwell Automation, Flowserve Corporation, Moog Inc., Festo AG & Co. KG, Curtiss-Wright, IMI Critical Engineering, KITZ Corporation, Tolomatic, Inc., and Venture MFG. Co. Companies in the industrial actuators market focus on technology innovation, portfolio expansion, and strategic partnerships to strengthen their market position. Many players invest heavily in research and development to enhance energy efficiency, precision, and digital compatibility. Integration of smart features such as condition monitoring and predictive maintenance is a key priority. Firms also pursue mergers, acquisitions, and collaborations to expand geographic reach and access new customer segments. Customization capabilities and application-specific solutions help suppliers differentiate their offerings. Additionally, manufacturers emphasize sustainability initiatives and compliance with evolving industrial standards to reinforce long-term competitiveness and customer trust.
Table of Contents
Chapter 1 Methodology & Scope
- 1.1 Market scope & definitions
- 1.2 Research design
- 1.2.1 Research approach
- 1.2.2 Data collection methods
- 1.3 Base estimates and calculations
- 1.3.1 Base year calculation
- 1.3.2 Market estimates & forecasts parameters
- 1.4 Forecast Model
- 1.4.1 Key trends for market estimates
- 1.4.2 Quantified market impact analysis
- 1.4.2.1 Mathematical impact of growth parameters on forecast
- 1.4.3 Scenario analysis framework
- 1.5 Primary research and validation
- 1.5.1 Some of the primary sources (but not limited to)
- 1.6 Data mining sources
- 1.6.1 Paid Sources
- 1.7 Primary research and validation
- 1.7.1 Primary sources
- 1.8 Research Trail & confidence scoring
- 1.8.1 Research trail components
- 1.8.2 Scoring components
- 1.9 Research transparency addendum
- 1.9.1 Source attribution framework
- 1.9.2 Quality assurance metrics
- 1.9.3 Our commitment to trust
- 1.10 Market Definitions
Chapter 2 Executive Summary
- 2.1 Industry 360° synopsis
- 2.2 Key market trends
- 2.2.1 Regional
- 2.2.2 Type
- 2.2.3 Motion Type
- 2.2.4 Application
- 2.2.5 End use
- 2.2.6 Distribution channel
- 2.3 CXO perspectives: Strategic imperatives
- 2.3.1 Key decision points for industry executives
- 2.3.2 Critical success factors for market players
- 2.4 Future outlook and strategic recommendations
Chapter 3 Industry Insights
- 3.1 Industry ecosystem analysis
- 3.1.1 Supplier landscape
- 3.1.2 Profit margin
- 3.1.3 Value addition at each stage
- 3.1.4 Factor affecting the value chain
- 3.2 Industry impact forces
- 3.2.1 Growth drivers
- 3.2.1.1 Rising industrial automation & robotics adoption
- 3.2.1.2 Demand for energy-efficient & precise control systems
- 3.2.1.3 Growth of smart manufacturing (industry 4.0)
- 3.2.2 Pitfalls & Challenges
- 3.2.2.1 High cost of advanced actuators
- 3.2.2.2 Requirement for skilled professionals
- 3.2.3 Opportunities
- 3.2.3.1 Rising adoption of electric actuators
- 3.2.3.2 Expansion in Asia Pacific & emerging markets
- 3.2.1 Growth drivers
- 3.3 Growth potential analysis
- 3.4 Future market trends
- 3.5 Technology and innovation landscape
- 3.5.1 Current technological trends
- 3.5.2 Emerging technologies
- 3.6 Price trends
- 3.6.1 By region
- 3.6.2 By product
- 3.7 Regulatory landscape
- 3.7.1 North America
- 3.7.1.1 US: Consumer Product Safety Commission (CPSC) 16 Code of Federal Regulations (CFR) part 1512
- 3.7.1.2 Canada: International Organization for Standardization (ISO) 4210
- 3.7.2 Europe
- 3.7.2.1 Germany: Deutsches Institut fur Normung (DIN) European Norm (EN) ISO 4210
- 3.7.2.2 UK: European Norm (EN) ISO 4210 / United Kingdom Conformity Assessed (UKCA)
- 3.7.2.3 France: European Norm (EN) ISO 4210
- 3.7.3 Asia Pacific
- 3.7.3.1 China: Guobiao (GB) 3565
- 3.7.3.2 India: Indian Standard (IS) 10613
- 3.7.3.3 Japan: Japanese Industrial Standard (JIS) D 9110
- 3.7.4 Latin America
- 3.7.4.1 Brazil: Associacao Brasileira de Normas Tecnicas (ABNT) Norma Brasileira (NBR) ISO 4210
- 3.7.4.2 Mexico: International Organization for Standardization (ISO) 4210
- 3.7.5 Middle East & Africa
- 3.7.5.1 South Africa: South African National Standard (SANS) 311
- 3.7.5.2 Saudi Arabia: Saudi Standards, Metrology and Quality Organization (SASO) Gulf Standardization Organization (GSO) ISO 4210
- 3.7.1 North America
- 3.8 Trade statistics (HS code- 84819090)
- 3.8.1 Major importing countries
- 3.8.2 Major exporting countries
- 3.9 Porter’s analysis
- 3.10 PESTEL analysis
Chapter 4 Competitive Landscape, 2025
- 4.1 Introduction
- 4.2 Company market share analysis
- 4.2.1 By Region
- 4.2.1.1 North America
- 4.2.1.2 Europe
- 4.2.1.3 Asia Pacific
- 4.2.1.4 Latin America
- 4.2.1.5 Middle East & Africa
- 4.2.1 By Region
- 4.3 Company matrix analysis
- 4.4 Competitive analysis of major market players
- 4.5 Competitive positioning matrix
- 4.6 Key developments
- 4.6.1 Mergers & acquisitions
- 4.6.2 Partnerships & collaborations
- 4.6.3 New product launches
- 4.6.4 Expansion plans
Chapter 5 Market Estimates & Forecast, By Product Type, 2022 - 2035, (USD Billion) (Thousand Units)
- 5.1 Key trends
- 5.2 Electric
- 5.3 Pneumatic
- 5.4 Hydraulic
- 5.5 Others
Chapter 6 Market Estimates & Forecast, By Motion Type, 2022 - 2035, (USD Billion) (Thousand Units)
- 6.1 Key trends
- 6.2 Linear
- 6.3 Rotary
Chapter 7 Market Estimates & Forecast, By Application, 2022 - 2035, (USD Billion) (Thousand Units)
- 7.1 Key trends
- 7.2 Valves
- 7.3 Pumps
- 7.4 Dampers
- 7.5 Conveyors
- 7.6 Robotics
Chapter 8 Market Estimates & Forecast, By End Use, 2022 - 2035, (USD Billion) (Thousand Units)
- 8.1 Key trends
- 8.2 Oil & gas
- 8.3 Power generation
- 8.4 Water & wastewater treatment
- 8.5 Chemical & petrochemical
- 8.6 Food & beverage
- 8.7 Pharmaceuticals
- 8.8 Mining & metals
- 8.9 Automotive & manufacturing
- 8.10 Aerospace & defense
Chapter 9 Market Estimates & Forecast, By Distribution Channel, 2022 - 2035, (USD Billion) (Thousand Units)
- 9.1 Key trends
- 9.2 Direct
- 9.3 Indirect
Chapter 10 Market Estimates & Forecast, By Region, 2022 - 2035, (USD Billion) (Thousand Units)
- 10.1 Key trends
- 10.2 North America
- 10.2.1 U.S.
- 10.2.2 Canada
- 10.3 Europe
- 10.3.1 Germany
- 10.3.2 UK
- 10.3.3 France
- 10.3.4 Italy
- 10.3.5 Spain
- 10.4 Asia Pacific
- 10.4.1 China
- 10.4.2 India
- 10.4.3 Japan
- 10.4.4 South Korea
- 10.4.5 Australia
- 10.5 Latin America
- 10.5.1 Brazil
- 10.5.2 Mexico
- 10.5.3 Argentina
- 10.6 MEA
- 10.6.1 Saudi Arabia
- 10.6.2 UAE
- 10.6.3 South Africa
Chapter 11 Company Profiles
- 11.1 ABB
- 11.2 Curtiss-Wright
- 11.3 Eaton Corporation plc
- 11.4 Emerson Electric Co.
- 11.5 Festo AG & Co. KG
- 11.6 Flowserve Corporation
- 11.7 IMI Critical Engineering
- 11.8 KITZ Corporation
- 11.9 Moog Inc.
- 11.10 Parker Hannifin Corp
- 11.11 Rockwell Automation
- 11.12 Rotork plc
- 11.13 SMC Corporation
- 11.14 Tolomatic, Inc.
- 11.15 Venture MFG. Co.