
|
시장보고서
상품코드
1959600
지문 출입 통제 시스템 시장 기회, 성장요인, 업계 동향 분석 및 예측(2026-2035년)Fingerprint Access Control System Market Opportunity, Growth Drivers, Industry Trend Analysis, and Forecast 2026 - 2035 |
||||||
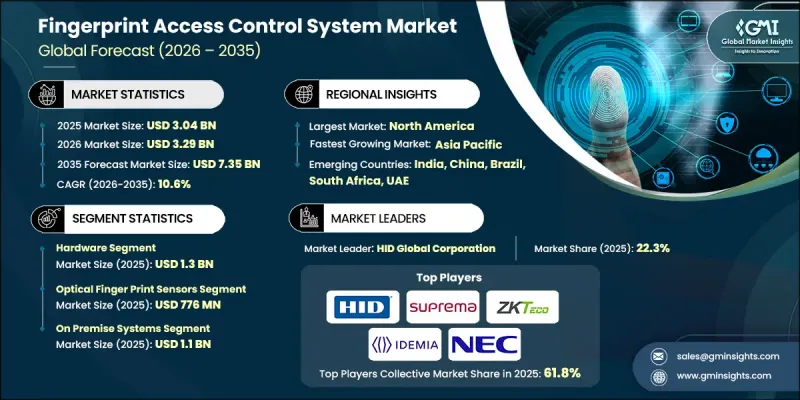
세계의 지문 출입 통제 시스템 시장은 2025년에 30억 4,000만 달러로 평가되었고, 2035년까지 연평균 복합 성장률(CAGR) 10.6%로 성장하여 73억 5,000만 달러에 이를 것으로 예측됩니다.

시장 확대의 배경에는 주거, 상업, 산업 시설에서 보안에 대한 중요성이 높아지고, 기존 출입 방식에서 첨단 생체인식 솔루션으로의 전환이 진행되고 있다는 점을 꼽을 수 있습니다. 또한, 정부의 중요 구역에 대한 안전한 접근 보장 의무화, IoT 및 스마트 빌딩 기술과의 통합 발전, 신흥국의 상업 인프라 개발 급증 등이 성장을 견인하고 있습니다. 조직과 당국은 기존의 키, ID 배지, PIN 기반 시스템이 복제 및 악용의 위험에 노출되어 있는 반면, 생체 인증이 신뢰할 수 있는 개별 인증을 제공한다는 사실을 점점 더 많이 인식하고 있습니다. 이러한 전환은 공공 및 민간 부문을 막론하고 침입 방지, 책임성 강화, 중요 인프라, 작업장 자산 및 민감한 업무 영역의 보호에 대한 필요성에 의해 추진되고 있습니다.
| 시장 범위 | |
|---|---|
| 개시 연도 | 2025년 |
| 예측 연도 | 2026-2035년 |
| 개시 연도 가치 | 30억 4,000만 달러 |
| 예측 금액 | 73억 5,000만 달러 |
| CAGR | 10.6% |
하드웨어 분야는 2025년 13억 달러에 달했습니다. 보안에 대한 요구사항이 높아짐에 따라 산업시설, 상업시설, 정부시설에서 지문 스캐너, 컨트롤러, 리더기 도입이 확대되고 있습니다. 정부의 보안 인프라 현대화 노력이 공공시설 및 중요 자산에 대한 강력한 하드웨어 도입을 가속화하고 있습니다. 각 제조업체들은 정부 및 업계의 엄격한 보안 기준을 충족하는 고정밀하고 견고한 지문인식 장치에 집중하고 있으며, 규제가 엄격한 산업 환경, 교통 거점, 공공 인프라 프로젝트에서 장기적으로 도입할 수 있도록 하고 있습니다.
광학식 지문인식 센서 부문은 2025년 7억 7,600만 달러로 도입 실적에서 시장을 주도할 것으로 예측됩니다. 이 센서는 비용 효율성, 신뢰성, 통합 용이성으로 인해 상업용 사무실, 주거 단지, 정부 프로젝트에서 널리 채택되고 있습니다. 광학 센서는 내구성과 검증된 성능으로 인해 특히 대량 도입 시 인기가 높습니다. 기업들은 공공 및 민간 시설의 표준화된 보안 요구 사항을 충족하기 위해 이러한 장치의 경제성과 견고성을 최적화하고 있습니다.
미국의 지문인식 출입통제 시스템 시장은 2025년 8억 2,650만 달러로 평가되었습니다. 미국 내 도입은 국경 관리, 중요 인프라, 정부 시설의 보안 인프라 현대화 및 신원 확인 강화라는 연방 정부의 우선순위에 따라 확대되고 있습니다. 지문인식 시스템은 출입국 관리 및 시설 출입 관리를 포함한 연방 정부의 보안 전략에서 점점 더 핵심적인 역할을 담당하고 있습니다. 제조업체들은 미국 국토안보부 표준 준수를 우선시하며, 연방 정부 및 중요 인프라 프로젝트 전반에 걸쳐 도입을 지원하기 위해 전략적 파트너십을 구축하고 있습니다.
자주 묻는 질문
목차
제1장 조사 방법과 범위
제2장 주요 요약
제3장 업계 인사이트
제4장 경쟁 구도
제5장 시장 추산 및 예측 : 컴포넌트별, 2022-2035
제6장 시장 추산 및 예측 : 센서 유형별, 2022-2035
제7장 시장 추산 및 예측 : 도입 형태별, 2022-2035
제8장 시장 추산 및 예측 : 용도별, 2022-2035
제9장 시장 추산 및 예측 : 최종 이용 산업별, 2022-2035
제10장 시장 추산 및 예측 : 지역별, 2022-2035
제11장 기업 개요
LSH 26.03.16The Global Fingerprint Access Control System Market was valued at USD 3.04 billion in 2025 and is estimated to grow at a CAGR of 10.6% to reach USD 7.35 billion by 2035.
Market expansion is driven by the rising emphasis on security across residential, commercial, and industrial facilities, coupled with the shift from conventional access methods to advanced biometric solutions. Government mandates for secure access in sensitive zones, growing integration of IoT and smart building technologies, and the surge in commercial infrastructure development in emerging economies are further propelling growth. Organizations and authorities are increasingly recognizing that traditional keys, ID badges, or PIN-based systems are prone to duplication and misuse, whereas biometric authentication provides reliable, individualized verification. This transition is fueled by the need to prevent unauthorized entry, enhance accountability, and safeguard critical infrastructure, workplace assets, and sensitive operational areas across both public and private sectors.
| Market Scope | |
|---|---|
| Start Year | 2025 |
| Forecast Year | 2026-2035 |
| Start Value | $3.04 Billion |
| Forecast Value | $7.35 Billion |
| CAGR | 10.6% |
The hardware segment reached USD 1.3 billion in 2025. Deployment of fingerprint scanners, controllers, and readers is expanding across industrial, commercial, and government facilities due to growing security requirements. Government initiatives to modernize security infrastructure are accelerating the adoption of robust hardware for public facilities and critical assets. Manufacturers are focusing on high-accuracy, ruggedized fingerprint devices that meet stringent government and industry security standards, enabling long-term adoption in regulated industrial environments, transportation hubs, and public infrastructure projects.
The optical fingerprint sensors segment accounted for USD 776 million in 2025 and led the market in terms of adoption. These sensors are widely preferred for their cost-effectiveness, reliability, and ease of integration across commercial offices, residential complexes, and government projects. Optical sensors are particularly popular in high-volume deployments due to their durability and proven performance. Companies are optimizing these devices for affordability and robustness to meet standardized security requirements in public and private facilities.
U.S. Fingerprint Access Control System Market was valued at USD 826.5 million in 2025. Adoption in the U.S. is expanding in line with broader federal priorities to modernize security infrastructure and enhance identity verification across border control, critical infrastructure, and government facilities. Fingerprint access systems are increasingly central to federal security strategies, including immigration enforcement and facility access management. Manufacturers are prioritizing compliance with U.S. Department of Homeland Security standards and establishing strategic partnerships to support deployments across federal and critical infrastructure projects.
Prominent players in the Global Fingerprint Access Control System Market include 3M Cogent, Inc., Anviz Global Inc., Aratek Biometrics, Aware, Inc., BioEnable Technologies Pvt. Ltd., Fingerprint Cards AB (Fingerprints), HID Global Corporation, IDEMIA (Morpho), Integrated Biometrics, M2SYS Technology, Mantra Softech (India) Pvt. Ltd., NEC Corporation, Nitgen Co., Ltd., Precise Biometrics AB, Secugen Corporation, Suprema Inc., Thales Group, and ZKTeco Co., Ltd. Companies operating in the Global Fingerprint Access Control System Market are employing several key strategies to strengthen their market position. These include investing in research and development to improve sensor accuracy, speed, and durability; expanding product portfolios with integrated IoT and cloud-based solutions; and forming strategic alliances with government agencies and commercial integrators to secure large-scale contracts. Companies are also focusing on geographic expansion into emerging markets, enhancing after-sales support and maintenance services, and developing customized solutions for specific industries. Strategic mergers and acquisitions are being leveraged to enhance technological capabilities, broaden global reach, and secure long-term supply agreements, reinforcing competitive advantage in a rapidly evolving market.
Table of Contents
Chapter 1 Methodology and Scope
- 1.1 Market scope and definition
- 1.2 Research design
- 1.2.1 Research approach
- 1.2.2 Data collection methods
- 1.3 Data mining sources
- 1.3.1 Global
- 1.3.2 Regional/Country
- 1.4 Base estimates and calculations
- 1.4.1 Base year calculation
- 1.4.2 Key trends for market estimation
- 1.5 Primary research and validation
- 1.5.1 Primary sources
- 1.6 Forecast model
- 1.7 Research assumptions and limitations
Chapter 2 Executive Summary
- 2.1 Industry 360° synopsis
- 2.2 Key market trends
- 2.2.1 Component trends
- 2.2.2 Sensor type trends
- 2.2.3 Deployment type trends
- 2.2.4 Application trends
- 2.2.5 End users trends
- 2.2.6 Regional trends
- 2.3 TAM Analysis, 2026-2035 (USD Million)
- 2.4 CXO perspectives: Strategic imperatives
- 2.4.1 Executive decision points
- 2.4.2 Critical success factors
- 2.5 Future outlook and strategic recommendations
Chapter 3 Industry Insights
- 3.1 Industry ecosystem analysis
- 3.1.1 Supplier landscape
- 3.1.2 Profit margin
- 3.1.3 Cost structure
- 3.1.4 Value addition at each stage
- 3.1.5 Factor affecting the value chain
- 3.1.6 Disruptions
- 3.2 Industry impact forces
- 3.2.1 Growth drivers
- 3.2.1.1 Rising security concerns in residential, commercial, and industrial sectors
- 3.2.1.2 Increasing adoption of biometric solutions over traditional access systems
- 3.2.1.3 Government regulations and mandates for secure access in sensitive areas
- 3.2.1.4 Integration with IoT and smart building technologies
- 3.2.1.5 Expansion of commercial infrastructure in emerging markets
- 3.2.2 Pitfalls and challenges
- 3.2.2.1 High initial investment and installation costs
- 3.2.2.2 Privacy concerns and data protection regulations
- 3.2.1 Growth drivers
- 3.3 Growth potential analysis
- 3.4 Regulatory landscape
- 3.4.1 North America
- 3.4.2 Europe
- 3.4.3 Asia Pacific
- 3.4.4 Latin America
- 3.4.5 Middle East & Africa
- 3.5 Porter’s analysis
- 3.6 PESTEL analysis
- 3.7 Technology and Innovation landscape
- 3.7.1 Current technological trends
- 3.7.2 Emerging technologies
- 3.8 Emerging Business Models
- 3.9 Compliance Requirements
- 3.10 Sustainability Initiatives
- 3.11 Supply Chain Resilience
- 3.12 Geopolitical Analysis
- 3.13 Digital Transformation
Chapter 4 Competitive Landscape, 2025
- 4.1 Introduction
- 4.2 Company market share analysis
- 4.2.1 By region
- 4.2.1.1 North America
- 4.2.1.2 Europe
- 4.2.1.3 Asia Pacific
- 4.2.1.4 Latin America
- 4.2.1.5 Middle East & Africa
- 4.2.2 Market concentration analysis
- 4.2.1 By region
- 4.3 Competitive benchmarking of key players
- 4.3.1 Product portfolio comparison
- 4.3.1.1 Product range breadth
- 4.3.1.2 Technology
- 4.3.1.3 Innovation
- 4.3.2 Geographic presence comparison
- 4.3.2.1 Global footprint analysis
- 4.3.2.2 Service network coverage
- 4.3.2.3 Market penetration by region
- 4.3.3 Competitive positioning matrix
- 4.3.3.1 Leaders
- 4.3.3.2 Challengers
- 4.3.3.3 Followers
- 4.3.3.4 Niche players
- 4.3.4 Strategic outlook matrix
- 4.3.1 Product portfolio comparison
- 4.4 Key developments, 2022-2025
- 4.4.1 Mergers and acquisitions
- 4.4.2 Partnerships and collaborations
- 4.4.3 Technological advancements
- 4.4.4 Expansion and investment strategies
- 4.4.5 Sustainability initiatives
- 4.4.6 Digital transformation initiatives
- 4.5 Emerging/ startup competitors landscape
Chapter 5 Market Estimates and Forecast, By Component, 2022 - 2035 (USD Million)
- 5.1 Key trends
- 5.2 Hardware
- 5.2.1 Readers/scanners
- 5.2.2 Fingerprint terminals
- 5.2.3 Door locks & controllers
- 5.3 Software
- 5.3.1 Algorithm engine
- 5.3.2 Access control management software
- 5.3.3 Time & attendance
- 5.4 Services
- 5.4.1 Installation
- 5.4.2 Integration
- 5.4.3 Maintenance/support
Chapter 6 Market Estimates and Forecast, By Sensor Type, 2022 - 2035 (USD Million)
- 6.1 Key trends
- 6.2 Optical
- 6.3 Capacitive
- 6.4 Ultrasonic
- 6.5 Thermal
- 6.6 Multispectral
- 6.7 Other
Chapter 7 Market Estimates and Forecast, By Deployment Type, 2022 - 2035 (USD Million)
- 7.1 Key trends
- 7.2 On-premise systems
- 7.3 Cloud-managed systems
- 7.4 Hybrid systems
Chapter 8 Market Estimates and Forecast, By Application, 2022 - 2035 (USD Million)
- 8.1 Key Trends
- 8.2 Door access control
- 8.3 Restricted facility access
- 8.4 Workforce attendance tracking
- 8.5 Visitor management
Chapter 9 Market Estimates and Forecast, By End-use Industry, 2022 - 2035 (USD Million)
- 9.1 Key trends
- 9.2 Commercial
- 9.3 Residential
- 9.4 Industrial/manufacturing
- 9.5 Government & defense
- 9.6 Healthcare
- 9.7 Education
- 9.8 Hospitality & retail
- 9.9 Others
Chapter 10 Market Estimates and Forecast, By Region, 2022 - 2035 (USD Million)
- 10.1 Key trends
- 10.2 North America
- 10.2.1 U.S.
- 10.2.2 Canada
- 10.3 Europe
- 10.3.1 Germany
- 10.3.2 UK
- 10.3.3 France
- 10.3.4 Spain
- 10.3.5 Italy
- 10.3.6 Netherlands
- 10.4 Asia Pacific
- 10.4.1 China
- 10.4.2 India
- 10.4.3 Japan
- 10.4.4 Australia
- 10.4.5 South Korea
- 10.5 Latin America
- 10.5.1 Brazil
- 10.5.2 Mexico
- 10.5.3 Argentina
- 10.6 Middle East and Africa
- 10.6.1 Saudi Arabia
- 10.6.2 South Africa
- 10.6.3 UAE
Chapter 11 Company Profiles
- 11.1 Global Key Players
- 11.1.1 HID Global Corporation
- 11.1.2 IDEMIA (Morpho)
- 11.1.3 Thales Group
- 11.1.4 NEC Corporation
- 11.1.5 Suprema Inc.
- 11.2 Regional Key Players
- 11.2.1 North America
- 11.2.1.1 3M Cogent, Inc.
- 11.2.1.2 Aware, Inc.
- 11.2.1.3 Integrated Biometrics
- 11.2.1.4 Secugen Corporation
- 11.2.1.5 M2SYS Technology
- 11.2.2 Europe
- 11.2.2.1 Fingerprint Cards AB
- 11.2.2.2 Precise Biometrics AB
- 11.2.3 Asia Pacific
- 11.2.3.1 Anviz Global Inc.
- 11.2.3.2 Aratek Biometrics
- 11.2.3.3 BioEnable Technologies Pvt. Ltd.
- 11.2.3.4 Mantra Softech (India) Pvt. Ltd.
- 11.2.1 North America
- 11.3 Niche / Disruptors
- 11.3.1 Nitgen Co., Ltd.
- 11.3.2 ZKTeco Co., Ltd.
