


|
시장보고서
상품코드
2019069
선박용 차트플로터 시장 기회, 성장 촉진요인, 업계 동향 분석 및 예측(2026-2035년)Marine Chartplotter Market Opportunity, Growth Drivers, Industry Trend Analysis, and Forecast 2026 - 2035 |
||||||
세계의 선박용 차트플로터 시장은 2025년에 9억 6,350만 달러로 평가되었으며, CAGR 3.6%로 성장하여 2035년까지 13억 7,000만 달러에 달할 것으로 추정됩니다.
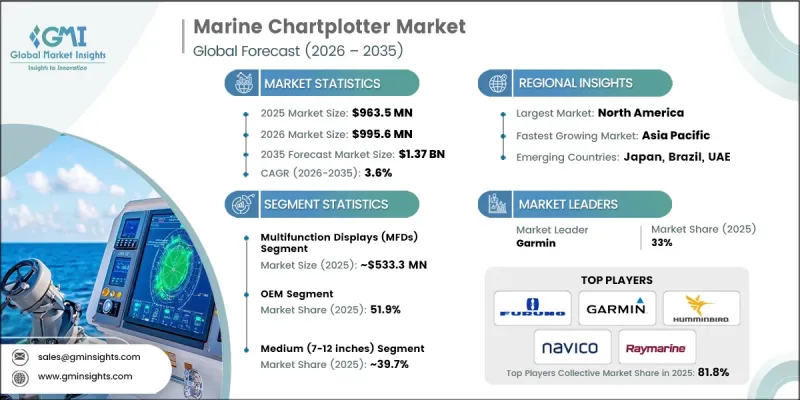
세계 선박용 차트플로터 시장은 조선 활동의 활성화가 선내 항해 장비의 수요를 견인하기 때문에 선박 생산 동향에 큰 영향을 받고 있습니다. 이러한 시스템은 정확한 위치 측정과 항로 최적화를 지원하는 데 매우 중요한 역할을 하며, 상업용 및 레저용 선박 모두에서 필수적인 요소로 자리 잡았습니다. 첨단 디스플레이 기술과 연결성 향상을 위한 투자 확대가 차트플로터의 진화를 주도하고 있습니다. 또한, 규제 프레임워크는 전자 항법 시스템의 도입을 촉진하고 디지털 도구의 일관된 업그레이드와 장기적인 도입을 지원하고 있습니다. 해상 운항이 데이터 기반 항해에 대한 의존도가 높아짐에 따라, 차트플로터는 보다 광범위한 선내 시스템에 통합되어 원활한 항해 경험을 지원하면서 운항 효율성과 안전성을 향상시키고 있습니다.
| 시장 범위 | |
|---|---|
| 시작 연도 | 2025년 |
| 예측 기간 | 2026-2035년 |
| 시작 시점 시장 규모 | 9억 6,350만 달러 |
| 예측 규모 | 13억 7,000만 달러 |
| CAGR | 3.6% |
선박용 차트플로터 시장도 사용 편의성과 시스템 통합성을 높이는 지속적인 기술 혁신을 통해 발전하고 있습니다. 최신 기기들은 고해상도 인터페이스, 무선 연결 기능, 선내 통신 네트워크와의 호환성을 갖추고 있습니다. 이러한 시스템은 원활한 데이터 교환을 가능하게 하고, 원격 업데이트 및 여러 선상 데이터 소스와의 통합과 같은 고급 기능을 지원합니다. 상업적 운항자는 항해 정확도를 유지하고 규제 요건을 충족하기 위해 이러한 기술에 의존하고 있으며, 레크리에이션 사용자들은 직관적인 인터페이스와 실시간 정보에 점점 더 매력을 느끼고 있습니다. 항해 기능과 다른 기능을 결합한 다기능 시스템의 인기가 높아지면서 시장 확대에 더욱 기여하고 있습니다.
2025년 다기능 디스플레이 부문은 55.3%의 점유율을 차지하며 5억 3,330만 달러의 시장 규모를 창출했습니다. 이 부문이 시장을 주도하는 이유는 여러 기능을 하나의 인터페이스에 통합한 통합 내비게이션 솔루션에 대한 수요가 증가하고 있기 때문입니다. 이러한 시스템은 다양한 운영 정보를 통합된 디스플레이로 통합하여 개별 계측기의 필요성을 줄이고 효율성을 향상시킵니다. 또한, 선내 통신 네트워크 및 통합 시스템 아키텍처와의 호환성을 통해 현대 선박에서의 도입을 더욱 촉진하고 있습니다.
7-12인치 범위의 중형 부문은 2025년 39.7%의 점유율을 차지했으며, 2026년부터 2035년까지 연평균 4.5%의 가장 높은 성장률로 확대될 것으로 예상됩니다. 이 장치들은 디스플레이의 선명도와 공간 효율성의 균형이 잘 잡혀 있어 널리 선호되고 있습니다. 표준 제어 설정에 적합한 컴팩트한 크기를 유지하면서 데이터를 명확하게 시각화할 수 있는 충분한 화면 영역을 제공합니다. 여러 데이터 뷰를 동시에 표시할 수 있는 기능으로 사용 편의성이 향상되어 다양한 해양 응용 분야에서 실용적인 선택이 될 수 있습니다.
미국의 선박용 차트플로터 시장은 2025년에 2억 6,940만 달러에 달했으며, 2035년까지 연평균 3.9%의 CAGR로 성장할 것으로 예상됩니다. 이 나라는 활발한 해상 활동과 항해 기술에 대한 지속적인 투자에 힘입어 주요 시장으로 부상하고 있습니다. 디지털 항법 시스템을 지원하는 규제 프레임워크가 첨단 차트플로터 솔루션의 보급을 촉진하고 있습니다. 또한, 해상 안전과 운항 효율성 향상에 초점을 맞춘 지속적인 노력도 수요 증가에 기여하고 있습니다. 디지털 항해 도구가 해상 운영에 통합되면서 이 지역 전체에서 선박용 차트플로터 시장의 성장을 촉진하고 있습니다.
자주 묻는 질문
목차
제1장 조사 방법
제2장 주요 요약
제3장 업계 인사이트
제4장 경쟁 구도
제5장 시장 추정 및 예측 : 구성요소별, 2022-2035
제6장 시장 추정 및 예측 : 모듈별, 2022-2035
제7장 시장 추정 및 예측 : 차량별, 2022-2035
제8장 시장 추정 및 예측 : 판매 채널별, 2022-2035
제9장 시장 추정 및 예측 : 용도별, 2022-2035
제10장 시장 추정 및 예측 : 지역별, 2022-2035
제11장 기업 개요
KSM 26.05.06The Global Marine Chartplotter Market was valued at USD 963.5 million in 2025 and is estimated to grow at a CAGR of 3.6% to reach USD 1.37 billion by 2035.

The global marine chartplotter market is closely influenced by trends in vessel production, as increased shipbuilding activity drives demand for onboard navigation equipment. These systems play a critical role in supporting accurate positioning and route optimization, making them indispensable across both commercial and recreational marine applications. Growing investments in advanced display technologies and enhanced connectivity are shaping the evolution of chartplotters. In addition, regulatory frameworks are encouraging the adoption of electronic navigation systems, supporting consistent upgrades and long-term deployment of digital tools. As maritime operations become more reliant on data-driven navigation, chartplotters are increasingly integrated into broader onboard systems, improving operational efficiency and safety while supporting seamless navigation experiences.
| Market Scope | |
|---|---|
| Start Year | 2025 |
| Forecast Year | 2026-2035 |
| Start Value | $963.5 Million |
| Forecast Value | $1.37 Billion |
| CAGR | 3.6% |
The marine chartplotter market is also advancing through continuous technological improvements that enhance usability and system integration. Modern devices feature high-resolution interfaces, wireless connectivity, and compatibility with onboard communication networks. These systems enable seamless data exchange and support advanced functionalities, including remote updates and integration with multiple onboard data sources. Commercial operators rely on these technologies to maintain navigation accuracy and meet regulatory requirements, while recreational users are increasingly drawn to intuitive interfaces and real-time information. The growing popularity of multifunction systems that combine navigation with additional capabilities is further contributing to market expansion.
In 2025, the multifunction displays segment accounted for 55.3% share, generating USD 533.3 million. This segment leads the market due to the increasing preference for integrated navigation solutions that consolidate multiple functions into a single interface. These systems combine various operational inputs into a unified display, reducing the need for separate instruments and improving efficiency. Their compatibility with onboard communication networks and integrated system architectures has further strengthened their adoption across modern vessels.
The medium-sized segment, ranging from 7 to 12 inches, held a 39.7% share in 2025 and is expected to grow at the fastest CAGR of 4.5% between 2026 and 2035. These devices are widely preferred due to their balanced combination of display clarity and space efficiency. They provide sufficient screen area for clear data visualization while maintaining compact dimensions suitable for standard control setups. Their ability to support multiple data views simultaneously enhances usability, making them a practical choice for a wide range of marine applications.
United States Marine Chartplotter Market reached USD 269.4 million in 2025 and is expected to grow at a CAGR of 3.9% through 2035. The country represents a key market driven by strong maritime activity and continuous investment in navigation technologies. Regulatory frameworks supporting digital navigation systems are encouraging widespread adoption of advanced chartplotting solutions. Ongoing initiatives focused on improving maritime safety and operational efficiency are also contributing to increased demand. The integration of digital navigation tools into maritime operations is reinforcing the growth of the marine chartplotter market across the region.
Key companies operating in the Global Marine Chartplotter Market include Furuno Electric, Garmin, Humminbird, Japan Radio, Koden Electronics, Navico, Raymarine, Samyung, SI-TEX Marine, and Standard Horizon (Yaesu). Companies in the Marine Chartplotter Market are strengthening their competitive position through innovation, product integration, and strategic expansion. They are investing in advanced display technologies, enhanced connectivity, and software-driven navigation features to improve user experience and operational efficiency. Partnerships with vessel manufacturers and marine system integrators are enabling deeper integration of chartplotters into onboard systems. Companies are also focusing on expanding their global presence through distribution networks and localized support services. Additionally, continuous upgrades in user interface design, real-time data processing, and compatibility with evolving marine communication standards help companies differentiate their offerings and maintain a strong foothold in a competitive market.
Table of Contents
Chapter 1 Methodology
- 1.1 Research approach
- 1.2 Quality commitments
- 1.3 Research trail and confidence scoring
- 1.3.1 Research trail components
- 1.3.2 Scoring components
- 1.4 Data collection
- 1.4.1 Partial list of primary sources
- 1.5 Data mining sources
- 1.5.1 Paid sources
- 1.6 Best estimates and calculations
- 1.6.1 Base year calculation for any one approach
- 1.7 Forecast model
- 1.8 Research transparency addendum
Chapter 2 Executive Summary
- 2.1 Industry 360° synopsis, 2022 - 2035
- 2.2 Key market trends
- 2.2.1 Regional
- 2.2.2 Component
- 2.2.3 Module
- 2.2.4 Vehicle
- 2.2.5 Sales Channel
- 2.2.6 Application
- 2.3 TAM Analysis, 2026-2035
- 2.4 CXO perspectives: Strategic imperatives
Chapter 3 Industry Insights
- 3.1 Industry ecosystem analysis
- 3.1.1 Supplier landscape
- 3.1.2 Profit margin analysis
- 3.1.3 Cost structure
- 3.1.4 Value addition at each stage
- 3.1.5 Factor affecting the value chain
- 3.1.6 Disruptions
- 3.2 Industry impact forces
- 3.2.1 Growth drivers
- 3.2.1.1 Rapid electrification of vehicle fleets and transition to EVs/HEVs
- 3.2.1.2 Increasing electronic content in modern vehicles (ADAS, infotainment, connectivity)
- 3.2.1.3 Adoption of zone architecture and smart power distribution solutions
- 3.2.1.4 Stringent emission regulations driving high-voltage system integration
- 3.2.1.5 Consumer demand for advanced safety and comfort features
- 3.2.2 Industry pitfalls and challenges
- 3.2.2.1 High cost of advanced power distribution modules
- 3.2.2.2 Complexity in design & integration of multi-voltage systems
- 3.2.2.3 Semiconductor supply chain disruptions & component shortages
- 3.2.2.4 Thermal management challenges in compact vehicle spaces
- 3.2.3 Market opportunities
- 3.2.3.1 Expansion of 48V mild hybrid systems in passenger vehicles
- 3.2.3.2 Retrofitting aftermarket smart PDM solutions
- 3.2.3.3 Emerging markets automotive production growth
- 3.2.3.4 Integration with vehicle-to-grid (V2G) infrastructure
- 3.2.3.5 Development of modular & scalable PDM platforms
- 3.2.1 Growth drivers
- 3.3 Growth potential analysis
- 3.4 Regulatory landscape
- 3.4.1 North America
- 3.4.1.1 US- EPA GHG phase 3 & CAFE standards
- 3.4.1.2 Canada - Emissions-based regulatory framework
- 3.4.2 Europe
- 3.4.2.1 Germany- Euro 7 Emission Standards
- 3.4.2.2 UK- Post-brexit vehicle type approval
- 3.4.2.3 France- Decarbonization roadmap
- 3.4.2.4 Italy- Low-Emission zone compliance
- 3.4.3 Asia Pacific
- 3.4.3.1 China- China VI-b & Emerging China VII standards
- 3.4.3.2 India- BS-VI Stage II & bharat stage VII transition
- 3.4.3.3 Japan- Fuel efficiency standards (2030 Targets)
- 3.4.3.4 Australia- Fuel quality & ADR 79/05 standards
- 3.4.4 LATAM
- 3.4.4.1 Mexico- NOM-194-SE-2021 & USMCA rules of origin
- 3.4.4.2 Argentina- Law 24.449 & environmental amendments
- 3.4.5 MEA
- 3.4.5.1 South Africa- National road traffic act (1996)
- 3.4.5.2 Saudi Arabia- Traffic law & vision 2030 transport initiatives
- 3.4.1 North America
- 3.5 Porter's analysis
- 3.6 PESTEL analysis
- 3.7 Technology and innovation landscape
- 3.7.1 Current technological trends
- 3.7.2 Emerging technologies
- 3.8 Patent landscape (driven by primary research)
- 3.9 Pricing analysis (Driven by Primary Research)
- 3.9.1 Historical price trend analysis
- 3.9.2 Pricing strategy by player type (premium / value / cost-plus)
- 3.9.3 Total cost of ownership (TCO) analysis
- 3.10 Trade data analysis (driven by paid database)
- 3.10.1 Import/export volume & value trends
- 3.10.2 Key trade corridors & tariff impact
- 3.11 Use cases & success stories
- 3.12 Impact of AI & generative AI on the market
- 3.12.1 AI-driven disruption of existing business models
- 3.12.2 GenAI use cases & adoption roadmap by segment
- 3.12.3 Risks, limitations & regulatory considerations
- 3.13 Capacity & production landscape (driven by primary research)
- 3.13.1 Installed capacity by region & key producer
- 3.13.2 Capacity utilization rates & expansion pipelines
- 3.14 Sustainability and environmental aspects
- 3.14.1 Sustainable practices
- 3.14.2 Waste reduction strategies
- 3.14.3 Energy efficiency in production
- 3.14.4 Eco-friendly Initiatives
- 3.14.5 Carbon footprint considerations
- 3.15 Forecast assumptions & scenario analysis (Driven by primary research)
- 3.15.1 Base Case - key macro & industry variables driving CAGR
- 3.15.2 Optimistic Scenarios - Favorable macro and industry tailwinds
- 3.15.3 Pessimistic Scenario - Macroeconomic slowdown or industry headwinds
Chapter 4 Competitive Landscape, 2025
- 4.1 Introduction
- 4.2 Company market share analysis
- 4.2.1 North America
- 4.2.2 Europe
- 4.2.3 Asia Pacific
- 4.2.4 LATAM
- 4.2.5 MEA
- 4.3 Competitive analysis of major market players
- 4.4 Competitive positioning matrix
- 4.5 Company Tier Benchmarking
- 4.5.1 Tier Classification Criteria & Qualifying Thresholds
- 4.5.2 Tier Positioning Matrix by Revenue, Geography & Innovation
- 4.6 Key developments
- 4.6.1 Mergers & acquisitions
- 4.6.2 Partnerships & collaborations
- 4.6.3 New product launches
- 4.6.4 Expansion plans and funding
Chapter 5 Market Estimates & Forecast, By Component, 2022 - 2035 ($Bn, Units)
- 5.1 Key trends
- 5.2 Power modules
- 5.3 Fuses and circuit breakers
- 5.4 Connectors and terminals
- 5.5 Relays
- 5.6 Voltage regulators
- 5.7 Others
Chapter 6 Market Estimates & Forecast, By Module, 2022 - 2035 ($Bn, Units)
- 6.1 Key trends
- 6.2 Low voltage
- 6.3 Medium voltage
- 6.4 High voltage
Chapter 7 Market Estimates & Forecast, By Vehicle, 2022 - 2035 ($Bn, Units)
- 7.1 Key trends
- 7.2 Passenger cars
- 7.2.1 Hatchback
- 7.2.2 Sedan
- 7.2.3 SUV
- 7.3 Commercial vehicles
- 7.3.1 Light commercial vehicles (LCVs)
- 7.3.2 Medium commercial vehicles (MCVs)
- 7.3.3 Heavy commercial vehicles (HCVs)
Chapter 8 Market Estimates & Forecast, By Sales Channel, 2022 - 2035 ($Bn, Units)
- 8.1 Key trends
- 8.2 OEM
- 8.3 Aftermarket
Chapter 9 Market Estimates & Forecast, By Application, 2022 - 2035 ($Bn, Units)
- 9.1 Key trends
- 9.2 Lighting systems
- 9.3 Infotainment systems
- 9.4 HVAC systems
- 9.5 Safety and driver assistance systems
- 9.6 Powertrain systems
- 9.7 Battery management systems
- 9.8 Others
Chapter 10 Market Estimates & Forecast, By Region, 2022 - 2035 ($Bn, Units)
- 10.1 Key trends
- 10.2 North America
- 10.2.1 US
- 10.2.2 Canada
- 10.3 Europe
- 10.3.1 Germany
- 10.3.2 UK
- 10.3.3 France
- 10.3.4 Italy
- 10.3.5 Spain
- 10.3.6 Russia
- 10.3.7 Netherlands
- 10.3.8 Sweden
- 10.3.9 Denmark
- 10.3.10 Poland
- 10.4 Asia Pacific
- 10.4.1 China
- 10.4.2 India
- 10.4.3 Japan
- 10.4.4 Australia
- 10.4.5 South Korea
- 10.4.6 Singapore
- 10.4.7 Thailand
- 10.4.8 Indonesia
- 10.4.9 Vietnam
- 10.5 Latin America
- 10.5.1 Brazil
- 10.5.2 Mexico
- 10.5.3 Argentina
- 10.5.4 Colombia
- 10.6 MEA
- 10.6.1 South Africa
- 10.6.2 Saudi Arabia
- 10.6.3 UAE
- 10.6.4 Israel
Chapter 11 Company Profiles
- 11.1 Global Players
- 11.1.1 Aptiv
- 11.1.2 Continental
- 11.1.3 Denso
- 11.1.4 Eaton
- 11.1.5 Hitachi Astemo
- 11.1.6 Lear
- 11.1.7 Mitsubishi Electric
- 11.1.8 Robert Bosch
- 11.1.9 TE Connectivity
- 11.1.10 Valeo
- 11.2 Regional Players
- 11.2.1 DRAXLMAIER
- 11.2.2 Furukawa Electric
- 11.2.3 Leoni
- 11.2.4 Panasonic Automotive Systems
- 11.2.5 Sumitomo Electric Industries
- 11.2.6 Yazaki
- 11.3 Emerging Players
- 11.3.1 Infineon Technologies
- 11.3.2 NXP Semiconductors
- 11.3.3 onsemi (ON Semiconductor)
- 11.3.4 STMicroelectronics
