
|
시장보고서
상품코드
2027601
액랭식 EV 충전 케이블 : 시장 기회, 성장 촉진요인, 업계 동향 분석 및 예측(2026-2035년)Liquid-Cooled EV Charging Cable Market Opportunity, Growth Drivers, Industry Trend Analysis, and Forecast 2026 - 2035 |
||||||
세계의 액랭식 EV 충전 케이블 시장은 2025년에 5억 8,240만 달러로 평가되었고 CAGR 13%를 나타내 2035년까지 19억 달러에 이를 것으로 추정되고 있습니다.
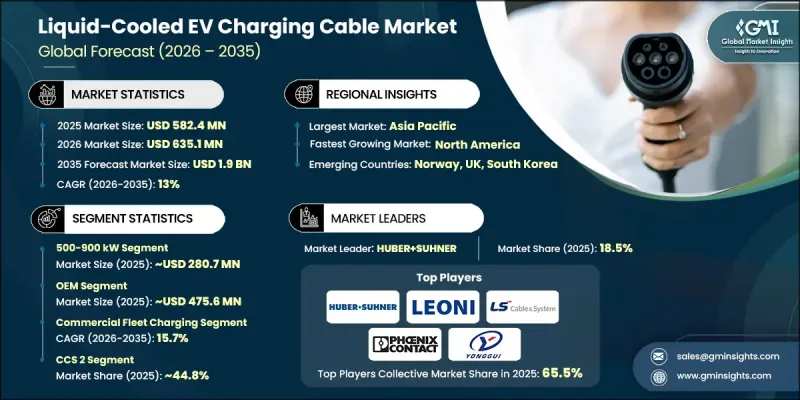
시장 확대는 전기차 보급 가속화와 초급속 충전 기능에 대한 수요 증가에 의해 주도되고 있습니다. 충전 기술이 고출력을 지향함에 따라, 큰 전기 부하에 대응할 수 있는 고급 케이블 시스템에 대한 요구가 점점 더 커지고 있습니다. 액랭식 케이블은 이러한 고출력 레벨에 대응하도록 설계되어 고속 충전 시에도 효율성과 안전성, 안정적인 성능을 보장합니다. 대용량 충전 인프라의 도입 확대가 수요를 견인하고 있으며, 특히 차세대 충전 시스템이 충전 시간의 대폭적인 단축을 목표로 하고 있는 것이 그 요인으로 작용하고 있습니다. 이와 함께, 지원적인 규제 프레임워크와 정책 이니셔티브가 첨단 EV 인프라 개발을 촉진하고 있습니다. 고전압 차량 아키텍처로의 전환은 열적 안정성을 유지하면서 더 빠른 에너지 전송을 가능하게 하기 때문에 이러한 케이블의 중요성을 더욱 높이고 있습니다. 또한, 승용차 및 상용차 부문의 전동화 확대는 고성능 충전 솔루션에 대한 지속적인 수요를 창출하고 있으며, 액랭식 케이블 기술은 미래 지향적인 EV 생태계의 중요한 구성 요소로 자리매김하고 있습니다.
| 시장 범위 | |
|---|---|
| 시작 연도 | 2025년 |
| 예측 기간 | 2026-2035년 |
| 개시 연도 시장 규모 | 5억 8,240만 달러 |
| 예측액 | 19억 달러 |
| CAGR | 13% |
500-900kW 부문은 48.2%의 점유율을 차지하며 2025년 2억 8,070만 달러 시장 규모를 창출했씁니다. 이 부문은 더 큰 배터리 시스템을 장착한 첨단 전기자동차의 에너지 수요를 충족시킬 수 있는 대용량 충전 시스템에 대한 수요 증가에 힘입어 예측 기간 동안 가장 빠른 성장을 나타낼 것으로 예측됩니다. 충전 시간 단축에 대한 관심이 높아지면서 고출력 충전 인프라의 도입이 가속화되고 있으며, 이 과정에서 액체 냉각 케이블은 열 관리 및 운영 효율성 유지에 매우 중요한 역할을 하고 있습니다. 전기자동차의 보급이 증가함에 따라 급속 충전의 요구 사항을 충족시킬 수 있기 때문에 이 부문은 전체 시장 성장의 주요 견인차 역할을 할 것으로 예측됩니다.
OEM 부문은 2025년 81.7%의 점유율을 차지하며 4억 7,560만 달러 시장 규모를 창출했습니다. 이러한 우위는 주로 OEM이 자사 차량 플랫폼에 맞는 호환 가능한 충전 솔루션을 설계하고 제공하는 데 있어 필수적인 역할을 하고 있기 때문입니다. 이들 제조업체는 최적의 성능과 사용자 편의성을 보장하기 위해 첨단 충전 기술을 적극적으로 통합하고 있습니다. 고출력 충전을 효율적으로 지원할 수 있기 때문에 이러한 시스템에는 액랭식 케이블이 점점 더 많이 채택되고 있습니다. 고성능 전기차에 대한 수요가 지속적으로 증가함에 따라 OEM 업체들은 차량 개발과 충전 인프라의 연계를 더욱 중요시하고 있으며, 이를 통해 시장 내 영향력을 강화하고 있습니다.
미국의 액랭식 EV 충전 케이블 시장은 2025년에 1억 1,330만 달러로 평가되었고, 2026년부터 2035년까지 연평균 14% 성장할 것으로 예측됩니다. 미국에서의 성장은 전기차 보급 촉진과 충전 인프라 확충에 초점을 맞춘 강력한 정책 환경으로 뒷받침되고 있습니다. 급속 충전 네트워크 구축을 위한 투자가 시장 발전에 크게 기여하고 있습니다. 무공해 모빌리티로의 전환이 진행되고 전기자동차 생산이 확대됨에 따라 첨단 충전 솔루션에 대한 수요가 더욱 증가하고 있습니다. 또한, 상용차량의 전동화가 진행됨에 따라 빠르고 효율적인 충전이 가능한 고성능 케이블에 대한 수요가 크게 증가하고 있으며, 미국은 액랭식 전기차 충전 기술의 주요 시장으로서 입지를 강화하고 있습니다.
자주 묻는 질문
목차
제1장 조사 방법
제2장 주요 요약
제3장 업계 인사이트
제4장 경쟁 구도
제5장 시장 추산 및 예측 : 케이블 전력 용량별(2022-2035년)
제6장 시장 추산 및 예측 : 케이블 길이별(2022-2035년)
제7장 시장 추산 및 예측 : 케이블 지름별(2022-2035년)
제8장 시장 추산 및 예측 : 도체 재료별(2022-2035년)
제9장 시장 추산 및 예측 : 커넥터별(2022-2035년)
제10장 시장 추산 및 예측 : 용도별(2022-2035년)
제11장 시장 추산 및 예측 : 판매 채널별(2022-2035년)
제12장 시장 추산 및 예측 : 지역별(2022-2035년)
제13장 기업 개요
KTH 26.05.20The Global Liquid-Cooled EV Charging Cable Market was valued at USD 582.4 million in 2025 and is estimated to grow at a CAGR of 13% to reach USD 1.9 billion by 2035.

Market expansion is fueled by the accelerating adoption of electric vehicles and the rising requirement for ultra-fast charging capabilities. As charging technologies evolve toward higher power outputs, the need for advanced cable systems capable of handling substantial electrical loads continues to intensify. Liquid-cooled cables are engineered to support these elevated power levels, ensuring efficiency, safety, and consistent performance during high-speed charging sessions. Increasing deployment of high-capacity charging infrastructure is reinforcing demand, particularly as next-generation charging systems aim to significantly reduce charging times. In parallel, supportive regulatory frameworks and policy initiatives are encouraging the development of advanced EV infrastructure. The transition toward high-voltage vehicle architectures is further amplifying the importance of these cables, as they enable faster energy transfer while maintaining thermal stability. Additionally, the expansion of electrified transportation across passenger and commercial segments is creating sustained demand for high-performance charging solutions, positioning liquid-cooled cable technology as a critical component of future-ready EV ecosystems.
| Market Scope | |
|---|---|
| Start Year | 2025 |
| Forecast Year | 2026-2035 |
| Start Value | $582.4 Million |
| Forecast Value | $1.9 Billion |
| CAGR | 13% |
The 500-900 kW segment held a 48.2% share, generating USD 280.7 million in 2025. This segment is also projected to witness the fastest growth over the forecast period, supported by the increasing demand for high-capacity charging systems capable of meeting the energy needs of advanced electric vehicles equipped with larger battery systems. The growing emphasis on reducing charging duration has accelerated the deployment of high-power charging infrastructure, where liquid-cooled cables play a crucial role in managing heat and maintaining operational efficiency. As the electric vehicle landscape continues to expand, this segment is expected to remain a key contributor to overall market growth due to its ability to support rapid charging requirements.
The OEM segment accounted for 81.7% share in 2025 generating USD 475.6 million. Its dominance is primarily driven by the integral role of original equipment manufacturers in designing and delivering compatible charging solutions tailored to their vehicle platforms. These manufacturers are actively integrating advanced charging technologies to ensure optimal performance and user convenience. Liquid-cooled cables are increasingly being incorporated into these systems due to their capability to support high-power charging efficiently. As demand for high-performance electric vehicles continues to rise, OEMs are placing greater emphasis on aligning vehicle development with charging infrastructure, thereby strengthening their influence within the market.
U.S. Liquid-Cooled EV Charging Cable Market was valued at USD 113.3 million in 2025 and is anticipated to grow at a CAGR of 14% from 2026 to 2035. Growth in the United States is being supported by a strong policy environment focused on accelerating electric vehicle adoption and expanding charging infrastructure. Investments aimed at deploying high-speed charging networks are contributing significantly to market development. The increasing shift toward zero-emission mobility, along with the scaling production of electric vehicles, is further boosting the need for advanced charging solutions. Additionally, the rising electrification of commercial fleets is creating substantial demand for high-performance cables capable of supporting fast and efficient charging, reinforcing the country's position as a key market for liquid-cooled EV charging technologies.
Key companies operating in the Global Liquid-Cooled EV Charging Cable Market include ABB, Amphenol Energy, BRUGG eConnect, HUBER+SUHNER, LEONI, LS Cable & System, MIDA Power, Phoenix Contact, Sinbon Electronics, and Zhejiang Yonggui. Companies in the Global Liquid-Cooled EV Charging Cable Market are focusing on innovation, strategic partnerships, and infrastructure expansion to strengthen their market position. They are investing in advanced cooling technologies and high-performance materials to enhance cable efficiency and durability under extreme power conditions. Collaborations with automotive manufacturers and charging network providers are helping firms expand their reach and ensure compatibility with next-generation EV platforms. Many players are also scaling production capabilities to meet growing global demand while optimizing supply chains for cost efficiency. In addition, companies are targeting new geographic markets and aligning their offerings with evolving regulatory standards. Continuous research and development efforts, along with customization of solutions for specific applications, are enabling firms to differentiate themselves and maintain a competitive edge.
Table of Contents
Chapter 1 Methodology
- 1.1 Research approach
- 1.2 Quality Commitments
- 1.2.1 GMI AI policy & data integrity commitment
- 1.3 Research Trail & Confidence Scoring
- 1.3.1 Research Trail Components
- 1.3.2 Scoring Components
- 1.4 Data Collection
- 1.5 Data mining sources
- 1.5.1 Paid sources
- 1.6 Base estimates and calculations
- 1.6.1 Base year calculation for any one approach
- 1.7 Forecast
- 1.7.1 Quantified market impact analysis
- 1.8 Research transparency addendum
- 1.8.1 Source attribution framework
- 1.8.2 Quality assurance metrics
- 1.8.3 Our commitment to trust
Chapter 2 Executive Summary
- 2.1 Industry 360° synopsis
- 2.2 Key market trends
- 2.2.1 Regional
- 2.2.2 Cable power capacity
- 2.2.3 Cable length
- 2.2.4 Cable diameter
- 2.2.5 Conductor material
- 2.2.6 Connector
- 2.2.7 Application
- 2.2.8 Sales Channel
- 2.3 TAM analysis, 2026-2035
- 2.4 CXO perspectives: Strategic imperatives
Chapter 3 Industry Insights
- 3.1 Industry ecosystem analysis
- 3.1.1 Supplier landscape
- 3.1.2 Profit margin
- 3.1.3 Cost structure
- 3.1.4 Value addition at each stage
- 3.1.5 Factor affecting the value chain
- 3.1.6 Disruptions
- 3.2 Industry impact forces
- 3.2.1 Growth drivers
- 3.2.1.1 Rising demand for ultrafast & megawatt charging infrastructure
- 3.2.1.2 Growing adoption of 800V EV platform architectures
- 3.2.1.3 Need for enhanced thermal management in high-power charging
- 3.2.1.4 Government mandates & incentives for EV charging infrastructure development
- 3.2.2 Industry pitfalls and challenges
- 3.2.2.1 System complexity & specialized maintenance requirements
- 3.2.2.2 Coolant leak risks & environmental concerns
- 3.2.3 Market opportunities
- 3.2.3.1 Retrofit & upgrade market for existing charging stations
- 3.2.3.2 Increasing heavy-duty truck & commercial fleet electrification
- 3.2.3.3 Megawatt Charging System (MCS) development for long-haul transport
- 3.2.1 Growth drivers
- 3.3 Growth potential analysis
- 3.4 Regulatory landscape
- 3.4.1 North America
- 3.4.1.1 US - SAE J3400
- 3.4.1.2 US - J1772
- 3.4.1.3 US - NEVI Program Requirements
- 3.4.2 Europe
- 3.4.2.1 European Union - EU TEN-T Regulations
- 3.4.2.2 European Union - CCS Mandates
- 3.4.3 Asia Pacific
- 3.4.3.1 Japan - CHAdeMO 3.0
- 3.4.3.2 China - GB/T
- 3.4.4 Latin America
- 3.4.4.1 Brazil - ANEEL EV Charging Regulatory Framework
- 3.4.4.2 Mexico - EVSE Deployment Initiatives
- 3.4.5 Middle East & Africa
- 3.4.5.1 UAE - National Electric Vehicle Policy
- 3.4.5.2 UAE - Dubai/Abu Dhabi EV Charging Network Regulations
- 3.4.1 North America
- 3.5 Investment & funding analysis
- 3.6 Porter’s analysis
- 3.7 PESTEL analysis
- 3.8 Technology and innovation landscape
- 3.8.1 Current technologies
- 3.8.1.1 800V High-Voltage EV Platforms
- 3.8.1.2 Megawatt Charging Systems (MCS)
- 3.8.1.3 Advanced Thermal Management Systems
- 3.8.2 Emerging technologies
- 3.8.2.1 Dielectric Coolant-Based Charging Cables
- 3.8.2.2 Ultra-Fast Heavy-Duty Truck Charging Solutions
- 3.8.1 Current technologies
- 3.9 Pricing Analysis (Driven by Primary Research)
- 3.9.1 Historical Price Trend Analysis
- 3.9.2 Pricing Strategy by Player Type (Premium / Value / Cost-plus)
- 3.10 Patent landscape (Driven by Primary Research)
- 3.11 Use case analysis
- 3.12 Pricing analysis (Driven by Primary Research)
- 3.12.1 Historical price trend analysis
- 3.12.2 Pricing strategy by player type (Premium / Value / Cost-plus)
- 3.13 Trade data analysis (Driven by Paid Database)
- 3.13.1 Import/export volume & value trends
- 3.13.2 Key trade corridors & tariff impact
- 3.14 Patent landscape (Driven by Primary Research)
- 3.15 Cost breakdown analysis
- 3.16 Capacity & Production Landscape (Driven by Primary Research)
- 3.16.1 Installed Capacity by Region & Key Producer
- 3.16.2 Capacity Utilization Rates & Expansion Pipelines
- 3.17 Sustainability and environmental impact
- 3.17.1 Environmental impact assessment
- 3.17.2 Social impact & community benefits
- 3.17.3 Governance & corporate responsibility
- 3.17.4 Sustainable finance & investment trends
- 3.18 Impact of AI and Generative AI on the market
- 3.18.1 AI-driven disruption of existing business models
- 3.18.2 GenAI use cases & adoption roadmap by segment
- 3.18.3 Risks, limitations & regulatory considerations
- 3.19 Rapid expansion of ultra-fast charging networks
- 3.19.1 Highway corridor deployment strategies
- 3.19.2 Commercial and fleet-oriented ultra-fast hubs
- 3.19.3 Public-private partnerships (PPPs) and investment models
- 3.19.4 Technological standardization and interoperability
- 3.20 Forecast assumptions & scenario analysis (Driven by Primary Research)
- 3.20.1 Base Case - Key macro & industry variables driving CAGR
- 3.20.2 Optimistic Scenarios - Favorable macro and industry tailwinds
- 3.20.3 Pessimistic Scenario - Macroeconomic slowdown or industry headwinds
Chapter 4 Competitive Landscape, 2025
- 4.1 Introduction
- 4.2 Company market share analysis
- 4.2.1 North America
- 4.2.2 Europe
- 4.2.3 Asia Pacific
- 4.2.4 LATAM
- 4.2.5 MEA
- 4.3 Competitive analysis of major market players
- 4.4 Competitive positioning matrix
- 4.5 Key developments
- 4.5.1 Mergers & acquisitions
- 4.5.2 Partnerships & collaborations
- 4.5.3 New product launches
- 4.5.4 Expansion plans and funding
- 4.6 Company tier benchmarking
- 4.6.1 Tier classification criteria & qualifying thresholds
- 4.6.2 Tier positioning matrix by revenue, geography & innovation
Chapter 5 Market Estimates and Forecast, By Cable Power Capacity, 2022 - 2035 ($ Million, Units)
- 5.1 Key trends
- 5.2 300-499 kW
- 5.3 500-900 kW
- 5.4 Above 900 kW
Chapter 6 Market Estimates and Forecast, By Cable Length, 2022 - 2035 ($ Million, Units)
- 6.1 Key trends
- 6.2 Upto 5 meters
- 6.3 6-10 meters
- 6.4 Above 10 meters
Chapter 7 Market Estimates and Forecast, By Cable Diameter, 2022 - 2035 ($ Million, Units)
- 7.1 Key trends
- 7.2 Below 30 mm
- 7.3 30-50 mm
- 7.4 Above 50 mm
Chapter 8 Market Estimates and Forecast, By Conductor Material, 2022 - 2035 ($ Million, Units)
- 8.1 Key trends
- 8.2 Copper
- 8.3 Aluminium
Chapter 9 Market Estimates and Forecast, By Connector, 2022 - 2035 ($ Million, Units)
- 9.1 Key trends
- 9.2 Type 1
- 9.3 Type 2
- 9.4 CCS1
- 9.5 CCS2
- 9.6 CHAdeMO
- 9.7 Others
Chapter 10 Market Estimates and Forecast, By Application, 2022 - 2035 ($ Million, Units)
- 10.1 Key trends
- 10.2 Public Charging Stations
- 10.3 Commercial Fleet Charging
- 10.4 Residential / Private Charging
- 10.5 Highway and Long-Distance Charging Networks
Chapter 11 Market Estimates and Forecast, By Sales Channel, 2022 - 2035 ($ Million, Units)
- 11.1 Key trends
- 11.2 OEM
- 11.3 Aftermarket
Chapter 12 Market Estimates and Forecast, By Region, 2022 - 2035 ($ Million, Units)
- 12.1 Key trends
- 12.2 North America
- 12.2.1 US
- 12.2.2 Canada
- 12.3 Europe
- 12.3.1 Germany
- 12.3.2 UK
- 12.3.3 France
- 12.3.4 Italy
- 12.3.5 Spain
- 12.3.6 Russia
- 12.3.7 Netherlands
- 12.3.8 Norway
- 12.4 Asia Pacific
- 12.4.1 China
- 12.4.2 India
- 12.4.3 Japan
- 12.4.4 South Korea
- 12.4.5 Australia
- 12.4.6 Singapore
- 12.4.7 Malaysia
- 12.4.8 Philippines
- 12.4.9 Vietnam
- 12.5 Latin America
- 12.5.1 Brazil
- 12.5.2 Mexico
- 12.5.3 Argentina
- 12.5.4 Colombia
- 12.6 Middle East and Africa
- 12.6.1 South Africa
- 12.6.2 Saudi Arabia
- 12.6.3 UAE
Chapter 13 Company Profiles
- 13.1 Global players
- 13.1.1 Phoenix Contact
- 13.1.2 HUBER+SUHNER
- 13.1.3 LEONI
- 13.1.4 Sinbon Electronics
- 13.1.5 KemPower
- 13.1.6 ABB
- 13.1.7 LS Cable & System
- 13.1.8 Southwire Company
- 13.1.9 ITT Canon
- 13.1.10 Colder Products Company
- 13.1.11 Amphenol Energy
- 13.1.12 Coroflex
- 13.2 Regional players
- 13.2.1 OMG EV Cable
- 13.2.2 MIDA Power
- 13.2.3 Zhejiang Yonggui
- 13.2.4 Suzhou Yihang
- 13.2.5 Qingdao Penoda Electrical
- 13.3 Emerging players
- 13.3.1 BRUGG eConnect
- 13.3.2 Teison Energy
- 13.3.3 Caledonian Cables
