
|
시장보고서
상품코드
2038658
3D 프린팅용 플라스틱 시장 : 시장 기회, 성장요인, 업계 동향 분석 및 예측(2026-2035년)3D Printing Plastics Market Opportunity, Growth Drivers, Industry Trend Analysis, and Forecast 2026 - 2035 |
||||||
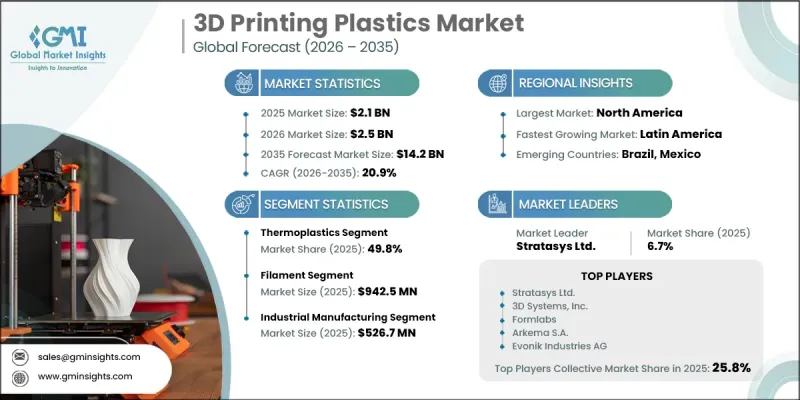
세계의 3D 프린팅용 플라스틱 시장은 2025년에 21억 달러로 평가되었고, CAGR 20.9%로 확대될 전망이며, 2035년에는 142억 달러에 이를 것으로 예측됩니다.

이 시장은 적층 가공 기술의 급속한 발전, 지속적인 재료 혁신, 산업 응용 분야에서의 3D 프린팅 활용 확대에 힘입어 강력한 모멘텀을 보이고 있습니다. 주요 성장 요인 중 하나는 완성된 부품의 구조적 강도, 내구성, 내열성을 향상시키는 다중 재료 및 복합재료 프린팅 시스템으로의 전환이 진행되고 있다는 점입니다. 인공지능(AI)과 제너레이티브 디자인 기능의 통합은 자재 효율성 향상, 폐기물 감소, 예측 및 자동화된 제조 워크플로우 구현을 통해 생산 공정을 더욱 혁신하고 있습니다. 산업 제조는 금형, 프로토타입 및 최종 용도의 기능 부품에 광범위하게 사용되어 여전히 핵심 용도 분야로 남아 있습니다. 또한, 커스터마이징과 설계의 유연성을 중시하는 자동차, 항공우주, 의료, 소비재 산업에서도 수요가 확대되고 있습니다. 지역별로는 아시아태평양이 대규모 산업 확장으로 매출 1위를 차지하고 있으며, 북미는 강력한 기술 혁신과 지원적인 정책 프레임워크의 혜택을 누리고 있습니다. 유럽은 지속가능성을 중시하는 제조 방식을 지속적으로 추진하고 있으며, 라틴아메리카와 중동 및 아프리카에서는 인프라의 제약으로 인해 점차 도입이 증가하고 있습니다.
| 시장 범위 | |
|---|---|
| 개시 연도 | 2025년 |
| 예측 기간 | 2026-2035년 |
| 개시 연도 시장 규모 | 21억 달러 |
| 예측 시장 규모 | 142억 달러 |
| CAGR | 20.9% |
열가소성 수지 부문은 49.8%의 점유율을 차지했으며, 2035년까지 연평균 복합 성장률(CAGR) 20.8%를 나타낼 것으로 예측됩니다. 그 장점은 널리 사용되는 적층제조 기술, 특히 FDM(용융 적층법) 및 SLS(선택적 레이저 소결법)와의 높은 호환성에 기인하며, 이로 인해 산업 생산에 있어 매우 다재다능한 제품입니다. 가공의 용이성, 재활용성 및 기계적 성능은 다양한 분야에서 채택을 더욱 촉진하고 있습니다.
필라멘트 소재는 2025년 9억 4,250만 달러에 달했으며, 2026-2035년 연평균 20.6%의 성장률을 보일 것으로 예측됩니다. 필라멘트는 압출 인쇄 시스템에서 광범위하게 사용되면서 적층 가공 시장에서 계속 지배적인 위치를 차지하고 있으며, 산업 및 상업적 이용 사례 모두에서 프로토타입 제작 및 비용 효율적인 생산 응용 분야에 이상적인 재료로 사용되고 있습니다.
북미의 3D 프린팅용 플라스틱 시장은 2026-2035년 연평균 복합 성장률(CAGR) 20.9%를 나타낼 것으로 예측됩니다. 이 지역에서는 기술의 조기 성숙과 주요 기업들의 탄탄한 생태계에 힘입어 항공우주, 의료, 자동차 산업에서 높은 보급률을 보이고 있습니다. 기존 기업의 존재와 제품 개발의 지속적인 혁신은 재료의 발전과 시장 확대를 더욱 가속화하고 있습니다.
자주 묻는 질문
목차
제1장 조사 방법 및 범위
제2장 주요 요약
제3장 업계 인사이트
제4장 경쟁 구도
제5장 시장 추산 및 예측 : 제품 유형별(2022-2035년)
제6장 시장 추산 및 예측 : 형태별(2022-2035년)
제7장 시장 추산 및 예측 : 최종 용도별(2022-2035년)
제8장 시장 추산 및 예측 : 지역별(2022-2035년)
제9장 기업 개요
AJY 26.06.11The Global 3D Printing Plastics Market was valued at USD 2.1 billion in 2025 and is estimated to grow at a CAGR of 20.9% to reach USD 14.2 billion in 2035.
The market is experiencing strong momentum driven by rapid advancements in additive manufacturing technologies, continuous material innovation, and the widening use of 3D printing across industrial applications. A major growth driver is the increasing shift toward multi-material and composite printing systems that enable enhanced structural strength, durability, and thermal resistance in finished components. The integration of artificial intelligence and generative design capabilities is further transforming production processes by improving material efficiency, reducing waste, and enabling predictive and automated manufacturing workflows. Industrial manufacturing remains a core application area, supported by widespread use in tooling, prototyping, and end-use functional parts. Demand is also expanding across automotive, aerospace, healthcare, and consumer goods industries, where customization and design flexibility are highly valued. Regionally, Asia Pacific leads in revenue due to large-scale industrial expansion, while North America benefits from strong technological innovation and supportive policy frameworks. Europe continues to emphasize sustainability-driven manufacturing practices, whereas Latin America and the Middle East & Africa are gradually increasing adoption despite infrastructure limitations.
| Market Scope | |
|---|---|
| Start Year | 2025 |
| Forecast Year | 2026-2035 |
| Start Value | $2.1 Billion |
| Forecast Value | $14.2 Billion |
| CAGR | 20.9% |
The thermoplastics segment held a 49.8% share and is projected to grow at a CAGR of 20.8% through 2035. Their dominance is attributed to strong compatibility with widely used additive manufacturing techniques, particularly Fused Deposition Modeling and Selective Laser Sintering, which makes them highly versatile for industrial production. Their ease of processing, recyclability, and mechanical performance further strengthen their adoption across multiple sectors.
The filament materials accounted USD 942.5 million in 2025 and is expected to grow at a CAGR of 20.6% during 2026-2035. Filaments continue to dominate the additive manufacturing landscape due to their extensive use in extrusion-based printing systems, making them the preferred material for prototyping and cost-efficient production applications across both industrial and commercial use cases.
North America 3D Printing Plastics Market is projected to grow at a CAGR of 20.9% during 2026-2035. The region demonstrates strong adoption across aerospace, healthcare, and automotive industries, supported by early technological maturity and a robust ecosystem of leading manufacturers. The presence of established companies and continuous innovation in product development further accelerates material advancements and market expansion.
Major players operating in the Global 3D Printing Plastics Industry are Stratasys Ltd., 3D Systems, Inc., Formlabs, Arkema S.A., Evonik Industries AG, EOS GmbH, SABIC, Henkel AG & Co. KGaA, Materialise NV, and Shenzhen eSUN. Key strategies adopted by companies in the 3D Printing Plastics Market include heavy investment in research and development to create high-performance and application-specific materials with improved mechanical and thermal properties. Firms are expanding their product portfolios to include advanced composite and multi-material solutions that cater to industrial-grade applications. Strategic partnerships with end-use industries such as aerospace, healthcare, and automotive are helping companies strengthen application-specific customization capabilities. Manufacturers are also focusing on scaling production capacity and optimizing supply chains to meet rising global demand efficiently. Adoption of sustainable and recyclable plastic formulations is gaining traction as environmental regulations tighten. In addition, companies are leveraging digital manufacturing platforms, software integration, and AI-driven design tools to enhance precision, reduce material waste, and improve production efficiency, thereby strengthening their competitive position in the rapidly evolving additive manufacturing ecosystem.
Table of Contents
Chapter 1 Methodology & Scope
- 1.1 Research approach
- 1.2 Quality Commitments
- 1.2.1 GMI AI policy & data integrity commitment
- 1.2.1.1 Source consistency protocol
- 1.2.1 GMI AI policy & data integrity commitment
- 1.3 Research Trail & Confidence Scoring
- 1.3.1 Research Trail Components
- 1.3.2 Scoring Components
- 1.4 Data Collection
- 1.4.1 Partial list of primary sources
- 1.5 Data mining sources
- 1.5.1 Paid sources
- 1.5.1.1 Sources, by region
- 1.5.1 Paid sources
- 1.6 Base estimates and calculations
- 1.6.1 Base year calculation for any one approach
- 1.7 Forecast model
- 1.7.1 Quantified market impact analysis
- 1.7.1.1 Mathematical impact of growth parameters on forecast
- 1.7.1 Quantified market impact analysis
- 1.8 Research transparency addendum
- 1.8.1 Source attribution framework
- 1.8.2 Quality assurance metrics
- 1.8.3 Our commitment to trust
Chapter 2 Executive Summary
- 2.1 Industry 360° synopsis
- 2.2 Key market trends
- 2.2.1 Regional
- 2.2.2 Product Type
- 2.2.3 Form
- 2.2.4 End Use
- 2.3 TAM Analysis, 2025-2035
- 2.4 CXO perspectives: Strategic imperatives
Chapter 3 Industry Insights
- 3.1 Industry ecosystem analysis
- 3.1.1 Supplier landscape
- 3.1.2 Profit margin
- 3.1.3 Value addition at each stage
- 3.1.4 Factor affecting the value chain
- 3.1.5 Disruptions
- 3.2 Industry impact forces
- 3.2.1 Growth drivers
- 3.2.2 Industry pitfalls and challenges
- 3.2.3 Market opportunities
- 3.3 Growth potential analysis
- 3.4 Regulatory landscape
- 3.4.1 North America
- 3.4.2 Europe
- 3.4.3 Asia Pacific
- 3.4.4 Latin America
- 3.4.5 Middle East & Africa
- 3.5 Porter's analysis
- 3.6 PESTEL analysis
- 3.7 Price trends
- 3.7.1 By region
- 3.7.2 By product type
- 3.8 Future market trends
- 3.9 Technology and Innovation landscape
- 3.9.1 Current technological trends
- 3.9.2 Emerging technologies
- 3.10 Patent Landscape
- 3.11 Trade statistics (HS code)
- 3.11.1 Major importing countries
- 3.11.2 Major exporting countries
- 3.12 Sustainability and environmental aspects
- 3.12.1 Sustainable practices
- 3.12.2 Waste reduction strategies
- 3.12.3 Energy efficiency in production
- 3.12.4 Eco-friendly initiatives
Chapter 4 Competitive Landscape, 2025
- 4.1 Introduction
- 4.2 Company market share analysis
- 4.2.1 By region
- 4.2.2 North America
- 4.2.3 Europe
- 4.2.4 Asia Pacific
- 4.2.5 LATAM
- 4.2.6 MEA
- 4.3 Company matrix analysis
- 4.4 Competitive analysis of major market players
- 4.5 Competitive positioning matrix
- 4.6 Key developments
- 4.6.1 Mergers & acquisitions
- 4.6.2 Partnerships & collaborations
- 4.6.3 New Product Launches
- 4.6.4 Expansion Plans
Chapter 5 Market Estimates and Forecast, By Product Type, 2022-2035 (USD Million) (Kilo Tons)
- 5.1 Key trends
- 5.2 Thermoplastics
- 5.2.1 Acrylonitrile Butadiene Styrene (ABS)
- 5.2.2 Polylactic Acid (PLA)
- 5.2.3 Polyamide (Nylon)
- 5.2.4 Polyetheretherketone (PEEK)
- 5.2.5 Polycarbonate (PC)
- 5.2.6 Polyethylene Terephthalate Glycol (PETG)
- 5.2.7 Polyphenylsulfone (PPSU)
- 5.2.8 Others (TPU, PPS, PEI)
- 5.3 Photopolymers
- 5.3.1 Standard Resins
- 5.3.2 Tough/Durable Resins
- 5.3.3 Flexible Resins
- 5.3.4 High-Temperature Resins
- 5.3.5 Biocompatible Resins
- 5.4 Others
Chapter 6 Market Estimates and Forecast, By Form, 2022-2035 (USD Million) (Kilo Tons)
- 6.1 Key trends
- 6.2 Filament
- 6.2.1 Standard Diameter (1.75mm)
- 6.2.2 Large Diameter (2.85mm & Above)
- 6.3 Powder
- 6.3.1 Fine Particle (< 50 microns)
- 6.3.2 Medium Particle (50-100 microns)
- 6.4 Liquid/Resin
- 6.4.1 UV-Curable Resins
- 6.4.2 Thermal-Curable Resins
- 6.5 Others
Chapter 7 Market Estimates and Forecast, By End Use, 2022-2035 (USD Million) (Kilo Tons)
- 7.1 Key trends
- 7.2 Automotive
- 7.2.1 Interior Components
- 7.2.2 Exterior Components
- 7.2.3 Powertrain Components
- 7.2.4 Tooling & Fixtures
- 7.3 Aerospace & Defense
- 7.3.1 Aircraft Interior Components
- 7.3.2 Structural Components
- 7.3.3 UAV & Drone Applications
- 7.3.4 Tooling & Jigs
- 7.4 Healthcare
- 7.4.1 Medical Devices
- 7.4.2 Prosthetics & Orthotics
- 7.4.3 Dental Applications
- 7.4.4 Surgical Planning & Anatomical Models
- 7.5 Consumer Goods
- 7.5.1 Footwear
- 7.5.2 Eyewear
- 7.5.3 Toys & Games
- 7.5.4 Sporting Goods
- 7.5.5 Home Products
- 7.6 Industrial Manufacturing
- 7.6.1 Production Tooling
- 7.6.2 Jigs & Fixtures
- 7.6.3 End-of-Arm Tooling
- 7.6.4 Functional Prototypes
- 7.7 Others
- 7.7.1 Architecture & Construction
- 7.7.2 Education & Research
- 7.7.3 Electronics
Chapter 8 Market Estimates and Forecast, By Region, 2022-2035 (USD Million) (Kilo Tons)
- 8.1 Key trends
- 8.2 North America
- 8.2.1 U.S.
- 8.2.2 Canada
- 8.3 Europe
- 8.3.1 Germany
- 8.3.2 UK
- 8.3.3 France
- 8.3.4 Spain
- 8.3.5 Italy
- 8.3.6 Rest of Europe
- 8.4 Asia Pacific
- 8.4.1 China
- 8.4.2 India
- 8.4.3 Japan
- 8.4.4 Australia
- 8.4.5 South Korea
- 8.4.6 Rest of Asia Pacific
- 8.5 Latin America
- 8.5.1 Brazil
- 8.5.2 Mexico
- 8.5.3 Argentina
- 8.5.4 Rest of Latin America
- 8.6 Middle East and Africa
- 8.6.1 Saudi Arabia
- 8.6.2 South Africa
- 8.6.3 UAE
- 8.6.4 Rest of Middle East and Africa
Chapter 9 Company Profiles
- 9.1 Stratasys Ltd.
- 9.2 3D Systems, Inc.
- 9.3 Formlabs
- 9.4 Arkema S.A.
- 9.5 Evonik Industries AG
- 9.6 EOS GmbH
- 9.7 SABIC
- 9.8 Henkel AG & Co. KGaA
- 9.9 Materialise NV
- 9.10 Shenzhen eSUN

