
|
시장보고서
상품코드
2045690
진공 소금 시장 비즈니스 기회, 성장요인, 업계 동향 분석 및 예측(2026-2035년)Vacuum Salt Market Opportunity, Growth Drivers, Industry Trend Analysis, and Forecast 2026 - 2035 |
||||||
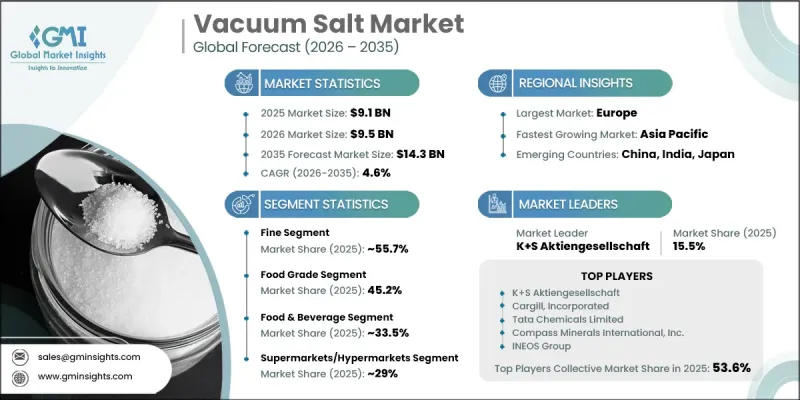
세계의 진공 소금 시장은 2025년에 91억 달러로 평가되었고 CAGR 4.6%로 성장하여 2035년까지 143억 달러에 이를 것으로 추정되고 있습니다.

이 시장의 확대는 엄격한 품질 및 안전 기준을 충족하는 고순도 소금 제품에 대한 수요 증가로 인해 주도되고 있습니다. 제어된 진공 조건에서 소금물을 증발시켜 생산되는 진공 소금은 고순도, 균일한 입자 구조, 낮은 불순물 함량으로 널리 인정받고 있습니다. 이러한 특성으로 인해 식품 가공, 제약 제제 및 산업용 화학제품 제조에 매우 적합합니다. 식품 보존, 풍미 강화, 염소 제조, 가성소다 제조, 수처리 및 연수화 공정에 이르기까지 다양한 용도로 사용됩니다. 제품의 순도와 건강에 대한 소비자의 인식이 높아지면서 무첨가 소금 솔루션에 대한 수요가 더욱 증가하고 있습니다. 산업 성장과 도시 개발도 각 최종 용도 부문의 안정적인 소비에 기여하고 있습니다. 각 산업계가 품질과 효율성을 최우선시하는 가운데, 세계 진공 소금 시장은 응용 분야 확대와 제조 공정의 기술적 진보에 힘입어 안정적인 성장세를 유지할 것으로 예측됩니다.
| 시장 범위 | |
|---|---|
| 시작 연도 | 2025년 |
| 예측 기간 | 2026-2035년 |
| 시작 연도 시장 규모 | 91억 달러 |
| 예측 시장 규모 | 143억 달러 |
| CAGR | 4.6% |
미세 소금 부문은 2025년 55.7%의 점유율을 차지해, 2035년까지 연평균 4.9%의 성장률을 보일 것으로 예측됩니다. 이 부문은 높은 순도와 균일한 입자 크기로 인해 정밀도와 품질이 요구되는 용도에 적합하여 널리 선호되고 있습니다. 미립자 소금은 배합 관리가 필수적인 식품 가공 및 의약품 분야에서 사용이 증가하고 있습니다. 균일한 구조는 정확한 혼합과 제품 일관성 향상을 지원하여 다양한 산업 분야에서 채택되고 있습니다.
식품 등급 부문은 2025년 45.2%의 점유율을 차지해, 2026년부터 2035년까지 연평균 복합 성장률(CAGR) 4.7%를 나타낼 것으로 예측됩니다. 이 부문 수요는 가공식품 및 포장식품의 소비 증가와 함께 안전과 품질 기준에 대한 관심이 높아짐에 따라 증가하고 있습니다. 제조업체들은 엄격한 규제 요건과 소비자의 기대에 부응하기 위해 고순도 소금의 채택을 확대되고 있습니다. 공업용 소금은 화학 처리 및 수처리 용도를 지속적으로 지원하고 있으며, 인프라 중심 부문 전반에 걸쳐 안정적인 수요를 유지하고 있습니다.
북미 진공 소금 시장은 2025년 20.1%의 점유율을 차지했습니다. 지역적 수요는 식품 가공, 수처리 및 산업 제조 분야의 응용 분야 확대에 의해 뒷받침되고 있습니다. 첨단 생산 시스템의 도입과 엄격한 품질 기준의 존재는 정제염 제품의 높은 채택률에 기여하고 있습니다. 환경 지속가능성과 수질 정화에 대한 관심이 높아지면서 수요가 증가하고 있으며, 이 지역은 세계 시장 성장의 주요 견인차 역할을 하고 있습니다.
자주 묻는 질문
목차
제1장 조사 방법과 범위
제2장 주요 요약
제3장 업계 인사이트
제4장 경쟁 구도
제5장 시장 추산 및 예측 : 제품 유형별, 2022-2035년
제6장 시장 추산 및 예측 : 등급별, 2022-2035년
제7장 시장 추산 및 예측 : 용도별, 2022-2035년
제8장 시장 추산 및 예측 : 유통 채널별, 2022-2035년
제9장 시장 추산 및 예측 : 지역별, 2022-2035년
제10장 기업 개요
JHS 26.06.11The Global Vacuum Salt Market was valued at USD 9.1 billion in 2025 and is estimated to grow at a CAGR of 4.6% to reach USD 14.3 billion by 2035.
Expansion is driven by the growing requirement for high-purity salt products that meet strict quality and safety standards. Vacuum salt, produced through the evaporation of brine under controlled vacuum conditions, is widely recognized for its high purity, uniform grain structure, and low impurity levels. These characteristics make it highly suitable for food processing, pharmaceutical formulations, and industrial chemical production. Its applications extend across food preservation, flavor enhancement, chlorine production, caustic soda manufacturing, water treatment, and softening processes. Rising consumer awareness regarding product purity and health considerations is further supporting demand for additive-free salt solutions. Industrial growth and urban development are also contributing to consistent consumption across end-use sectors. As industries continue to prioritize quality and efficiency, the global vacuum salt market is expected to maintain stable growth momentum driven by expanding applications and technological improvements in production processes.
| Market Scope | |
|---|---|
| Start Year | 2025 |
| Forecast Year | 2026-2035 |
| Start Value | $9.1 Billion |
| Forecast Value | $14.3 Billion |
| CAGR | 4.6% |
The fine salt segment accounted for 55.7% share in 2025 and is expected to grow at a CAGR of 4.9% through 2035. This segment remains widely preferred due to its high purity and consistent particle size, making it suitable for applications requiring precision and quality. Fine salt is increasingly used in food processing and pharmaceutical applications where controlled formulation is essential. Its uniform structure supports accurate blending and improved product consistency, strengthening its adoption across multiple industries.
The food grade segment held a 45.2% share in 2025 and is projected to grow at a CAGR of 4.7% from 2026 to 2035. Demand in this segment is driven by increasing consumption of processed and packaged foods along with rising emphasis on safety and quality standards. Manufacturers are increasingly adopting high-purity salt to meet stringent regulatory requirements and consumer expectations. Industrial-grade salt continues to support chemical processing and water treatment applications, maintaining steady demand across infrastructure-driven sectors.
North America Vacuum Salt Market accounted for 20.1% share in 2025. Regional demand is supported by expanding applications across food processing, water treatment, and industrial manufacturing. The presence of advanced production systems and strict quality standards contributes to high adoption of purified salt products. Increasing focus on environmental sustainability and water purification is also strengthening demand, making the region a key contributor to global market growth.
Key companies operating in the Global Vacuum Salt Industry include ACI Limited, Cargill, Incorporated, Cheetham Salt, Compass Minerals International, Inc., Dominion Salt Limited, INEOS Group, Infosa, K+S Aktiengesellschaft, Nirma Limited, Nobian, Salins Group, Sudwestdeutsche Salzwerke AG, Tata Chemicals Limited, and WA Salt Group. Companies in the vacuum salt market are strengthening their position through capacity expansion, technological upgrades, and product quality enhancement strategies. Manufacturers are investing in advanced production technologies to improve purity levels, consistency, and operational efficiency. Strategic partnerships and distribution network expansion are helping companies reach a broader customer base across industrial and consumer segments. Many players are also focusing on sustainability initiatives, including energy-efficient production processes and reduced environmental impact. Product diversification is being adopted to cater to specialized applications in food, pharmaceuticals, and industrial processing.
Table of Contents
Chapter 1 Methodology & Scope
- 1.1 Market scope and definition
- 1.2 Research design
- 1.2.1 Research approach
- 1.2.2 Data collection methods
- 1.3 Data mining sources
- 1.3.1 Global
- 1.3.2 Regional/Country
- 1.4 Base estimates and calculations
- 1.4.1 Base year calculation
- 1.4.2 Key trends for market estimation
- 1.5 Primary research and validation
- 1.5.1 Primary sources
- 1.6 Forecast model
- 1.7 Research assumptions and limitations
Chapter 2 Executive Summary
- 2.1 Industry 360° synopsis
- 2.2 Key market trends
- 2.2.1 Regional
- 2.2.2 Product type
- 2.2.3 Grade
- 2.2.4 Application
- 2.2.5 Distribution channel
- 2.3 TAM Analysis, 2026-2035
- 2.4 CXO perspectives: Strategic imperatives
- 2.4.1 Executive decision points
Chapter 3 Industry Insights
- 3.1 Industry ecosystem analysis
- 3.1.1 Supplier landscape
- 3.1.2 Profit margin
- 3.1.3 Value addition at each stage
- 3.1.4 Factor affecting the value chain
- 3.1.5 Disruptions
- 3.2 Industry impact forces
- 3.2.1 Growth drivers
- 3.2.2 Industry pitfalls and challenges
- 3.2.3 Market opportunities
- 3.3 Growth potential analysis
- 3.4 Regulatory landscape
- 3.4.1 North America
- 3.4.2 Europe
- 3.4.3 Asia Pacific
- 3.4.4 Latin America
- 3.4.5 Middle East & Africa
- 3.5 Porter's analysis
- 3.6 PESTEL analysis
- 3.7 Price trends
- 3.7.1 By region
- 3.7.2 By type
- 3.8 Future market trends
- 3.9 Technology and Innovation landscape
- 3.9.1 Current technological trends
- 3.9.2 Emerging technologies
- 3.10 Patent Landscape
- 3.11 Trade statistics (HS code)
- 3.11.1 Major importing countries
- 3.11.2 Major exporting countries
- 3.12 Sustainability and environmental aspects
- 3.12.1 Sustainable practices
- 3.12.2 Waste reduction strategies
- 3.12.3 Energy efficiency in production
- 3.12.4 Eco-friendly initiatives
- 3.13 Carbon footprint consideration
Chapter 4 Competitive Landscape, 2025
- 4.1 Introduction
- 4.2 Company market share analysis
- 4.2.1 By region
- 4.2.1.1 North America
- 4.2.1.2 Europe
- 4.2.1.3 Asia Pacific
- 4.2.1.4 LATAM
- 4.2.1.5 MEA
- 4.2.1 By region
- 4.3 Company matrix analysis
- 4.4 Competitive analysis of major market players
- 4.5 Competitive positioning matrix
- 4.6 Key developments
- 4.6.1 Mergers & acquisitions
- 4.6.2 Partnerships & collaborations
- 4.6.3 New Product Launches
- 4.6.4 Expansion Plans
Chapter 5 Market Estimates and Forecast, By Product Type, 2022-2035 (USD Billion) (Kilo Tons)
- 5.1 Key trends
- 5.2 Granular
- 5.3 Fine
Chapter 6 Market Estimates and Forecast, By Grade, 2022-2035 (USD Billion) (Kilo Tons)
- 6.1 Key trends
- 6.2 Food grade
- 6.3 Industrial grade
- 6.4 Pharmaceutical grade
Chapter 7 Market Estimates and Forecast, By Application, 2022-2035 (USD Billion) (Kilo Tons)
- 7.1 Key trends
- 7.2 Food and beverage
- 7.3 Chemical industry
- 7.4 Water treatment
- 7.5 Pharmaceuticals
- 7.6 Others
Chapter 8 Market Estimates and Forecast, By Distribution channel, 2022-2035 (USD Billion) (Kilo Tons)
- 8.1 Key trends
- 8.2 Online retail
- 8.3 Supermarkets/hypermarkets
- 8.4 Specialty stores
- 8.5 Direct sales
- 8.6 Others
Chapter 9 Market Estimates and Forecast, By Region, 2022-2035 (USD Billion) (Kilo Tons)
- 9.1 Key trends
- 9.2 North America
- 9.2.1 U.S.
- 9.2.2 Canada
- 9.3 Europe
- 9.3.1 Germany
- 9.3.2 UK
- 9.3.3 France
- 9.3.4 Spain
- 9.3.5 Italy
- 9.3.6 Rest of Europe
- 9.4 Asia Pacific
- 9.4.1 China
- 9.4.2 India
- 9.4.3 Japan
- 9.4.4 Australia
- 9.4.5 South Korea
- 9.4.6 Rest of Asia Pacific
- 9.5 Latin America
- 9.5.1 Brazil
- 9.5.2 Mexico
- 9.5.3 Argentina
- 9.5.4 Rest of Latin America
- 9.6 Middle East and Africa
- 9.6.1 Saudi Arabia
- 9.6.2 South Africa
- 9.6.3 UAE
- 9.6.4 Rest of Middle East and Africa
Chapter 10 Company Profiles
- 10.1 K+S Aktiengesellschaft
- 10.2 Tata Chemicals Limited
- 10.3 INEOS Group
- 10.4 Nobian
- 10.5 Compass Minerals International, Inc.
- 10.6 Cargill, Incorporated
- 10.7 Sudwestdeutsche Salzwerke AG
- 10.8 Dominion Salt Limited
- 10.9 Cheetham Salt
- 10.10 WA Salt Group
- 10.11 Salins Group
- 10.12 ACI Limited
- 10.13 Infosa
- 10.14 Nirma Limited
(주말 및 공휴일 제외)
