
|
시장보고서
상품코드
2045726
자전거 및 스쿠터 렌탈 시장 : 기회, 성장 촉진요인, 업계 동향 분석 및 예측(2026-2035년)Bike and Scooter Rental Market Opportunity, Growth Drivers, Industry Trend Analysis, and Forecast 2026 - 2035 |
||||||
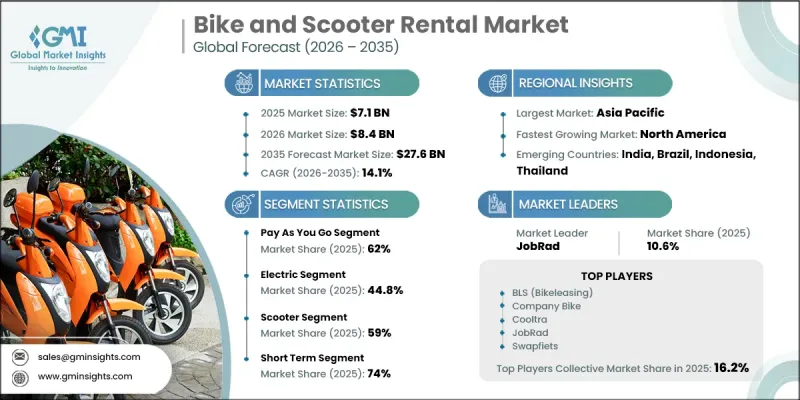
세계의 자전거 및 스쿠터 렌탈 시장은 2025년에 71억 달러로 평가되었고, 2035년까지 연평균 복합 성장률(CAGR) 14.1%를 나타내 276억 달러에 이를 것으로 추정되고 있습니다.

도시 인구가 계속 증가하고 전 세계 주요 도시에서 교통 체증이 심각한 문제로 떠오르면서 자전거 및 스쿠터 렌탈 산업이 크게 성장하고 있습니다. 도시로의 인구 유입이 증가함에 따라 편리하고 유연하며 비용 효율적인 공유 모빌리티 솔루션에 대한 수요가 가속화되고 있습니다. 렌탈 업무에 디지털 기술이 빠르게 도입되면서 앱을 통한 차량 이용, 디지털 결제, 실시간 차량 추적이 가능해져 고객의 편의성이 더욱 향상되었습니다. 또한, 지속 가능한 교통수단 및 저공해 모빌리티를 지원하는 정부의 이니셔티브도 시장 성장에 긍정적인 영향을 미치고 있습니다. 많은 도시들은 공유형 모빌리티 서비스의 보급을 촉진하기 위해 자전거 인프라, 전용 모빌리티 레인, 친환경 도시 교통 시스템에 많은 투자를 하고 있습니다. 또한, 고정된 도킹 스테이션을 필요로 하지 않고 사용자에게 더 높은 유연성과 원활한 차량 이용을 제공함으로써 도킹리스 렌탈 시스템의 인기가 높아지는 것도 업계를 변화시키고 있습니다. 지속 가능한 교통수단에 대한 인식 증가와 저렴한 단거리 이동수단에 대한 수요 증가는 앞으로도 전 세계 자전거 및 스쿠터 렌탈 시장의 성장을 견인할 것으로 예측됩니다.
| 시장 범위 | |
|---|---|
| 시작 연도 | 2025년 |
| 예측 기간 | 2026-2035년 |
| 시작 연도 시장 규모 | 71억 달러 |
| 예측 시장 규모 | 276억 달러 |
| CAGR | 14.1% |
종량제 부문은 62%의 점유율을 차지하고 있으며, 2026년부터 2035년까지 연평균 복합 성장률(CAGR) 12.6%를 나타낼 것으로 예측됩니다. 유연하고 편리한 렌탈 옵션에 대한 소비자의 강력한 수요가 이 부문의 성장을 지속적으로 뒷받침하고 있습니다. 사용자들은 장기 계약이나 구독형 계약이 필요 없이 즉시 모빌리티 솔루션을 이용할 수 있는 단기 렌탈 모델을 점점 더 선호하고 있습니다. 수요가 많은 도시 지역과 교통 요충지에서는 종량제 서비스에 대한 수요가 지속적으로 증가하고 있으며, 사업자는 차량 이용률과 운영 효율을 극대화하기 위해 충분한 차량 공급 체계와 동적 가격 책정 전략을 유지해야 합니다.
전기자동차 부문은 2025년 44.8%의 점유율을 차지했으며, 2026년부터 2035년까지 연평균 17.5%의 성장률을 나타낼 것으로 전망됩니다. 친환경적이고 저렴한 교통수단에 대한 수요가 증가함에 따라 도시 모빌리티 네트워크 전반에 걸쳐 전기 이륜차 도입이 가속화되고 있습니다. 전기자전거와 스쿠터는 기존 연료 구동형에 비해 운영비와 유지비가 저렴해 인기를 끌고 있습니다. 지속 가능한 교통 시스템으로의 전환과 전기 모빌리티 솔루션에 대한 수용성이 높아지고 있는 것도 이 부문의 견조한 성장에 기여하고 있습니다.
중국의 자전거 및 스쿠터 렌탈 시장은 38%의 점유율을 차지했으며, 2025년에는 11억 달러 시장 규모를 형성했습니다. 중국의 자전거 및 스쿠터 렌탈 산업은 일상적인 출퇴근과 단거리 이동을 모두 지원하는 도시 모빌리티 생태계로 발전하고 있습니다. 정부 당국은 교통 규제, 도시 모빌리티 계획, 데이터 관리 이니셔티브를 통해 시장 형성에 중요한 역할을 계속하고 있습니다. 교통체증 완화 및 탄소배출량 감축을 위한 노력이 강화됨에 따라, 지방정부는 자전거 주차 관리 시스템, 차량 배치 최적화 방안 등 공유 모빌리티 사업의 감독 체계를 강화하도록 촉구하고 있습니다.
자주 묻는 질문
목차
제1장 조사 방법
제2장 주요 요약
제3장 업계 인사이트
제4장 경쟁 구도
제5장 시장 추산 및 예측 : 서비스별(2022-2035년)
제6장 시장 추산 및 예측 : 추진력별(2022-2035년)
제7장 시장 추산 및 예측 : 차량별(2022-2035년)
제8장 시장 추산 및 예측 : 렌탈 기간별(2022-2035년)
제9장 시장 추산 및 예측 : 최종 사용자별(2022-2035년)
제10장 시장 추산 및 예측 : 지역별(2022-2035년)
제11장 기업 개요
KTH 26.06.10The Global Bike and Scooter Rental Market was valued at USD 7.1 billion in 2025 and is estimated to grow at a CAGR of 14.1% to reach USD 27.6 billion by 2035.
The bike and scooter rental industry is experiencing significant expansion as urban populations continue to rise and transportation congestion becomes a growing challenge across major cities worldwide. Increasing migration toward urban centers has accelerated the demand for convenient, flexible, and cost-efficient shared mobility solutions. Rapid integration of digital technologies into rental operations has further improved customer convenience through app-based vehicle access, digital payments, and real-time fleet tracking. In addition, government initiatives supporting sustainable transportation and low-emission mobility are positively influencing market growth. Many cities are investing heavily in cycling infrastructure, dedicated mobility lanes, and environmentally friendly urban transportation systems to encourage the adoption of shared mobility services. The growing popularity of dockless rental systems is also transforming the industry by providing users with greater flexibility and seamless access to vehicles without requiring fixed docking stations. Rising awareness regarding sustainable transportation and the increasing preference for affordable short-distance travel options are expected to continue driving the growth of the global bike and scooter rental market.
| Market Scope | |
|---|---|
| Start Year | 2025 |
| Forecast Year | 2026-2035 |
| Start Value | $7.1 Billion |
| Forecast Value | $27.6 Billion |
| CAGR | 14.1% |
The pay-as-you-go segment held a 62% share and is expected to grow at a CAGR of 12.6% between 2026 and 2035. Strong consumer preference for flexible and convenient rental options continues to support the growth of this segment. Users increasingly favor short-term rental models that offer immediate access to mobility solutions without requiring long-term commitments or subscription-based agreements. High-demand urban locations and transportation hubs continue to generate significant demand for pay-as-you-go services, encouraging operators to maintain strong fleet availability and dynamic pricing strategies to maximize vehicle utilization and operational efficiency.
The electric segment accounted for 44.8% share in 2025 and is projected to grow at a CAGR of 17.5% during 2026-2035. Increasing demand for environmentally friendly and affordable transportation solutions is accelerating the adoption of electric two-wheelers across urban mobility networks. Electric bikes and scooters are gaining popularity due to their lower operational and maintenance costs compared to traditional fuel-powered alternatives. The growing transition toward sustainable transportation systems and the rising acceptance of electric mobility solutions are further contributing to strong segment growth worldwide.
China Bike and Scooter Rental Market held a 38% share, generating USD 1.1 billion in 2025. The country's bike and scooter rental industry has developed into a highly established urban mobility ecosystem that supports both daily commuting and short-distance transportation requirements. Government authorities continue to play a major role in shaping the market through transportation regulations, urban mobility planning, and data management initiatives. Increasing efforts to reduce traffic congestion and lower carbon emissions are encouraging local administrations to strengthen oversight of shared mobility operations, including parking management systems and fleet optimization measures.
Key companies operating in the Global Bike and Scooter Rental Market include BLS (Bikeleasing), Company Bike, Cooltra, Felyx, JobRad, Lease a Bike, Swapfiets, Yulu, Zoomo, and Zypp Electric. Companies operating in the bike and scooter rental market are implementing several strategic initiatives to strengthen their market presence and improve competitive positioning. Leading operators are investing heavily in expanding electric vehicle fleets to meet rising demand for sustainable urban transportation solutions. Businesses are also focusing on enhancing mobile applications and digital platforms to improve customer experience through seamless booking, navigation, and payment systems. Strategic partnerships with municipalities, transportation authorities, and corporate organizations are helping companies expand operational reach and strengthen infrastructure support. Many market participants are prioritizing fleet optimization technologies, AI-driven route management, and real-time monitoring systems to improve operational efficiency and reduce maintenance costs.
Table of Contents
Chapter 1 Methodology
- 1.1 Research approach
- 1.2 Quality Commitments
- 1.2.1 GMI AI policy & data integrity commitment
- 1.2.1.1 Source consistency protocol
- 1.2.1 GMI AI policy & data integrity commitment
- 1.3 Research Trail & Confidence Scoring
- 1.3.1 Research Trail Components
- 1.3.2 Scoring Components
- 1.4 Data Collection
- 1.4.1 Partial list of primary sources
- 1.5 Data mining sources
- 1.5.1 Paid sources
- 1.5.1.1 Sources, by region
- 1.5.1 Paid sources
- 1.6 Base estimates and calculations
- 1.6.1 Base year calculation for any one approach
- 1.7 Forecast model
- 1.7.1 Quantified market impact analysis
- 1.7.1.1 Mathematical impact of growth parameters on forecast
- 1.7.1 Quantified market impact analysis
- 1.8 Research transparency addendum
- 1.8.1 Source attribution framework
- 1.8.2 Quality assurance metrics
- 1.8.3 Our commitment to trust
Chapter 2 Executive Summary
- 2.1 Industry 360° synopsis, 2022 - 2035
- 2.2 Key market trends
- 2.2.1 Regional
- 2.2.2 Service
- 2.2.3 Propulsion
- 2.2.4 Vehicle
- 2.2.5 Rental Duration
- 2.2.6 End User
- 2.3 TAM Analysis, 2026-2035
- 2.4 CXO perspectives: Strategic imperatives
Chapter 3 Industry Insights
- 3.1 Industry ecosystem analysis
- 3.1.1 Supplier landscape
- 3.1.2 Profit margin analysis
- 3.1.3 Cost structure
- 3.1.4 Value addition at each stage
- 3.1.5 Factor affecting the value chain
- 3.1.6 Disruptions
- 3.2 Industry impact forces
- 3.2.1 Growth drivers
- 3.2.1.1 Growing demand for flexible short-term transportation
- 3.2.1.2 Expansion of tourism and leisure activities
- 3.2.1.3 Corporate and employee leasing programs
- 3.2.1.4 Digital booking and fleet management systems
- 3.2.2 Industry pitfalls and challenges
- 3.2.2.1 High maintenance and fleet management costs
- 3.2.2.2 Seasonal demand fluctuations
- 3.2.3 Market opportunities
- 3.2.3.1 Expansion in corporate leasing segment
- 3.2.3.2 Growth in tourism driven rentals
- 3.2.3.3 Development of subscription based rental plans
- 3.2.1 Growth drivers
- 3.3 Growth potential analysis
- 3.4 Regulatory landscape
- 3.4.1 North America
- 3.4.1.1 United States shared mobility regulations and e-scooter laws
- 3.4.1.2 City-level bike and scooter sharing permits and fleet caps
- 3.4.1.3 Safety standards and helmet regulations
- 3.4.1.4 Canada micromobility regulations and municipal guidelines
- 3.4.2 Europe
- 3.4.2.1 EU micromobility and light electric vehicle regulations
- 3.4.2.2 UNECE vehicle safety and technical standards
- 3.4.2.3 National e-scooter usage laws and speed limits
- 3.4.2.4 Environmental and urban mobility policies
- 3.4.3 Asia Pacific
- 3.4.3.1 China shared bike regulations and fleet management policies
- 3.4.3.2 India e-scooter and bike sharing guidelines
- 3.4.3.3 Japan micromobility and road safety regulations
- 3.4.3.4 Australia e-scooter trial regulations and safety rules
- 3.4.3.5 ASEAN urban mobility and vehicle regulations
- 3.4.4 Latin America
- 3.4.4.1 Brazil shared mobility and safety regulations
- 3.4.4.2 Mexico e-scooter and bike sharing laws
- 3.4.4.3 Argentina micromobility regulations
- 3.4.4.4 Regional urban transport policy frameworks
- 3.4.5 Middle East & Africa
- 3.4.5.1 UAE e-scooter regulations and licensing
- 3.4.5.2 Saudi Arabia micromobility safety regulations
- 3.4.5.3 South Africa shared mobility regulatory framework
- 3.4.1 North America
- 3.5 Porter's analysis
- 3.6 PESTEL analysis
- 3.7 Technology and innovation landscape
- 3.7.1 Current technological trends
- 3.7.2 Emerging technologies
- 3.8 Pricing Analysis (Driven by primary research)
- 3.8.1 Historical Price Trend Analysis
- 3.8.2 Pricing Strategy by Player Type
- 3.9 Cost breakdown analysis
- 3.10 Patent analysis (Driven by primary research)
- 3.11 Sustainability and environmental aspects
- 3.11.1 Sustainable practices
- 3.11.2 Waste reduction strategies
- 3.11.3 Energy efficiency in production
- 3.11.4 Eco-friendly Initiatives
- 3.11.5 Carbon footprint considerations
- 3.12 Impact of AI and Generative AI on the Market
- 3.12.1 AI Driven Disruption of Existing Business Models
- 3.12.2 GenAI Use Cases and Adoption Roadmap by Segment
- 3.12.3 Risks Limitations and Regulatory Considerations
- 3.13 Forecast assumptions & scenario analysis (Driven by Primary Research)
- 3.13.1 Base Case- Key Macro & Industry Variables Driving CAGR
- 3.13.2 Optimistic Scenarios- Favorable macro and industry tailwinds
- 3.13.3 Pessimistic Scenario - Macroeconomic slowdown or industry headwinds
Chapter 4 Competitive Landscape, 2025
- 4.1 Introduction
- 4.2 Company market share analysis
- 4.2.1 North America
- 4.2.2 Europe
- 4.2.3 Asia Pacific
- 4.2.4 LATAM
- 4.2.5 MEA
- 4.3 Competitive analysis of major market players
- 4.4 Competitive positioning matrix
- 4.5 Key developments
- 4.5.1 Mergers & acquisitions
- 4.5.2 Partnerships & collaborations
- 4.5.3 New Product Launches
- 4.5.4 Expansion Plans and funding
Chapter 5 Market Estimates & Forecast, By Service, 2022 - 2035 (USD Mn, Fleet Size)
- 5.1 Key trends
- 5.2 Pay as you go
- 5.3 Subscription-based
Chapter 6 Market Estimates & Forecast, By Propulsion, 2022 - 2035 (USD Mn, Fleet Size)
- 6.1 Key trends
- 6.2 Pedal
- 6.3 Electric
- 6.4 Gasoline
Chapter 7 Market Estimates & Forecast, By Vehicle, 2022 - 2035 (USD Mn, Fleet Size)
- 7.1 Key trends
- 7.2 Bike
- 7.3 Scooter
Chapter 8 Market Estimates & Forecast, By Rental Duration, 2022 - 2035 (USD Mn, Fleet Size)
- 8.1 Key trends
- 8.2 Short term
- 8.3 Long term
Chapter 9 Market Estimates & Forecast, By End User, 2022 - 2035 (USD Mn, Fleet Size)
- 9.1 Key trends
- 9.2 Commuters
- 9.3 Tourists
- 9.4 Students
- 9.5 Corporate Users
- 9.6 Delivery Personnel
Chapter 10 Market Estimates & Forecast, By Region, 2022 - 2035 (USD Mn, Fleet Size)
- 10.1 Key trends
- 10.2 North America
- 10.2.1 US
- 10.2.2 Canada
- 10.3 Europe
- 10.3.1 Germany
- 10.3.2 UK
- 10.3.3 France
- 10.3.4 Italy
- 10.3.5 Spain
- 10.3.6 Russia
- 10.3.7 Norway
- 10.3.8 Netherlands
- 10.3.9 Sweden
- 10.4 Asia Pacific
- 10.4.1 China
- 10.4.2 India
- 10.4.3 Japan
- 10.4.4 Australia
- 10.4.5 South Korea
- 10.4.6 Singapore
- 10.4.7 Thailand
- 10.4.8 Indonesia
- 10.4.9 Vietnam
- 10.5 Latin America
- 10.5.1 Brazil
- 10.5.2 Mexico
- 10.5.3 Argentina
- 10.6 MEA
- 10.6.1 South Africa
- 10.6.2 Saudi Arabia
- 10.6.3 UAE
- 10.6.4 Turkey
Chapter 11 Company Profiles
- 11.1 Global players
- 11.1.1 Bird (Third Lane Mobility)
- 11.1.2 JobRad
- 11.1.3 Lime (Neutron)
- 11.1.4 Swapfiets
- 11.1.5 Vogo
- 11.1.6 Zoomo
- 11.2 Regional players
- 11.2.1 BLS (Bikeleasing)
- 11.2.2 Company Bike
- 11.2.3 Cooltra
- 11.2.4 Donkey Republic
- 11.2.5 Dott
- 11.2.6 Felyx
- 11.2.7 Lease a Bike
- 11.2.8 Voi Technology
- 11.2.9 Yulu
- 11.2.10 Zypp Electric
- 11.3 Emerging players / disruptors
- 11.3.1 CYCLE
- 11.3.2 Dance
- 11.3.3 PLUTO (GIN e-bikes)
- 11.3.4 Upway Flex
