
|
시장보고서
상품코드
2045786
자율운항선박(AMV) 시장 : 기회, 성장 촉진요인, 업계 동향 분석 및 예측(2026-2035년)Autonomous Marine Vehicle Market Opportunity, Growth Drivers, Industry Trend Analysis, and Forecast 2026 - 2035 |
||||||
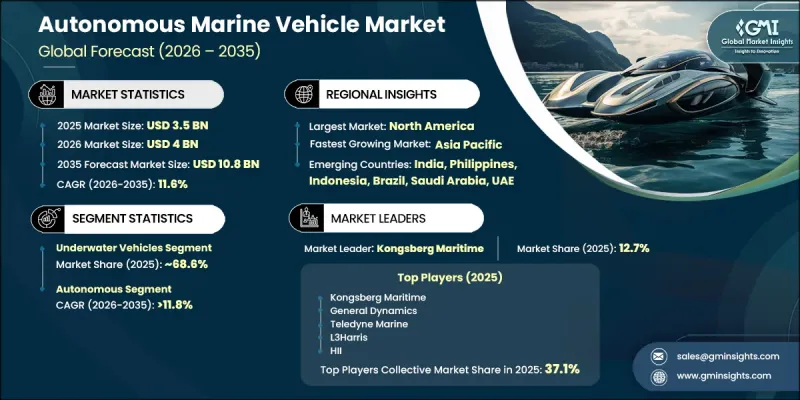
세계의 자율운항선박(AMV) 시장은 2025년에 35억 달러로 평가되었고 CAGR 11.6%를 나타내 2035년까지 108억 달러에 이를 것으로 추정되고 있습니다.

무인 해양 임무에 대한 수요 증가와 인공지능, 센서 융합, 수중 통신 시스템의 지속적인 개선을 배경으로 해양 운영의 자동화 도입이 진행됨에 따라 업계는 급속한 기술 변화를 겪고 있습니다. 최소한의 인위적 개입으로 복잡한 작업을 수행할 수 있는 자율 및 반자율 플랫폼으로의 전환이 진행됨에 따라 기존의 유인 선박에 대한 의존도는 꾸준히 감소하고 있습니다. 최신 자율 해양 차량은 소나 시스템, 위성 통신, AI 기반 항법, LiDAR, 첨단 이미징 페이로드 및 실시간 모니터링 기능을 통합하여 상업, 국방 및 과학 분야에서 임무 효율성, 운영 기간 및 상황 인식을 크게 향상시키고 있습니다. 해양 인프라 모니터링, 해양 보안 강화, 해양 데이터 수집에 대한 관심이 높아지면서 자율 수중 및 수상 차량 도입이 가속화되고 있습니다. 정부, 해군 및 해양 사업자들은 운영 위험을 줄이고, 모니터링 효율을 높이며, 원격지 및 위험한 해양 환경에서 장기적인 임무를 수행하기 위해 지능형 해양 시스템에 대한 투자를 확대되고 있습니다. 또한, 충돌 회피 기술 및 자율 항해 기술의 발전으로 안전성이 향상되고, 인적 의존도를 낮추며, 보다 비용 효율적인 해양 운영을 실현하고 있습니다. 해저 검사, 파이프라인 모니터링, 해상 풍력 발전 설비 유지보수, 수중 자산 평가 등 해양 에너지 관련 활동도 수요 증가에 크게 기여하고 있습니다.
| 시장 범위 | |
|---|---|
| 시작 연도 | 2025년 |
| 예측 기간 | 2026-2035년 |
| 시작 연도 시장 규모 | 35억 달러 |
| 예측 시장 규모 | 108억 달러 |
| CAGR | 11.6% |
수중 차량 카테고리는 2025년 68.6%의 점유율을 차지했으며, 2035년까지 연평균 12.1%의 성장률을 나타낼 것으로 전망됩니다. 이 부문은 국방, 해양 에너지, 과학 탐사, 해저 검사 등의 분야에서 자율 수중 차량(AUV)과 원격 조종 시스템(ROV)의 도입이 증가함에 따라 계속해서 선도적인 위치를 유지하고 있습니다. 이 시스템은 기뢰 감지, 수중 감시, 해저 매핑, 파이프라인 평가, 수로 측량, 해양 데이터 수집 등에 광범위하게 활용되고 있습니다. 심해 및 고위험 환경에서도 사람의 개입을 최소화하면서 효율적으로 운영할 수 있는 능력은 안전성을 높이고, 임무 시간을 연장하며, 데이터 정확도를 향상시켜 군사 및 상업용 해양 활동 모두에 필수적입니다.
완전 자율 주행 부문은 2025년 74%의 점유율을 차지했으며, 2026년부터 2035년까지 연평균 11.8%의 성장률을 나타낼 것으로 전망됩니다. 이러한 우위는 국방, 해양 에너지, 과학 연구 및 상업적 해양 활동에서 지속적인 인간 통제 없이도 기능할 수 있는 자율 해양 시스템에 대한 수요가 증가하고 있기 때문입니다. 자율운항 플랫폼은 원격지나 위험한 해역에서 운영 효율성 향상, 인력 의존도 감소, 임무 수행 능력 확대, 그리고 안전한 운영을 실현합니다. 수중 감시, 대지뢰 작전, 해양 자산 검사, 수로 측량, 환경 모니터링에 대한 활용 확대가 전 세계적으로 보급을 주도하고 있습니다.
미국의 자율운항선박(AMV) 시장은 2025년 83.6%의 점유율을 차지하며 11억 2,730만 달러 시장 규모를 기록했습니다. 지정학적 긴장이 고조되고 해양 상황 인식의 필요성이 증가함에 따라 인간의 개입을 최소화하면서 심해 및 고위험 해역에서 운용할 수 있는 무인 해양 시스템 조달이 증가하고 있습니다. 시장 확대는 인공지능, 소나 영상 처리, 수중 통신 시스템, 자율 내비게이션 기술의 급속한 발전으로 인해 더욱 가속화되고 있습니다. 또한, 해양 에너지 개발 확대, 해양학 연구, 환경 모니터링 프로그램, 자율 주행 해양 차량의 상업적 도입도 강화하고 있습니다. 또한, 방위 관련 기업, 해양 로봇 개발 기업 및 정부 지원 해양 혁신 프로그램의 강력한 존재감은 기술 발전과 국내 시장의 성장을 지속적으로 촉진하고 있습니다.
자주 묻는 질문
목차
제1장 조사 방법
제2장 주요 요약
제3장 업계 인사이트
제4장 경쟁 구도
제5장 시장 추산 및 예측 : 제품 유형별(2022-2035년)
제6장 시장 추산 및 예측 : 유형별(2022-2035년)
제7장 시장 추산 및 예측 : 서브 시스템별(2022-2035년)
제8장 시장 추산 및 예측 : 용도별(2022-2035년)
제9장 시장 추산 및 예측 : 지역별(2022-2035년)
제10장 기업 개요
KTH 26.06.10The Global Autonomous Marine Vehicle Market was valued at USD 3.5 billion in 2025 and is estimated to grow at a CAGR of 11.6% to reach USD 10.8 billion by 2035.
The industry is undergoing a rapid technological shift as maritime operations increasingly adopt automation, driven by rising demand for unmanned ocean missions and continuous improvements in artificial intelligence, sensor fusion, and underwater communication systems. Traditional reliance on crewed vessels is steadily declining as the sector transitions toward autonomous and semi-autonomous platforms capable of executing complex tasks with minimal human input. Modern autonomous marine vehicles integrate sonar systems, satellite connectivity, AI-based navigation, LiDAR, advanced imaging payloads, and real-time monitoring capabilities, significantly improving mission efficiency, operational endurance, and situational awareness across commercial, defense, and scientific applications. Expanding focus on offshore infrastructure monitoring, maritime security enhancement, and ocean data collection is accelerating the deployment of autonomous underwater and surface vehicles. Governments, naval forces, and offshore operators are increasingly investing in intelligent marine systems to reduce operational risks, improve surveillance efficiency, and enable extended missions in remote and hazardous marine environments. In addition, advances in collision avoidance and autonomous navigation technologies are improving safety, lowering manpower dependency, and enabling more cost-efficient marine operations. Offshore energy activities, including subsea inspections, pipeline monitoring, offshore wind maintenance, and underwater asset evaluation, are also significantly contributing to rising demand.
| Market Scope | |
|---|---|
| Start Year | 2025 |
| Forecast Year | 2026-2035 |
| Start Value | $3.5 Billion |
| Forecast Value | $10.8 Billion |
| CAGR | 11.6% |
The underwater vehicle category held a 68.6% share in 2025 and is projected to grow at a CAGR of 12.1% through 2035. This segment remains dominant due to increasing deployment of autonomous underwater vehicles and remotely operated systems across defense, offshore energy, scientific exploration, and subsea inspection applications. These systems are widely used for mine detection operations, underwater surveillance, seabed mapping, pipeline assessment, hydrographic surveying, and oceanographic data acquisition. Their ability to operate efficiently in deep-sea and high-risk environments with minimal human intervention enhances safety, extends mission duration, and improves data precision, making them indispensable in both military and commercial marine operations.
The fully autonomous segment accounted for 74% share in 2025 and is expected to grow at a CAGR of 11.8% between 2026 and 2035. This dominance is attributed to growing demand for independent marine systems that can function without continuous human control across defense, offshore energy, scientific research, and commercial maritime operations. Autonomous platforms deliver higher operational efficiency, reduced workforce dependency, extended mission capability, and safe performance in remote or hazardous marine zones. Their expanding use in underwater surveillance, mine countermeasure operations, offshore asset inspection, hydrographic mapping, and environmental monitoring continue to drive global adoption.
U.S. Autonomous Marine Vehicle Market held an 83.6% share in 2025 generating USD 1,127.3 million. Rising geopolitical tensions and the growing need for maritime situational awareness are driving increased procurement of unmanned marine systems capable of operating in deep and high-risk waters with minimal human involvement. Market expansion is further supported by rapid advancements in artificial intelligence, sonar imaging, underwater communication systems, and autonomous navigation technologies. Expanding offshore energy development, oceanographic research initiatives, and environmental monitoring programs are also strengthening commercial adoption of autonomous marine vehicles. In addition, the strong presence of defense contractors, marine robotics developers, and government-supported maritime innovation programs continues to enhance technological progress and domestic market growth.
Key companies operating in the Global Autonomous Marine Vehicle Market include Kongsberg Maritime, General Dynamics, Teledyne Marine, L3Harris, HII (REMUS), BAE Systems, Thales, Boeing, Lockheed Martin, and Atlas Elektronik. Companies in the autonomous marine vehicle market are focusing on strengthening their competitive position through continuous investment in artificial intelligence integration, advanced sensor fusion, and high-precision navigation systems. Strategic partnerships with defense agencies, offshore energy operators, and research institutions are enabling faster commercialization and wider deployment of autonomous platforms. Firms are also prioritizing modular and scalable vehicle designs to support diverse mission requirements across commercial and military applications. Expanding research and development in battery efficiency, underwater communication, and long-endurance autonomy is improving operational performance. Additionally, companies are adopting cloud-based data analytics and real-time monitoring systems to enhance mission intelligence.
Table of Contents
Chapter 1 Methodology
- 1.1 Research approach
- 1.2 Quality Commitments
- 1.2.1 GMI AI policy & data integrity commitment
- 1.2.1.1 Source consistency protocol
- 1.2.1 GMI AI policy & data integrity commitment
- 1.3 Research Trail & Confidence Scoring
- 1.3.1 Research Trail Components
- 1.3.2 Scoring Components
- 1.4 Data Collection
- 1.4.1 Partial list of primary sources
- 1.5 Data mining sources
- 1.5.1 Paid sources
- 1.5.1.1 Sources, by region
- 1.5.1 Paid sources
- 1.6 Base estimates and calculations
- 1.6.1 Base year calculation
- 1.7 Forecast Model
- 1.7.1 Quantified market impact analysis
- 1.7.1.1 Mathematical impact of growth parameters on forecast
- 1.7.1 Quantified market impact analysis
- 1.8 Research transparency addendum
- 1.8.1 Source attribution framework
- 1.8.2 Quality assurance metrics
- 1.8.3 Our commitment to trust
Chapter 2 Executive Summary
- 2.1 Industry 360° synopsis, 2022 - 2035
- 2.2 Key market trends
- 2.2.1 Regional
- 2.2.2 Product Type
- 2.2.3 Type
- 2.2.4 Sub-system
- 2.2.5 Application
- 2.3 TAM Analysis, 2026-2035
- 2.4 CXO perspectives: Strategic imperatives
Chapter 3 Industry Insights
- 3.1 Industry ecosystem analysis
- 3.1.1 Supplier landscape
- 3.1.2 Profit margin analysis
- 3.1.3 Cost structure
- 3.1.4 Value addition at each stage
- 3.1.5 Factor affecting the value chain
- 3.1.6 Disruptions
- 3.2 Industry impact forces
- 3.2.1 Growth drivers
- 3.2.1.1 Increasing Naval Modernization and Maritime Security Investments
- 3.2.1.2 Growing Demand for Oceanographic and Environmental Monitoring
- 3.2.1.3 Expansion of Offshore Energy Infrastructure
- 3.2.1.4 Advancements in AI, Sensor Fusion, and Autonomous Navigation
- 3.2.2 Industry pitfalls and challenges
- 3.2.2.1 High Development and Deployment Costs
- 3.2.2.2 Limited Underwater Communication Capability.
- 3.2.3 Market opportunities
- 3.2.3.1 Growing Adoption of Autonomous Fleets for Ocean Mapping
- 3.2.3.2 Expansion in Offshore Wind Farm Inspection Services
- 3.2.3.3 Integration of Swarm Robotics and Collaborative Missions
- 3.2.3.4 Rising Smart Ocean and Digital Maritime Initiatives.
- 3.2.1 Growth drivers
- 3.3 Growth potential analysis
- 3.4 Technology and Innovation landscape
- 3.4.1 Current technological trends
- 3.4.2 Emerging technologies
- 3.5 Pricing Analysis (Driven by Primary Research)
- 3.5.1 Historical Price Trend Analysis
- 3.5.2 Pricing Strategy by Player Type (Premium / Value / Cost-plus)
- 3.6 Regulatory guideline
- 3.6.1 North America
- 3.6.1.1 U.S.: U.S. Coast Guard (USCG) Unmanned Maritime Systems Guidelines, Maritime Transportation Security Act (MTSA), NOAA Autonomous
- 3.6.1.2 Canada: Canada Shipping Act, Transport Canada Marine Safety Regulations, Ocean Protection Plan Framework
- 3.6.2 Europe
- 3.6.2.1 Germany: Federal Maritime and Hydrographic Agency (BSH) Maritime Regulations, EU Maritime Safety Agency (EMSA) Autonomous Vessel Framework
- 3.6.2.2 UK: Maritime and Coastguard Agency (MCA) Maritime Autonomy Regulations, UK Marine Safety Code
- 3.6.2.3 France: Code des Transports Maritimes, National Maritime Strategy for Autonomous Navigation
- 3.6.2.4 Italy: Italian Coast Guard Maritime Safety Rules, EU Marine Equipment Directive (MED)
- 3.6.3 Asia Pacific
- 3.6.3.1 China: Maritime Safety Administration (MSA) Smart Shipping Regulations, China Classification Society (CCS) Autonomous Vessel Guidelines
- 3.6.3.2 India: Directorate General of Shipping (DGS) Maritime Regulations, Sagarmala Maritime Modernization Framework
- 3.6.3.3 Japan: Japan Maritime Bureau Autonomous Ship Guidelines, MLIT Smart Navigation Policies
- 3.6.3.4 Australia: Australian Maritime Safety Authority (AMSA) Marine Autonomy Framework, Navigation Act Compliance Standards
- 3.6.4 Latin America
- 3.6.4.1 Brazil: Brazilian Navy Maritime Authority Standards (NORMAM), National Waterway Transportation Policies
- 3.6.4.2 Mexico: Secretariat of the Navy (SEMAR) Maritime Regulations, Federal Marine Navigation Standards
- 3.6.4.3 Argentina: National Naval Prefecture Regulations, Maritime Safety and Navigation Framework
- 3.6.5 MEA
- 3.6.5.1 UAE: UAE Maritime Law, Dubai Maritime City Authority (DMCA) Smart Marine Regulations
- 3.6.5.2 Saudi Arabia: Saudi Ports Authority (MAWANI) Maritime Digitalization Framework, Vision 2030 Maritime Strategy
- 3.6.5.3 South Africa: South African Maritime Safety Authority (SAMSA) Marine Vessel Regulations, National Ports Act
- 3.6.1 North America
- 3.7 PESTEL analysis
- 3.8 Patent Landscape (Driven by Primary Research)
- 3.9 Trade Data Analysis (Based on Paid Database)
- 3.9.1 Import/Export Volume & Value Trends
- 3.9.2 Key Trade Corridors & Tariff Impact
- 3.10 Impact of AI & Generative AI on the Market (Driven by Primary Research)
- 3.10.1 AI-Driven Disruption of Existing Business Models
- 3.10.2 GenAI Use Cases & Adoption Roadmap by Segment
- 3.10.3 Risks, Limitations & Regulatory Considerations
- 3.11 Capacity & Production Landscape (Driven by Primary Research)
- 3.11.1 Production Capacity by Region & Key Producer
- 3.11.2 Capacity Utilization Rates & Expansion Pipelines
- 3.12 Sustainability and environmental aspects
- 3.12.1 Sustainable practices
- 3.12.2 Waste reduction strategies
- 3.12.3 Energy efficiency in production
- 3.12.4 Eco-friendly initiatives
- 3.12.5 Carbon footprint considerations
- 3.13 Forecast assumptions & scenario analysis (Driven by Primary Research)
- 3.13.1 Base Case - Key Macro & Industry Variables Driving CAGR
- 3.13.2 Optimistic Scenarios - Favourable macro and industry tailwinds
- 3.13.3 Pessimistic Scenario - Macroeconomic slowdown or industry headwinds
Chapter 4 Competitive Landscape, 2025
- 4.1 Introduction
- 4.2 Company market share analysis
- 4.2.1 North America
- 4.2.2 Europe
- 4.2.3 Asia Pacific
- 4.2.4 Latin America
- 4.2.5 MEA
- 4.3 Competitive analysis of major market players
- 4.4 Competitive positioning matrix
- 4.5 Key developments
- 4.5.1 Mergers & acquisitions
- 4.5.2 Partnerships & collaborations
- 4.5.3 New Product Launches
- 4.5.4 Expansion Plans and funding
- 4.6 Company Tier Benchmarking
- 4.6.1 Tier Classification Criteria & Qualifying Thresholds
- 4.6.2 Tier Positioning Matrix by Revenue, Geography & Innovation
Chapter 5 Market Estimates & Forecast, By Product Type, 2022 - 2035 ($Bn, Units)
- 5.1 Key trends
- 5.2 Surface vehicles
- 5.3 Underwater vehicles
Chapter 6 Market Estimates & Forecast, By Type, 2022 - 2035 ($Bn, Units)
- 6.1 Key trends
- 6.2 Semi-Autonomous
- 6.3 Autonomous
Chapter 7 Market Estimates & Forecast, By Sub-system, 2022 - 2035 ($Bn, Units)
- 7.1 Key trends
- 7.2 Propulsion
- 7.3 Drive system
- 7.4 Collision avoidance
- 7.5 Payloads & imaging
- 7.6 Communication & navigation
Chapter 8 Market Estimates & Forecast, By Application, 2022 - 2035 ($Bn, Units)
- 8.1 Key trends
- 8.2 Military & defence
- 8.3 Oil & gas
- 8.4 Environment monitoring
- 8.5 Oceanography
- 8.6 Archaeology & exploration
- 8.7 Search & salvage operation
Chapter 9 Market Estimates & Forecast, By Region, 2022 - 2035 ($Bn, Units)
- 9.1 Key trends
- 9.2 North America
- 9.2.1 US
- 9.2.2 Canada
- 9.3 Europe
- 9.3.1 Germany
- 9.3.2 UK
- 9.3.3 France
- 9.3.4 Italy
- 9.3.5 Spain
- 9.3.6 Russia
- 9.3.7 Netherlands
- 9.3.8 Belgium
- 9.4 Asia Pacific
- 9.4.1 China
- 9.4.2 India
- 9.4.3 Japan
- 9.4.4 Australia
- 9.4.5 South Korea
- 9.4.6 Philippines
- 9.4.7 Indonesia
- 9.5 Latin America
- 9.5.1 Brazil
- 9.5.2 Mexico
- 9.5.3 Argentina
- 9.6 MEA
- 9.6.1 South Africa
- 9.6.2 Saudi Arabia
- 9.6.3 UAE
Chapter 10 Company Profiles
- 10.1 Global Players
- 10.1.1 Kongsberg Maritime
- 10.1.2 Teledyne Marine
- 10.1.3 General Dynamics Mission Systems
- 10.1.4 L3Harris Technologies
- 10.1.5 Boeing
- 10.1.6 Saab Seaeye
- 10.1.7 BAE Systems
- 10.1.8 Thales
- 10.1.9 Oceanalpha
- 10.1.10 Exail
- 10.2 Regional Players
- 10.2.1 Huntington Ingalls
- 10.2.2 Lockheed Martin
- 10.2.3 ST Engineering
- 10.2.4 Maritime Robotics
- 10.2.5 Textron Systems
- 10.2.6 Elbit Systems
- 10.2.7 Atlas Elektronik
- 10.2.8 ISE
- 10.2.9 Subsea Tech
- 10.2.10 Yunzhou Tech
- 10.3 Emerging Players
- 10.3.1 Ocean Infinity
- 10.3.2 Sea Machines Robotics
- 10.3.3 Cellula Robotics
- 10.3.4 AutoNaut
- 10.3.5 Seabed BV
