
|
시장보고서
상품코드
2071291
험지용 크레인 시장 : 시장 기회, 성장 촉진요인, 산업 동향 분석, 예측(2026-2035년)Rough Terrain Crane Market Opportunity, Growth Drivers, Industry Trend Analysis, and Forecast 2026 - 2035 |
||||||
세계의 험지용 크레인 시장은 2025년에 28억 달러 규모에 달하고, CAGR 5.7%로 성장하여 2035년까지 48억 달러에 달할 것으로 예측됩니다.
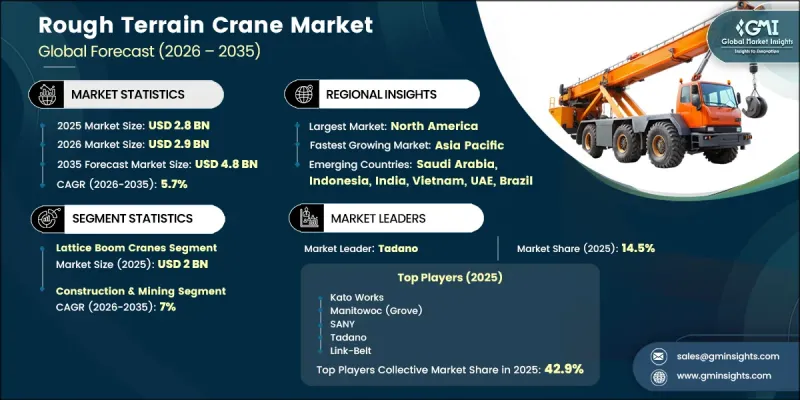
시장 성장을 주도하고 있는 것은, 가혹한 환경에서도 효율적으로 가동할 수 있는 리프팅 장비가 필요한 인프라 개발, 산업 건설, 에너지 프로젝트 및 광업 활동에 대한 투자 증가입니다. 험지용 크레인은 요철이 있는 노면이나 정비 상태가 불충분한 노면에서도 중량물을 들어 올리는 작업을 수행할 수 있는 능력 덕분에, 여전히 강력한 경쟁력을 유지하고 있습니다. 사륜구동 시스템, 높은 최저 지상고, 뛰어난 기동성, 그리고 효율적인 이동성을 갖춘 이 크레인들은 운영상의 유연성이 필수적인 인프라, 에너지, 공공시설 및 산업 프로젝트 분야에서 널리 활용되고 있습니다. 또한, 건설 활동의 확대와 프로젝트 가동 중단 시간을 줄여 생산성을 높일 수 있는 범용성이 높은 리프팅 솔루션에 대한 수요 증가도 시장 수요를 뒷받침하고 있습니다. 프로젝트 소유자가 업무 효율, 장비의 신뢰성, 유지관리 비용 및 인력 확보에 점점 더 중점을 두게 됨에 따라, 구매 결정 기준은 단순한 적재 능력뿐만 아니라 전체 수명 주기에 걸친 가치로 전환되고 있습니다. 이러한 진화하는 조달 방식을 통해 성능 향상, 안전 기능 강화 및 장기적인 운영 비용 절감을 실현하는 기술적으로 선진적인 비포장 도로용 크레인의 도입이 앞으로도 촉진될 것으로 예상됩니다.
| 시장 범위 | |
|---|---|
| 시작 연도 | 2025년 |
| 예측 기간 | 2026-2035년 |
| 초기 시장 규모 | 28억 달러 |
| 시장 규모 예측 | 48억 달러 |
| CAGR | 5.7% |
래티스 붐 크레인 시장은 2035년까지 연평균 성장률(CAGR) 5.1%로 성장할 것으로 전망됩니다. 이러한 선도적인 위상은 뛰어난 리치 대 중량 효율, 장시간 가동 주기에서의 내구성 향상, 그리고 가혹한 리프팅 작업에서 보여주는 뛰어난 성능을 바탕으로 하고 있습니다. 이 크레인들은 특히 높은 리프팅 높이와 중량물 취급 능력이 요구되는 프로젝트에서 높은 평가를 받고 있습니다. 이러한 구조 설계 덕분에 작업자는 안정성과 효율성을 유지하면서 복잡한 리프팅 작업을 수행할 수 있으므로, 대규모 산업 및 인프라 개발 분야에서 선호되는 선택지가 되고 있습니다. 또한, 이 부문은 다른 방법으로는 비용이 더 많이 드는 리프팅 장비가 필요한 작업도 수행할 수 있으므로, 프로젝트 전체의 경제성을 높일 수 있다는 장점도 있습니다.
건설·광업 부문은 연평균 성장률(CAGR) 7%로 성장하여 2035년까지 20억 4,000만 달러에 달할 것으로 전망됩니다. 인프라 개발 프로젝트가 계속해서 큰 수요를 이끌고 있으며, 크레인은 구조물 설치, 자재 취급, 중량 부품 설치에 폭넓게 활용되고 있습니다. 광업 분야에서도 플랜트 건설, 설비 설치, 외딴 지역에서의 대규모 자재 운반 수요를 통해 시장 성장에 더욱 기여하고 있습니다. 이 분야의 수요는 효율성을 높이고, 운영 위험을 줄이며, 반복적인 리프팅 작업 중 생산성을 뒷받침하는 첨단 작업자 지원 기술이 탑재된 대용량 리프팅 솔루션에 점점 더 집중되고 있습니다.
북미의 험지용 크레인 시장은 2035년까지 16억 7,000만 달러에 달하며, 연평균 성장률(CAGR) 4.3%로 성장할 것으로 전망됩니다. 이 지역은 광범위한 인프라 현대화 프로그램, 산업 개발 활동, 그리고 에너지 및 공공시설 프로젝트에 대한 지속적인 투자의 혜택을 누리고 있습니다. 또한, 프로젝트 파이프라인의 확대와 인력 부족 속에서 도급업체들이 크레인 용량을 확보하기 위해 노력하는 가운데, 임대 차량의 가동률 향상과 적극적인 장비 예약 노력도 수요를 뒷받침하고 있습니다. 운송 인프라, 산업 시설, 공공 시설의 업그레이드에 대한 지속적인 투자를 통해, 예측 기간 동안 해당 지역의 시장 성장이 유지될 것으로 전망됩니다.
자주 묻는 질문
목차
제1장 분석 방법과 범위
제2장 주요 요약
제3장 업계 인사이트
제4장 경쟁 구도
제5장 시장 추정 및 예측 : 붐 종류별(2022-2035년)
제6장 시장 추정 및 예측 : 적재 능력별(2022-2035년)
제7장 시장 추정 및 예측 : 추진력별(2022-2035년)
제8장 시장 추정 및 예측 : 용도별(2022-2035년)
제9장 시장 추정 및 예측 : 최종사용자별(2022-2035년)
제10장 시장 추정 및 예측 : 지역별(2022-2035년)
제11장 기업 개요
KSM 26.07.03The Global Rough Terrain Crane Market was valued at USD 2.8 billion in 2025 and is estimated to grow at a CAGR of 5.7% to reach USD 4.8 billion by 2035.

Market growth is driven by rising investments in infrastructure development, industrial construction, energy projects, and mining activities that require lifting equipment capable of operating efficiently in challenging environments. Rough terrain cranes continue to maintain a strong competitive position due to their ability to perform heavy lifting operations on uneven and minimally prepared surfaces. Equipped with four-wheel drive systems, high ground clearance, compact maneuverability, and efficient mobility, these cranes are widely utilized across infrastructure, energy, utility, and industrial projects where operational flexibility is essential. Demand is also being supported by expanding construction activity and the growing need for versatile lifting solutions capable of reducing project downtime and improving productivity. As project owners increasingly focus on operational efficiency, equipment reliability, maintenance costs, and workforce availability, purchasing decisions are shifting beyond lifting capacity alone toward total lifecycle value. This evolving procurement approach is expected to support continued adoption of technologically advanced rough terrain cranes that offer improved performance, enhanced safety features, and lower long-term operating costs.
| Market Scope | |
|---|---|
| Start Year | 2025 |
| Forecast Year | 2026-2035 |
| Start Value | $2.8 Billion |
| Forecast Value | $4.8 Billion |
| CAGR | 5.7% |
The lattice boom crane segment is anticipated to grow at a CAGR of 5.1% through 2035. Its leadership position is supported by superior reach-to-weight efficiency, enhanced durability during prolonged operating cycles, and strong performance in demanding lifting applications. These cranes are particularly valued for projects requiring substantial lift heights and heavy-load handling capabilities. Their structural design enables operators to execute complex lifting operations while maintaining stability and efficiency, making them a preferred choice for large-scale industrial and infrastructure developments. The segment also benefits from its ability to perform tasks that would otherwise require more costly lifting equipment alternatives, improving overall project economics.
The construction and mining segment is forecast to grow at a CAGR of 7%, reaching USD 2.04 billion by 2035. Infrastructure development projects continue to drive substantial demand, with cranes extensively used for structural installation, material handling, and heavy component placement. Mining operations further contribute to market growth through requirements for plant construction, equipment installation, and large-scale material movement in remote environments. Demand within this segment increasingly centers on high-capacity lifting solutions equipped with advanced operator-assistance technologies that improve efficiency, reduce operational risks, and support productivity during repetitive lifting operations.
North America Rough Terrain Crane Market is projected to reach USD 1.67 billion by 2035, growing at a CAGR of 4.3%. The region benefits from extensive infrastructure modernization programs, industrial development activity, and continued investment in energy and utility projects. Demand is also supported by increasing rental fleet utilization and proactive equipment reservation practices as contractors seek to secure lifting capacity amid growing project pipelines and workforce constraints. Ongoing investments in transportation infrastructure, industrial facilities, and utility upgrades are expected to sustain regional market growth throughout the forecast period.
Major players operating in the global rough terrain crane market include XCMG, Tadano, SANY, Manitowoc (Grove), Zoomlion, Link-Belt, and Kato Works. Companies in the rough terrain crane market are strengthening their market position through continuous product innovation focused on lifting efficiency, safety enhancement, and operational reliability. Manufacturers are investing in advanced telematics, predictive maintenance capabilities, and remote monitoring technologies that improve equipment utilization and reduce downtime. Strategic expansion of rental partnerships and dealer networks is helping companies improve customer access and aftersales support across key markets. Businesses are also introducing fuel-efficient and environmentally compliant crane models to align with evolving regulatory standards. Investments in operator-assistance systems, automation features, and digital fleet management solutions are enabling greater productivity and safer jobsite operations.
Table of Contents
Chapter 1 Methodology & Scope
- 1.1 Research approach
- 1.2 Quality Commitments
- 1.2.1 GMI AI policy & data integrity commitment
- 1.2.1.1 Source consistency protocol
- 1.2.1 GMI AI policy & data integrity commitment
- 1.3 Research Trail & Confidence Scoring
- 1.3.1 Research Trail Components
- 1.3.2 Scoring Components
- 1.4 Data Collection
- 1.4.1 Partial list of primary sources
- 1.5 Data mining sources
- 1.5.1 Paid sources
- 1.5.1.1 Sources, by region
- 1.5.1 Paid sources
- 1.6 Base estimates and calculations
- 1.6.1 Base year calculation
- 1.7 Forecast model
- 1.7.1 Quantified market impact analysis
- 1.7.1.1 Mathematical impact of growth parameters on forecast
- 1.7.1 Quantified market impact analysis
- 1.8 Research transparency addendum
- 1.8.1 Source attribution framework
- 1.8.2 Quality assurance metrics
- 1.8.3 Our commitment to trust
Chapter 2 Executive Summary
- 2.1 Industry 360° synopsis
- 2.2 Key market trends
- 2.2.1 Boom Type
- 2.2.2 Lifting Capacity
- 2.2.3 Propulsion
- 2.2.4 Application
- 2.2.5 End-User
- 2.3 TAM Analysis, 2026-2035
- 2.4 CXO perspectives: Strategic imperatives
Chapter 3 Industry Insights
- 3.1 Industry ecosystem analysis
- 3.1.1 Supplier landscape
- 3.1.1.1 Raw material suppliers
- 3.1.1.2 Component suppliers
- 3.1.1.3 Manufacturers
- 3.1.1.4 Service providers
- 3.1.1.5 Distribution channel
- 3.1.1.6 End Use
- 3.1.2 Cost structure
- 3.1.3 Profit margin
- 3.1.4 Value addition at each stage
- 3.1.5 Vertical integration trends
- 3.1.6 Disruptors
- 3.1.1 Supplier landscape
- 3.2 Industry impact forces
- 3.2.1 Growth drivers
- 3.2.1.1 Infrastructure Development Growth
- 3.2.1.2 Expansion of Energy & Industrial Projects
- 3.2.1.3 Off-Road Mobility Advantages
- 3.2.2 Industry pitfalls & challenges
- 3.2.2.1 High Equipment Costs
- 3.2.2.2 Regulatory Compliance Requirements
- 3.2.2.3 Skilled Labor Shortage
- 3.2.3 Market opportunities
- 3.2.3.1 Hybrid and Electric Rough Terrain Crane Adoption
- 3.2.3.2 Telematics-Based Fleet Services
- 3.2.3.3 Asia Pacific Infrastructure Expansion
- 3.2.3.4 Rental Fleet Modernization
- 3.2.1 Growth drivers
- 3.3 Growth potential analysis
- 3.4 Technology and Innovation landscape
- 3.4.1 Current technologies
- 3.4.2 Emerging technologies
- 3.5 Pricing Analysis (Driven by Primary Research)
- 3.5.1 Historical Price Trend Analysis
- 3.5.2 Pricing Strategy by Player Type (Premium / Value / Cost-plus)
- 3.6 Regulatory landscape
- 3.6.1 North America
- 3.6.1.1 OSHA Crane & Derrick Standards
- 3.6.1.2 ASME B30.5 - Mobile & Locomotive Cranes
- 3.6.1.3 NCCCO Crane Operator Certification
- 3.6.1.4 CSA Z150 - Safety Code on Mobile Cranes
- 3.6.2 Europe
- 3.6.2.1 EU Machinery Regulation
- 3.6.2.2 EU Stage V Emission Standards
- 3.6.2.3 EN 13000 - Crane Safety Standard
- 3.6.2.4 LOLER - Lifting Equipment Regulations
- 3.6.3 Asia-Pacific
- 3.6.3.1 GB/T 14560 - Mobile Crane Safety Standard (China)
- 3.6.3.2 CCMA Crane Type Certification (China)
- 3.6.3.3 JCMA Safety Standards (Japan)
- 3.6.3.4 DGFASLI Crane Safety Regulations (India)
- 3.6.3.5 AS 2550.5 - Cranes Safety in Use (Australia)
- 3.6.4 Latin America
- 3.6.4.1 NR-11 & NR-12 Machinery Safety Regulations (Brazil)
- 3.6.4.2 NOM-009-STPS Lifting Equipment Regulations (Mexico)
- 3.6.5 Middle East & Africa
- 3.6.5.1 OSHAD Lifting Operations Code (UAE)
- 3.6.5.2 Saudi Aramco Lifting Equipment Standards
- 3.6.5.3 South Africa Lifting Machinery Regulations (SANS)
- 3.6.1 North America
- 3.7 Porter's analysis
- 3.8 PESTEL analysis
- 3.9 Patent analysis (Driven by Primary Research)
- 3.10 Trade Data Analysis (Driven by paid database)
- 3.10.1 Import/export volume & value trends
- 3.10.2 Key trade corridors & tariff impact
- 3.11 Cost breakdown analysis
- 3.12 Impact of AI & generative AI on the market
- 3.12.1 AI-Driven Disruption of Existing Business Models
- 3.12.2 Automated design optimization
- 3.12.3 Supply chain AI for demand forecasting
- 3.12.4 GenAI use cases & adoption roadmap by segment
- 3.12.5 Risks, Limitations & Regulatory Considerations
- 3.13 Capacity & Production Landscape (Driven by Primary Research)
- 3.13.1 Installed Capacity by Region & Key Producer
- 3.13.2 Capacity Utilization Rates & Expansion Pipelines
- 3.14 Sustainability and environmental aspects
- 3.14.1 Sustainable practices
- 3.14.2 Waste reduction strategies
- 3.14.3 Energy efficiency in production
- 3.14.4 Eco-friendly Initiatives
- 3.14.5 Carbon footprint considerations
- 3.15 Forecast assumptions & scenario analysis (Driven by Primary Research)
- 3.15.1 Base Case - key macro & industry variables driving CAGR
- 3.15.2 Optimistic Scenarios - Favorable Macro and Industry Tailwinds
- 3.15.3 Pessimistic Scenario - Macroeconomic slowdown or industry headwinds
Chapter 4 Competitive Landscape, 2025
- 4.1 Introduction
- 4.2 Company market share analysis
- 4.2.1 North America
- 4.2.2 Europe
- 4.2.3 Asia-Pacific
- 4.2.4 Latin America
- 4.2.5 Middle East & Africa
- 4.3 Competitive positioning matrix
- 4.4 Key developments
- 4.4.1 Mergers & acquisitions
- 4.4.2 Partnerships & collaborations
- 4.4.3 New product launches
- 4.4.4 Expansion plans and funding
- 4.5 Company tier benchmarking
- 4.5.1 Tier classification criteria & qualifying thresholds
- 4.5.2 Tier positioning matrix by revenue, geography & innovation
Chapter 5 Market Estimates & Forecast, By Boom Type, 2022 - 2035 ($Mn, Units)
- 5.1 Key trends
- 5.2 Lattice Boom Cranes
- 5.3 Telescopic Boom Cranes
Chapter 6 Market Estimates & Forecast, By Lifting Capacity, 2022 - 2035 ($Mn, Units)
- 6.1 Key trends
- 6.2 Below 50 Metric Tons
- 6.3 50 to 250 Metric Tons
- 6.4 250 to 450 Metric Tons
- 6.5 Above 450 Metric Tons
Chapter 7 Market Estimates & Forecast, By Propulsion, 2022 - 2035 ($Mn, Units)
- 7.1 Key trends
- 7.2 ICE (Internal Combustion Engine)
- 7.3 Hybrid / Electric
Chapter 8 Market Estimates & Forecast, By Application, 2022 - 2035 ($Mn, Units)
- 8.1 Key trends
- 8.2 Construction & Mining
- 8.3 Utility
- 8.4 Manufacturing
- 8.5 Transport/Shipping
- 8.6 Oil & Gas/Energy
- 8.7 Others
Chapter 9 Market Estimates & Forecast, By End-User, 2022 - 2035 ($Mn, Units)
- 9.1 Key trends
- 9.2 Infrastructure Contractors
- 9.3 Industrial & Manufacturing Facilities
- 9.4 Energy & Utilities Companies
- 9.5 Crane Rental & Service Companies
- 9.6 Others
Chapter 10 Market Estimates & Forecast, By Region, 2022 - 2035 ($Mn, Units)
- 10.1 North America
- 10.1.1 US
- 10.1.2 Canada
- 10.2 Europe
- 10.2.1 UK
- 10.2.2 Germany
- 10.2.3 France
- 10.2.4 Italy
- 10.2.5 Spain
- 10.2.6 Belgium
- 10.2.7 Netherlands
- 10.2.8 Sweden
- 10.2.9 Russia
- 10.3 Asia Pacific
- 10.3.1 China
- 10.3.2 India
- 10.3.3 Japan
- 10.3.4 Australia
- 10.3.5 Singapore
- 10.3.6 South Korea
- 10.3.7 Vietnam
- 10.3.8 Indonesia
- 10.3.9 Thailand
- 10.4 Latin America
- 10.4.1 Brazil
- 10.4.2 Mexico
- 10.4.3 Argentina
- 10.5 MEA
- 10.5.1 South Africa
- 10.5.2 Saudi Arabia
- 10.5.3 UAE
- 10.5.4 Turkey
Chapter 11 Company Profiles
- 11.1 Global Players
- 11.1.1 Kato Works
- 11.1.2 Liebherr
- 11.1.3 Manitowoc (Grove)
- 11.1.4 SANY
- 11.1.5 Tadano
- 11.1.6 Terex
- 11.1.7 XCMG
- 11.1.8 Zoomlion
- 11.2 Regional Players
- 11.2.1 Broderson Manufacturing
- 11.2.2 Escorts Construction Equipment
- 11.2.3 IHI Construction Machinery
- 11.2.4 Kobelco Cranes
- 11.2.5 LGMG
- 11.2.6 Link-Belt Cranes
- 11.2.7 Liugong
- 11.3 Emerging Players / Disruptors
- 11.3.1 Action Construction Equipment (ACE)
- 11.3.2 Franna
- 11.3.3 Fushun Excavating Machinery (FUWA)
- 11.3.4 SINOWAY Industrial
- 11.3.5 TIL

