
|
시장보고서
상품코드
2071319
재생 디젤 시장 기회, 성장요인, 업계 동향 분석 및 예측(2026-2035년)Renewable Diesel Market Opportunity, Growth Drivers, Industry Trend Analysis, and Forecast 2026 - 2035 |
||||||
세계의 재생 디젤 시장은 2025년에 258억 달러 규모에 이르고, CAGR 8.7%로 성장하여 2035년까지 579억 달러에 달할 것으로 추정되고 있습니다.

운송 부문이 여전히 주요 소비 부문인 반면, 항공 및 발전 부문은 높은 성장 잠재력을 지닌 확장 중인 최종 용도 분야로 부상하고 있습니다. 주요 지역의 규제 체계는 장기적인 연료 수요 전망을 명확히 함으로써 투자의 확실성을 높이고 있으며, 이는 신규 발전소 개발과 정유시설 전환 프로젝트 모두를 뒷받침하고 있습니다. 재생 가능 디젤은 혼합 제한 없이 기존 엔진에서 기존 디젤 연료를 직접 대체할 수 있기 때문에 탈탄소화 전략에서 강력한 구조적 우위를 점하고 있습니다. 기존의 급유 인프라와의 호환성 덕분에, 다른 바이오연료에 비해 확장성이 뛰어난 솔루션입니다. 투자 활동은 대규모 바이오 정유시설 및 통합형 정유시설 전환 프로젝트에 점점 더 집중되고 있습니다. 동시에, 물류, 항공, 산업 부문 기업들의 탈탄소화 노력이 계약 기반 수요를 강화하고 있습니다. 그러나 사용 후 식용유나 동물성 지방 등 폐기물 유래 원료에 대한 수요가 지속 가능한 공급 수준을 계속해서 상회하고 있기 때문에 원료 확보에는 여전히 제약이 있습니다.
| 시장 범위 | |
|---|---|
| 개시 연도 | 2025년 |
| 예측 기간 | 2026-2035년 |
| 개시 연도 시장 규모 | 258억 달러 |
| 예측액 | 579억 달러 |
| CAGR | 8.7% |
식물성 오일 부문은 50.9%의 시장 점유율을 차지하고 있으며, 2025년에는 131억 달러에 달하고, 2035년까지 연평균 성장률(CAGR) 6.2%를 나타낼 것으로 예측됩니다. 대체 원료에 비해 성장률은 비교적 낮지만, 여전히 가장 확고하게 자리 잡은 원료 카테고리입니다. 수요 동향은 주요 생산 지역 및 소비 지역의 오랜 조달 구조에 영향을 받고 있으며, 농업 생산량과 산업 처리 능력에 따라 지역별 공급망에서는 각기 다른 유형의 기름이 주류를 이루고 있습니다.
운송 부문은 2035년까지 연평균 성장률(CAGR) 7.7%를 기록하며 성장할 것으로 예측됩니다. 이러한 우위는 재생 가능 디젤이 기존 엔진이나 급유 시스템을 개조할 필요 없이 석유 디젤의 직접적인 대체 연료로 기능할 수 있는 능력에서 비롯됩니다. 이러한 호환성 덕분에 인프라 전환 비용이 대폭 절감되어, 화물 운송, 물류 및 상용차 사업 분야에서 대규모 도입이 촉진될 것입니다.
북미의 재생 가능 디젤 시장은 2025년에 47.9%의 점유율을 차지하고, 시장 규모는 124억 달러에 달하며, 2035년까지 연평균 성장률(CAGR) 8.9%로 성장할 것으로 전망됩니다. 미국은 생산 능력의 대폭적인 확충과 대규모 정유시설의 전환으로 인해 국내 공급량이 크게 증가한 것을 배경으로, 성장의 핵심 거점이 되고 있습니다. 저탄소 연료 인프라에 대한 투자 확대와 강력한 정책 지원에 힘입어, 이 지역의 재생 가능 디젤 생산 및 소비 분야에서 주도적인 위상은 계속해서 공고해지고 있습니다.
자주 묻는 질문
목차
제1장 조사 방법과 범위
제2장 주요 요약
제3장 업계 인사이트
제4장 경쟁 구도
제5장 시장 규모와 예측 : 원료별, 2022년-2035년
제6장 시장 규모와 예측 : 용도별, 2022년-2035년
제7장 시장 규모와 예측 : 생산능력별, 2022년-2035년
제8장 시장 규모와 예측 : 지역별, 2022년-2035년
제9장 기업 개요
LSH 26.07.02The Global Renewable Diesel Market was valued at USD 25.8 billion in 2025 and is estimated to grow at a CAGR of 8.7% to reach USD 57.9 billion by 2035.
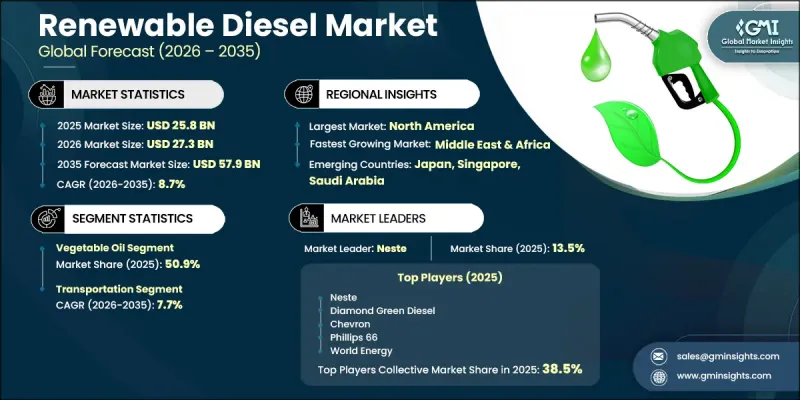
Transportation remains the dominant consumption segment, while aviation and power generation are emerging as expanding end-use areas with strong growth potential. Regulatory frameworks in key regions are improving investment certainty by supporting long-term fuel demand visibility, which is encouraging both new plant development and refinery conversion projects. Renewable diesel is gaining strong structural advantages in decarbonization strategies because it can directly replace conventional diesel in existing engines without blending restrictions. This compatibility with current fueling infrastructure makes it a highly scalable solution compared to other biofuels. Investment activity is increasingly concentrated in large-scale biorefineries and integrated refinery transformation projects. At the same time, corporate decarbonization commitments from logistics, aviation, and industrial sectors are strengthening contracted demand. However, feedstock availability remains constrained as demand for waste-based inputs such as used cooking oil and animal fats continues to exceed sustainable supply levels.
| Market Scope | |
|---|---|
| Start Year | 2025 |
| Forecast Year | 2026-2035 |
| Start Value | $25.8 Billion |
| Forecast Value | $57.9 Billion |
| CAGR | 8.7% |
The vegetable oil segment accounted for 50.9% share, representing USD 13.1 billion in 2025, and is expected to grow at a CAGR of 6.2% through 2035. It remains the most established feedstock category, though its growth rate is comparatively lower than alternative sources. Demand patterns are influenced by long-standing sourcing structures across major producing and consuming regions, where different oil types dominate regional supply chains based on agricultural availability and industrial processing capacity.
The transportation segment is expected to grow at a CAGR of 7.7% by 2035. Its dominance is driven by the ability of renewable diesel to function as a direct substitute for petroleum diesel without requiring modifications to existing engines or fueling systems. This compatibility significantly reduces infrastructure transition costs and supports large-scale adoption across freight, logistics, and commercial vehicle operations.
North America Renewable Diesel Market held a 47.9% share in 2025, valued at USD 12.4 billion, and is projected to grow at a CAGR of 8.9% through 2035. The United States serves as the central growth hub, supported by extensive production capacity additions and large-scale refinery conversions that have significantly increased domestic supply availability. Expanding investment in low-carbon fuel infrastructure and strong policy support continue to reinforce regional leadership in renewable diesel production and consumption.
Major companies operating in the global renewable diesel market include Neste, Chevron, Valero, Marathon Petroleum, Shell, BP, TotalEnergies, Phillips 66, Repsol, Eni, Cargill, World Energy, Diamond Green Diesel, Gevo, LanzaJet, HollyFrontier, Preem AB, Imperial Oil, Petrobras, and Carolina Renewable Products. Companies operating in the renewable diesel market are focusing on scaling production capacity, securing long-term feedstock supply agreements, and expanding refinery conversion projects to strengthen their competitive positioning. A key strategic priority is vertical integration across the value chain, enabling better control over feedstock sourcing, refining processes, and distribution networks. Firms are increasingly investing in advanced hydrotreatment technologies to improve fuel yield efficiency and reduce production costs. Strategic partnerships with airlines, logistics operators, and industrial end users are helping secure long-term offtake agreements and stabilize revenue streams. Companies are also expanding geographically into high-demand regions with supportive policy environments.
Table of Contents
Chapter 1 Methodology & Scope
- 1.1 Research design
- 1.2 Quality commitment
- 1.2.1 GMI AI policy & data integrity commitment
- 1.2.1.1 Source consistency protocol
- 1.2.1 GMI AI policy & data integrity commitment
- 1.3 Research Trail & Confidence Scoring
- 1.3.1 Research Trail Components
- 1.3.2 Scoring Components
- 1.4 Data Collection
- 1.4.1 Partial list of primary sources
- 1.5 Data mining sources
- 1.5.1 Paid sources
- 1.5.1.1 Sources, by region
- 1.5.1 Paid sources
- 1.6 Base estimates and calculations
- 1.6.1 Base year calculation for any one approach
- 1.7 Forecast model
- 1.8 Research transparency addendum
- 1.8.1 Source attribution framework
- 1.8.2 Quality assurance metrics
- 1.8.3 Our commitment to trust
- 1.9 Market definitions
Chapter 2 Executive Summary
- 2.1 Industry synopsis, 2022 - 2035
- 2.2 Business trends
- 2.3 Feedstock trends
- 2.4 Application trends
- 2.5 Capacity trends
- 2.6 Regional trends
Chapter 3 Industry Insights
- 3.1 Industry ecosystem
- 3.1.1 Raw material availability & sourcing analysis
- 3.1.2 Manufacturing capacity assessment
- 3.1.3 Supply chain resilience & risk factors
- 3.1.4 Distribution network analysis
- 3.2 Regulatory landscape
- 3.2.1 North America
- 3.2.2 Europe
- 3.2.3 Asia Pacific
- 3.2.4 Middle East & Africa
- 3.2.5 Latin America
- 3.3 Industry impact forces
- 3.3.1 Growth drivers
- 3.3.2 Industry pitfalls & challenges
- 3.4 Growth potential analysis
- 3.5 Porter's analysis
- 3.5.1 Bargaining power of suppliers
- 3.5.2 Bargaining power of buyers
- 3.5.3 Threat of new entrants
- 3.5.4 Threat of substitutes
- 3.6 PESTEL analysis
- 3.6.1 Political factors
- 3.6.2 Economic factors
- 3.6.3 Social factors
- 3.6.4 Technological factors
- 3.6.5 Legal factors
- 3.6.6 Environmental factors
- 3.7 Cost structure analysis of renewable diesel
- 3.8 Price trend analysis (Driven by Primary Research)
- 3.8.1 By feedstock USD/Ton (Driven by Primary Research)
- 3.8.2 Pricing strategy by player type (Premium / Value / Cost-plus) (Driven by Primary Research)
- 3.9 Trade data analysis (Driven by Primary Research)
- 3.9.1 Import/export value trends (Driven by Primary Research)
- 3.9.2 Key trade corridors & tariff impact (Driven by Primary Research)
- 3.10 Production capacity & utilization (Driven by Primary Research)
- 3.10.1 Production capacity by country (Driven by Primary Research)
- 3.10.2 Utilization rates and expansion pipeline (Driven by Primary Research)
- 3.11 Impact of AI & generative AI on the market
- 3.11.1 Predictive maintenance & fault detection
- 3.11.2 Grid optimization & load forecasting
- 3.11.3 Digital twin simulation & testing
- 3.11.4 Risks, limitations & regulatory considerations
- 3.12 Emerging opportunities & trends
- 3.12.1 Digitalization & IoT integration
- 3.12.2 Emerging market penetration
- 3.13 Overall investment scenario and future outlook
Chapter 4 Competitive landscape, 2026
- 4.1 Introduction
- 4.2 Company market share analysis, by region, 2025
- 4.2.1 North America
- 4.2.2 Europe
- 4.2.3 Asia Pacific
- 4.2.4 Middle East & Africa
- 4.2.5 Latin America
- 4.3 Competitive analysis of major market players
- 4.4 Competitive positioning matrix
- 4.5 Key developments
- 4.5.1 Mergers & acquisitions
- 4.5.2 Partnerships & collaborations
- 4.5.3 New product launches
- 4.5.4 Expansion plans & funding
- 4.6 Company tier benchmarking
- 4.6.1 Tier classification criteria & qualifying thresholds
- 4.6.2 Tier positioning matrix by revenue, geography & innovation
Chapter 5 Market Size and Forecast, By Feedstock, 2022 - 2035 (USD Billion & MT)
- 5.1 Key trends
- 5.2 Animal fat
- 5.3 Vegetable oil
- 5.4 Used cooking oil
- 5.5 Others
Chapter 6 Market Size and Forecast, By Application, 2022 - 2035 (USD Billion & MT)
- 6.1 Key trends
- 6.2 Transportation
- 6.3 Power generation
- 6.4 Aviation
- 6.5 Others
Chapter 7 Market Size and Forecast, By Capacity, 2022 - 2035 (USD Billion & MT)
- 7.1 Key trends
- 7.2 Small scale (<150k tons)
- 7.3 Medium scale (150k-900k tons)
- 7.4 Large scale (>900k tons)
Chapter 8 Market Size and Forecast, By Region, 2022 - 2035 (USD Billion & MT)
- 8.1 Key trends
- 8.2 North America
- 8.2.1 U.S.
- 8.2.2 Canada
- 8.3 Europe
- 8.3.1 Germany
- 8.3.2 France
- 8.3.3 Spain
- 8.3.4 UK
- 8.3.5 Italy
- 8.4 Asia Pacific
- 8.4.1 China
- 8.4.2 India
- 8.4.3 Indonesia
- 8.4.4 Australia
- 8.4.5 Japan
- 8.4.6 Singapore
- 8.5 Middle East & Africa
- 8.5.1 Saudi Arabia
- 8.5.2 South Africa
- 8.6 Latin America
- 8.6.1 Brazil
- 8.6.2 Argentina
Chapter 9 Company Profiles
- 9.1 BP
- 9.2 Cargill
- 9.3 Carolina Renewable Products
- 9.4 Chevron
- 9.5 Diamond Green Diesel
- 9.6 Eni
- 9.7 Gevo
- 9.8 HollyFrontier
- 9.9 Imperial Oil
- 9.10 LanzaJet
- 9.11 Marathon Petroleum
- 9.12 Neste
- 9.13 Petrobras
- 9.14 Phillips 66
- 9.15 Preem AB
- 9.16 Repsol
- 9.17 Shell
- 9.18 TotalEnergies
- 9.19 Valero
- 9.20 World Energy

