
|
시장보고서
상품코드
2071360
정유소 수소 시장 기회, 성장 촉진요인, 산업 동향 분석, 예측(2026-2035년)Petroleum Refinery Hydrogen Market Opportunity, Growth Drivers, Industry Trend Analysis, and Forecast 2026 - 2035 |
||||||
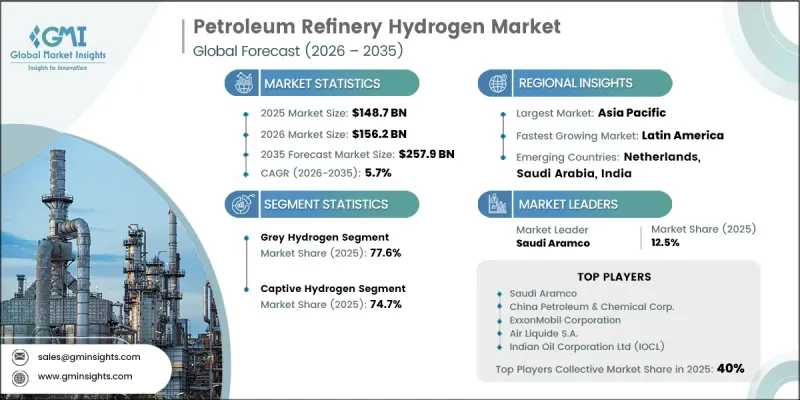
세계의 정유소 수소 시장은 2025년에 1,487억 달러 규모에 달하고, CAGR 5.7%로 성장하여 2035년까지 2,579억 달러에 달할 것으로 추정됩니다.
이러한 성장은 생산 공정의 구조적 전환에 의해 점차 구체화되고 있으며, 탄소 포집형 블루 수소 및 전해형 그린 수소를 포함한 저탄소 수소 공급원의 통합이 진행됨에 따라 밸류체인 전반의 비용 구조가 재편되고 있습니다. 또한, 정유소가 더 엄격한 연료 기준을 채택하고, 지속가능한 항공 연료의 처리 및 바이오연료의 공동 처리를 확대함에 따라 수요는 기존의 탈황 용도를 넘어 확대되고 있으며, 이는 전체 연평균 성장률(CAGR)의 약 25%를 차지하고 있습니다. 전해조의 경제성이 향상되고 있으며, 특히 중국에서는 다른 지역의 kW당 2,000-2,600달러와 비교해 비용이 kW당 600-1,200달러까지 낮아지면서 경쟁력 강화가 가속화되고 있습니다. 이와 동시에, 탄소 포집 시스템과 결합된 자가 가열식 개질 방식이 차세대 블루 수소 생산의 기준점으로 부상하고 있으며, 기존 방식과의 비용 격차가 줄어들고 있습니다.
| 시장 범위 | |
|---|---|
| 시작 연도 | 2025년 |
| 예측 기간 | 2026-2035년 |
| 시작 시점 시장 규모 | 1,487억 달러 |
| 예측액 | 2,579억 달러 |
| CAGR | 5.7% |
2025년에는 그레이 수소 부문이 77.6%의 점유율을 차지했습니다. 이는 증기 메탄 개질(SMR)의 높은 비용 효율성 덕분이며, 그 비용은 일반적으로 1킬로그램당 1-3달러 수준입니다. 대규모 SMR 인프라는 주요 생산 지역의 정유소 생태계에 깊이 통합되어 있으며, 대량의 산업용 수소가 정유소 복합 시설에 직접 통합되어 있습니다.
2025년에는 자사 소비용 수소 생산 부문이 74.7%의 점유율을 차지했습니다. 이는 공급의 신뢰성을 확보하고 가동 관리를 최적화하기 위해 정유소가 현장 생산을 선호하는 경향을 반영한 것입니다. 각 정유소의 수요 특성에 맞춰 설계된 통합형 SMR 유닛과 공정 가스 스트림에 연결된 회수 시스템은 여전히 가장 비용 효율적인 수소 공급 구조를 제공하고 있습니다. 주요 종합 에너지 기업들은 여러 정유소 거점에 걸쳐 상호연결된 수소 시스템을 운영하고 있으며, 이를 통해 생산 거점 간의 수급 균형을 내부적으로 조정할 수 있게 되었습니다.
북미의 정유소 수소 시장은 2025년에 11.2%의 점유율을 차지하며, 연평균 성장률(CAGR) 4.5%로 성장하고 있습니다. 이는 생산능력 확대보다는 현대화에 중점을 둔, 성숙한 정제 기반을 반영한 것입니다. 미국에서는 연간 약 1,000만 메트르톤의 수소가 생산되고 있으며, 그 대부분은 주요 산업 회랑을 따라 집중된 정제 및 암모니아 생산 클러스터 내에서 소비되고 있습니다.
자주 묻는 질문
목차
제1장 조사 방법과 범위
제2장 주요 요약
제3장 업계 인사이트
제4장 경쟁 구도
제5장 시장 규모 및 예측 : 유형별, 2022-2035년
제6장 시장 규모 및 예측 : 제공 모드별, 2022-2035년
제7장 시장 규모 및 예측 : 프로세스별, 2022-2035년
제8장 시장 규모 및 예측 : 지역별, 2021-2032년
제9장 기업 개요
KSMThe Global Petroleum Refinery Hydrogen Market was valued at USD 148.7 billion in 2025 and is estimated to grow at a CAGR of 5.7% to reach USD 257.9 billion by 2035.

Growth is increasingly shaped by a structural transition in production pathways, with rising integration of low-carbon hydrogen sources, including carbon-captured blue hydrogen and electrolytic green hydrogen, reshaping cost structures across the value chain. Demand is also expanding beyond traditional desulfurization use cases as refiners scale adoption of cleaner fuel standards, sustainable aviation fuel processing, and biofuel co-processing, contributing roughly 25% to overall CAGR momentum. Improvements in electrolyzer economics, particularly in China where costs have declined to USD 600-1,200 per kW compared to USD 2,000-2,600 per kW in other regions, are accelerating competitiveness. In parallel, autothermal reforming paired with carbon capture systems is emerging as a benchmark for next-generation blue hydrogen production, narrowing the cost gap with conventional methods.
| Market Scope | |
|---|---|
| Start Year | 2025 |
| Forecast Year | 2026-2035 |
| Start Value | $148.7 Billion |
| Forecast Value | $257.9 Billion |
| CAGR | 5.7% |
The grey hydrogen segment held a 77.6% share in 2025, owing to the cost efficiency of steam methane reforming, which typically ranges between USD 1-3 per kilogram. Large-scale SMR infrastructure is deeply embedded within refinery ecosystems across major producing regions, with extensive industrial hydrogen output integrated directly into refining complexes.
The captive hydrogen production segment accounted for 74.7% share in 2025, reflecting refiners' preference for on-site generation to ensure supply reliability and optimize operational control. Integrated SMR units tailored to refinery-specific demand profiles, along with recovery systems linked to process gas streams, continue to provide the most cost-efficient hydrogen supply structure. Major integrated energy operators maintain interconnected hydrogen systems across multiple refinery sites, enabling internal balancing of supply and demand across production hubs.
North America Petroleum Refinery Hydrogen Market held a 11.2% share in 2025 and is growing at a CAGR of 4.5%, reflecting a mature refining base focused on modernization rather than capacity expansion. The United States produces around 10 million metric tons of hydrogen annually, with most output consumed within refining and ammonia production clusters concentrated along major industrial corridors.
Major players operating in the global petroleum refinery hydrogen market include Saudi Aramco, Linde plc, ExxonMobil Corporation, Air Liquide S.A., Shell plc, BP plc, Chevron Corporation, PetroChina Company Ltd, Indian Oil Corporation Ltd (IOCL), Reliance Industries Ltd, TotalEnergies SE, Air Products and Chemicals, Inc., China Petroleum & Chemical Corp., Kuwait Petroleum Corporation, Petrobras, Equinor ASA, Rosneft Oil Company, ADNOC, Messer Group GmbH, and Taiyo Nippon Sanso Corporation. Companies in the petroleum refinery hydrogen market are strengthening their competitive positioning by expanding investments in low-carbon hydrogen production technologies, particularly blue hydrogen with integrated carbon capture and electrolytic green hydrogen systems. Many are upgrading existing steam methane reforming infrastructure with carbon capture utilization and storage solutions to reduce emissions while preserving cost advantages. Strategic partnerships between refiners and industrial gas suppliers are increasing to secure long-term hydrogen supply agreements and stabilize pricing structures. Companies are also investing in large-scale electrolyzer deployments to diversify production pathways and reduce dependency on natural gas feedstocks. Digitalization of hydrogen networks through advanced monitoring and optimization platforms is improving operational efficiency and load balancing across refinery complexes.
Table of Contents
Chapter 1 Methodology & Scope
- 1.1 Research design
- 1.2 Quality commitment
- 1.2.1 GMI AI policy & data integrity commitment
- 1.2.1.1 Source consistency protocol
- 1.2.1 GMI AI policy & data integrity commitment
- 1.3 Research Trail & Confidence Scoring
- 1.3.1 Research Trail Components
- 1.3.2 Scoring Components
- 1.4 Data Collection
- 1.4.1 Partial list of primary sources
- 1.5 Data mining sources
- 1.5.1 Paid sources
- 1.5.1.1 Sources, by region
- 1.5.1 Paid sources
- 1.6 Base estimates and calculations
- 1.6.1 Base year calculation for any one approach
- 1.7 Forecast model
- 1.8 Research transparency addendum
- 1.8.1 Source attribution framework
- 1.8.2 Quality assurance metrics
- 1.8.3 Our commitment to trust
- 1.9 Market definitions
Chapter 2 Executive Summary
- 2.1 Industry synopsis, 2022 - 2035
- 2.2 Business trends
- 2.3 Type trends
- 2.4 Delivery mode trends
- 2.5 Process trends
- 2.6 Regional trends
Chapter 3 Industry Insights
- 3.1 Industry ecosystem
- 3.1.1 Raw material availability & sourcing analysis
- 3.1.2 Manufacturing capacity assessment
- 3.1.3 Supply chain resilience & risk factors
- 3.1.4 Distribution network analysis
- 3.2 Regulatory landscape
- 3.2.1 North America
- 3.2.2 Europe
- 3.2.3 Asia Pacific
- 3.2.4 Middle East & Africa
- 3.2.5 Latin America
- 3.3 Industry impact forces
- 3.3.1 Growth drivers
- 3.3.2 Industry pitfalls & challenges
- 3.4 Growth potential analysis
- 3.5 Porter's analysis
- 3.5.1 Bargaining power of suppliers
- 3.5.2 Bargaining power of buyers
- 3.5.3 Threat of new entrants
- 3.5.4 Threat of substitutes
- 3.6 PESTEL analysis
- 3.6.1 Political factors
- 3.6.2 Economic factors
- 3.6.3 Social factors
- 3.6.4 Technological factors
- 3.6.5 Legal factors
- 3.6.6 Environmental factors
- 3.7 Cost structure analysis of petroleum refining hydrogen
- 3.8 Impact of AI & generative AI on the market
- 3.8.1 Predictive maintenance & fault detection
- 3.8.2 Grid optimization & load forecasting
- 3.8.3 Digital twin simulation & testing
- 3.8.4 Risks, limitations & regulatory considerations
- 3.9 Emerging opportunities & trends
- 3.9.1 Digitalization & IoT integration
- 3.9.2 Emerging market penetration
- 3.9.3 Carbon capture integration with hydrogen production units
- 3.9.4 Green & blue hydrogen transition roadmap
- 3.10 Overall investment scenario and future outlook
Chapter 4 Competitive landscape, 2026
- 4.1 Introduction
- 4.2 Company market share analysis, by region, 2025
- 4.2.1 North America
- 4.2.2 Europe
- 4.2.3 Asia Pacific
- 4.2.4 Middle East & Africa
- 4.2.5 Latin America
- 4.3 Competitive analysis of major market players
- 4.4 Competitive positioning matrix
- 4.5 Key developments
- 4.5.1 Mergers & acquisitions
- 4.5.2 Partnerships & collaborations
- 4.5.3 New product launches
- 4.5.4 Expansion plans & funding
- 4.6 Company tier benchmarking
- 4.6.1 Tier classification criteria & qualifying thresholds
- 4.6.2 Tier positioning matrix by revenue, geography & innovation
Chapter 5 Market Size and Forecast, By Type, 2022 - 2035 (USD Billion & MT)
- 5.1 Key trends
- 5.2 Grey
- 5.3 Blue
- 5.4 Green
Chapter 6 Market Size and Forecast, By Delivery Mode, 2022 - 2035 (USD Billion & MT)
- 6.1 Key trends
- 6.2 Captive
- 6.3 Merchant
Chapter 7 Market Size and Forecast, By Process, 2022 - 2035 (USD Billion & MT)
- 7.1 Key trends
- 7.2 Steam reforming
- 7.3 Electrolysis
- 7.4 Partial oxidation
- 7.5 Auto-thermal reforming (ATR)
- 7.6 Others
Chapter 8 Market Size and Forecast, By Region, 2021 - 2032 (USD Billion & MT)
- 8.1 Key trends
- 8.2 North America
- 8.2.1 U.S.
- 8.2.2 Canada
- 8.2.3 Mexico
- 8.3 Europe
- 8.3.1 Germany
- 8.3.2 UK
- 8.3.3 France
- 8.3.4 Italy
- 8.3.5 Netherlands
- 8.3.6 Russia
- 8.4 Asia Pacific
- 8.4.1 China
- 8.4.2 Japan
- 8.4.3 India
- 8.4.4 Australia
- 8.5 Middle East & Africa
- 8.5.1 Saudi Arabia
- 8.5.2 Iran
- 8.5.3 UAE
- 8.5.4 South Africa
- 8.5.5 Qatar
- 8.5.6 Kuwait
- 8.6 Latin America
- 8.6.1 Chile
- 8.6.2 Brazil
- 8.6.3 Argentina
Chapter 9 Company Profiles
- 9.1 ADNOC
- 9.2 Air Liquide S.A.
- 9.3 Air Products and Chemicals, Inc.
- 9.4 BP plc
- 9.5 Chevron Corporation
- 9.6 China Petroleum & Chemical Corp.
- 9.7 Equinor ASA
- 9.8 ExxonMobil Corporation
- 9.9 Indian Oil Corporation Ltd (IOCL)
- 9.10 Kuwait Petroleum Corporation
- 9.11 Linde plc
- 9.12 Messer Group GmbH
- 9.13 Petrobras
- 9.14 PetroChina Company Ltd
- 9.15 Reliance Industries Ltd
- 9.16 Rosneft Oil Company
- 9.17 Saudi Aramco
- 9.18 Shell plc
- 9.19 Taiyo Nippon Sanso Corporation
- 9.20 TotalEnergies SE

