|
시장보고서
상품코드
2101603
산업용 검사 서비스 시장 기회, 성장요인, 업계 동향 분석 및 예측(2026-2035년)Industrial Inspection Services Market Opportunity, Growth Drivers, Industry Trend Analysis, and Forecast 2026 - 2035 |
||||||

세계의 산업용 검사 서비스 시장은 2025년에 259억 달러 규모에 달하며, CAGR 5.3%로 성장하며, 2035년까지 518억 달러에 달할 것으로 추정되고 있습니다.
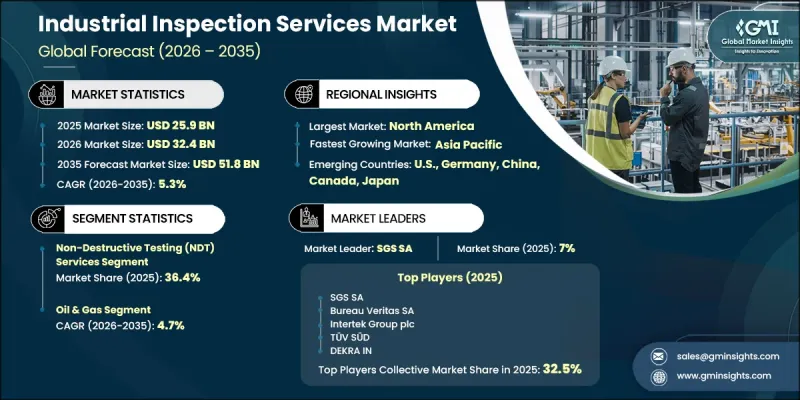
이러한 성장은 자산 건전성 확보에 대한 수요 증가, 인프라 현대화 프로그램의 확대, 그리고 첨단 검사 기술에 대한 의존도 증가에 의해 주도되고 있습니다. 또한 이 업계에서는 디지털화에 기인한 구조적 변화가 진행되고 있으며, 인공지능, 로봇 공학, 예측 분석이 검사 워크플로우에 점점 더 통합됨에 따라 기존의 수작업 검사 방식에 대한 의존도가 낮아지고 있습니다. 이러한 변화로 인해 위험이 높은 산업 환경 전반에서 정확성, 효율성, 안전성이 향상되는 동시에, TIC 생태계 내의 경쟁 환경도 재편되고 있습니다. 선진국 지역의 산업 자산 노후화에 따라 상태 모니터링, 수명 주기 평가 및 사용 적합성 평가에 대한 수요는 계속해서 견고한 추세를 보이고 있습니다. 동시에, 규제 위반에 대한 제재, 가동 중단 및 평판 리스크로 인해 정기 검사 프로그램의 중요성이 더욱 커지고 있습니다. 재생 가능 에너지 시스템, 교통 인프라 및 복잡한 제조 시설에 대한 투자 확대는 세계 시장에서 산업 검사 서비스에 대한 장기적인 수요를 더욱 강화하고 있습니다.
| 시장 범위 | |
|---|---|
| 시작연도 | 2025년 |
| 예측 기간 | 2026-2035년 |
| 개시 금액 | 259억 달러 |
| 예측액 | 518억 달러 |
| CAGR | 5.3% |
비파괴 검사(NDT) 서비스 부문은 2025년에 36.4%의 점유율을 차지하며, 2035년까지 연평균 성장률(CAGR) 5.1%로 성장할 것으로 전망됩니다. 이 부문은 자산에 손상을 주지 않고 구조적 건전성을 평가할 수 있다는 점에서 여전히 가장 널리 채택되고 있는 서비스 범주입니다. 그 적용 범위는 에너지, 항공우주, 건설, 중공업 등 다방면에 걸쳐 있으며, 전 세계에서 가장 범용성이 높은 검사 서비스 범주로 자리 잡고 있습니다. 첨단 조사 기법을 통해 복잡한 검사 환경에서도 그 보급이 지속적으로 지원되고 있습니다.
석유 및 가스 부문은 2025년에 25.7%의 점유율을 차지하며, 2035년까지 연평균 성장률(CAGR) 4.7%로 성장할 것으로 전망됩니다. 이 부문에서는 자산의 건전성과 운영 안전성이 극히 중요한 상류, 중류, 하류 각 사업 분야에서 꾸준한 검사 수요가 지속적으로 창출되고 있습니다. 정기적인 검사 주기, 의무화된 유지보수 절차, 그리고 엄격한 업계 기준 덕분에 생산 시설, 파이프라인, 저장 인프라 전반에 걸쳐 제3자 검사 서비스에 대한 안정적인 수요가 확보되고 있습니다.
북미의 산업 검사 서비스 시장은 2025년에 32.7%의 점유율을 차지하며, 2035년까지 연평균 성장률(CAGR) 4.8%로 성장할 것으로 전망됩니다. 미국은 광범위한 산업 기반과 확립된 규제 준수 체계를 바탕으로 이 지역에서 여전히 가장 큰 기여를 하고 있습니다. 직장 안전 기준 및 인프라 검사 요건의 철저한 시행으로 인해 산업 활동, 운송 시스템, 에너지 인프라 전반에 걸쳐 검사 서비스에 대한 지속적인 수요가 계속해서 지원되고 있습니다.
자주 묻는 질문
목차
제1장 조사 방법과 범위
제2장 개요
제3장 업계 인사이트
제4장 경쟁 구도
제5장 시장 규모·예측 : 서비스별, 2022-2035년
제6장 시장 규모·예측 : 방법별, 2022-2035년
제7장 시장 규모·예측 : 소스별, 2022-2035년
제8장 시장 규모·예측 : 최종 사용별, 2022-2035년
제9장 시장 규모·예측 : 지역별, 2022-2035년
제10장 기업 개요
KSA 26.07.31The Global Industrial Inspection Services Market was valued at USD 25.9 billion in 2025 and is estimated to grow at a CAGR of 5.3% to reach USD 51.8 billion by 2035.
Growth is shaped by the rising need for asset integrity assurance, expanding infrastructure modernization programs, and increasing reliance on advanced inspection technologies. The industry is also experiencing a structural transformation driven by digitalization, where artificial intelligence, robotics, and predictive analytics are increasingly integrated into inspection workflows, reducing dependence on traditional manual inspection methods. This shift is improving accuracy, efficiency, and safety across high-risk industrial environments while reshaping competitive dynamics within the TIC ecosystem. Aging industrial assets across developed regions continue to generate sustained demand for condition monitoring, lifecycle assessment, and fitness-for-service evaluations. At the same time, regulatory penalties for noncompliance, operational disruptions, and reputational risks are reinforcing the importance of routine inspection programs. Expanding investment in renewable energy systems, transportation infrastructure, and complex manufacturing facilities is further strengthening long-term demand for industrial inspection services across global markets.
| Market Scope | |
|---|---|
| Start Year | 2025 |
| Forecast Year | 2026-2035 |
| Start Value | $25.9 Billion |
| Forecast Value | $51.8 Billion |
| CAGR | 5.3% |
The non-destructive testing (NDT) services segment accounted for 36.4% share in 2025 and is projected to grow at a CAGR of 5.1% through 2035. This segment remains the most widely adopted service category due to its ability to evaluate structural integrity without causing damage to assets. Its applications span multiple industries, including energy, aerospace, construction, and heavy manufacturing, making it the most versatile inspection service category globally. Advanced testing methodologies continue to support their widespread adoption across complex inspection environments.
The oil and gas sector represented 25.7% share in 2025 and is projected to grow at a CAGR of 4.7% through 2035. The sector continues to generate steady inspection demand across upstream, midstream, and downstream operations, where asset integrity and operational safety are critical. Regular inspection cycles, mandated maintenance protocols, and strict industry standards ensure consistent demand for third-party inspection services across production facilities, pipelines, and storage infrastructure.
North America Industrial Inspection Services Market held 32.7% share in 2025 and is expected to grow at a CAGR of 4.8% through 2035. The United States remains the largest contributor in the region due to its extensive industrial base and well-established regulatory compliance structure. Strong enforcement of workplace safety standards and infrastructure inspection requirements continues to support sustained demand for inspection services across industrial operations, transportation systems, and energy infrastructure.
Major companies operating in the global industrial inspection services market include Bureau Veritas SA, SGS SA, Intertek Group plc, DNV AS, TUV SUD, TUV Rheinland, Applus+, MISTRAS Group, Element Materials Technology, DEKRA India, ALS Limited, Kiwa Global, UL Solutions, RINA S.p.A., Lloyd's Register, Eurofins Scientific, Baker Hughes Company, ABS Group, SOCOTEC, Acuren, ROSEN, Oceaneering International, OCA Global Corporate Service, Petrocap, BIISCorp, and Ashtead Technology. Companies operating in the industrial inspection services market are strengthening their competitive position through the adoption of advanced digital inspection technologies, expansion of AI-driven analytics capabilities, and integration of robotics into inspection workflows. Service providers are increasingly focusing on predictive maintenance solutions, real-time asset monitoring, and automated defect detection systems to improve accuracy and reduce operational downtime. Strategic partnerships with industrial operators and infrastructure owners are enabling long-term service contracts and recurring revenue streams. Companies are also investing in workforce training, certification expansion, and multi-industry service diversification to enhance technical capabilities. Geographic expansion into high-growth industrial regions, combined with acquisitions of niche inspection firms, is further strengthening market reach.
Table of Contents
Chapter 1 Methodology & Scope
- 1.1 Research approach
- 1.2 Quality commitments
- 1.2.1 GMI AI policy & data integrity commitment
- 1.2.1.1 Source consistency protocol
- 1.2.1 GMI AI policy & data integrity commitment
- 1.3 Research trail & confidence scoring
- 1.3.1 Research trail components
- 1.3.2 Scoring components
- 1.4 Data collection
- 1.4.1 Partial list of primary sources
- 1.5 Data mining sources
- 1.5.1 Paid sources
- 1.5.1.1 Sources, by region
- 1.5.1 Paid sources
- 1.6 Base estimates and calculations
- 1.6.1 Base year calculation for any one approach
- 1.7 Market estimates & forecasts parameters
- 1.8 Forecast model
- 1.8.1 Quantified market impact analysis
- 1.8.1.1 Mathematical impact of growth parameters on forecast
- 1.8.1 Quantified market impact analysis
- 1.9 Research transparency addendum
- 1.9.1 Source attribution framework
- 1.9.2 Quality assurance metrics
- 1.9.3 Our commitment to trust
- 1.10 Market definitions
Chapter 2 Executive Summary
- 2.1 Industry synopsis, 2022 - 2035
- 2.1.1 Business trends
- 2.1.2 Service trends
- 2.1.3 Method trends
- 2.1.4 Sourcing trends
- 2.1.5 End use trends
- 2.1.6 Regional trends
Chapter 3 Industry Insights
- 3.1 Industry ecosystem analysis
- 3.1.1 Raw material availability & sourcing analysis
- 3.1.2 Manufacturing capacity assessment
- 3.1.3 Supply chain resilience & risk factors
- 3.1.4 Distribution network analysis
- 3.2 Industry impact forces
- 3.2.1 Growth drivers
- 3.2.2 Industry pitfalls & challenges
- 3.3 Regulatory landscape
- 3.4 Growth potential analysis
- 3.5 Porter's analysis
- 3.5.1 Bargaining power of suppliers
- 3.5.2 Bargaining power of buyers
- 3.5.3 Threat of new entrants
- 3.5.4 Threat of substitutes
- 3.6 PESTEL analysis
- 3.6.1 Political factors
- 3.6.2 Economic factors
- 3.6.3 Social factors
- 3.6.4 Technological factors
- 3.6.5 Legal factors
- 3.6.6 Environmental factors
- 3.7 Cost structure analysis of industrial inspection services
- 3.8 Technology & market developments
- 3.9 Smart inspection & digital integration
- 3.10 Emerging applications & regional expansion
- 3.11 Investment trends & market outlook
- 3.12 Impact of AI & Generative AI on the market (Driven by Primary Research)
- 3.12.1 AI-Driven production optimization (Driven by Primary Research)
- 3.12.2 Predictive maintenance & fault detection (Driven by Primary Research)
Chapter 4 Competitive Landscape, 2026
- 4.1 Introduction
- 4.2 Company market share analysis, by region, 2025
- 4.2.1 North America
- 4.2.2 Europe
- 4.2.3 Asia Pacific
- 4.2.4 Middle East & Africa
- 4.2.5 Latin America
- 4.3 Competitive analysis of major market players
- 4.4 Competitive positioning matrix
- 4.5 Key developments
- 4.5.1 Mergers & acquisitions
- 4.5.2 Partnerships & collaborations
- 4.5.3 New product launches
- 4.5.4 Expansion plans & funding
- 4.6 Company tier benchmarking
- 4.6.1 Tier classification criteria & qualifying thresholds
- 4.6.2 Tier positioning matrix by revenue, geography & innovation
Chapter 5 Market Size and Forecast, By Service, 2022 - 2035 (USD Million)
- 5.1 Key trends
- 5.2 Non-destructive testing (NDT) services
- 5.3 Visual & remote inspection services
- 5.4 Condition monitoring & predictive maintenance services
- 5.5 Pipeline & subsea inspection services
- 5.6 Asset integrity management services
- 5.7 Corrosion monitoring & thickness measurement services
- 5.8 Others
Chapter 6 Market Size and Forecast, By Method, 2022 - 2035 (USD Million)
- 6.1 Key trends
- 6.2 Manual
- 6.3 Automated
- 6.4 Remote & robotic
Chapter 7 Market Size and Forecast, By Sourcing, 2022 - 2035 (USD Million)
- 7.1 Key trends
- 7.2 In-house
- 7.3 Outsourced
Chapter 8 Market Size and Forecast, By End Use, 2022 - 2035 (USD Million)
- 8.1 Key trends
- 8.2 Oil & gas
- 8.3 Manufacturing
- 8.4 Chemicals & petrochemicals
- 8.5 Power Generation & utilities
- 8.6 Aerospace & defense
- 8.7 Automotive
- 8.8 Mining & metals
- 8.9 Construction & infrastructure
- 8.10 Marine & shipbuilding
- 8.11 Others
Chapter 9 Market Size and Forecast, By Region, 2022 - 2035 (USD Million)
- 9.1 Key trends
- 9.2 North America
- 9.2.1 U.S.
- 9.2.2 Canada
- 9.2.3 Mexico
- 9.3 Europe
- 9.3.1 Germany
- 9.3.2 UK
- 9.3.3 France
- 9.3.4 Italy
- 9.3.5 Spain
- 9.3.6 Netherlands
- 9.3.7 Denmark
- 9.3.8 Sweden
- 9.4 Asia Pacific
- 9.4.1 China
- 9.4.2 Japan
- 9.4.3 India
- 9.4.4 South Korea
- 9.4.5 Australia
- 9.4.6 Indonesia
- 9.4.7 Thailand
- 9.4.8 Malaysia
- 9.5 Middle East & Africa
- 9.5.1 Saudi Arabia
- 9.5.2 UAE
- 9.5.3 Qatar
- 9.5.4 Egypt
- 9.5.5 South Africa
- 9.5.6 Nigeria
- 9.6 Latin America
- 9.6.1 Brazil
- 9.6.2 Argentina
- 9.6.3 Chile
Chapter 10 Company Profiles
- 10.1 ABS Group
- 10.2 Acuren
- 10.3 ALS Limited
- 10.4 Applus+
- 10.5 Ashtead Technology
- 10.6 Baker Hughes Company
- 10.7 Bureau Veritas SA
- 10.8 BIISCorp
- 10.9 DEKRA IN
- 10.10 DNV AS
- 10.11 Element Materials Technology
- 10.12 Eurofins Scientific
- 10.13 Intertek Group plc
- 10.14 Kiwa Global
- 10.15 Lloyd's Register
- 10.16 MISTRAS Group
- 10.17 OCA Global Corporate Service
- 10.18 Oceaneering International
- 10.19 Petrocap
- 10.20 RINA S.p.A.
- 10.21 ROSEN
- 10.22 SGS SA
- 10.23 SOCOTEC
- 10.24 TUV Rheinland
- 10.25 TUV SUD
- 10.26 UL Solutions