

|
시장보고서
상품코드
2109280
스마트 건설기계 시장 : 시장 비즈니스 기회, 성장요인, 업계 동향 분석 및 예측(2026-2035년)Smart Construction Equipment Market Opportunity, Growth Drivers, Industry Trend Analysis, and Forecast 2026 - 2035 |
||||||

세계의 스마트 건설기계 시장은 2025년에 366억 달러 규모로 평가되었고, CAGR 8.6%로 성장할 전망이며, 2030년에는 857억 달러에 이를 것으로 예측됩니다.
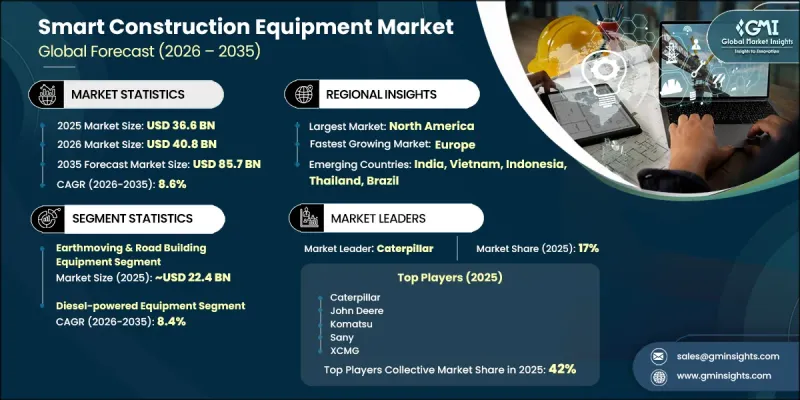
이 시장의 확대는 자동화, 전동화, 인공지능 및 커넥티드 장비 솔루션의 도입 확대에 힘입고 있습니다. 건설사들은 생산성 향상, 운영 비용 절감, 안전성 제고 및 자원 활용 최적화를 위해 스마트 기계에 대한 투자를 점점 더 늘리고 있습니다. 자율 주행 건설 기계의 기능은 기존의 용도를 넘어 확대되고 있으며, 한편 전기 구동 시스템과 AI를 활용한 진단 기능은 건설 기계 구매 결정에 영향을 미치는 중요한 요소로 자리 잡고 있습니다. 또한, 스마트 기술의 통합을 통해 데이터 기반의 차량 관리, 예측 유지보수, 그리고 건설 프로젝트 전반에 걸친 업무 효율 향상 기회도 창출되고 있습니다. 건설 업계 전반에서 디지털 전환이 가속화되는 가운데, 스마트 건설 기계는 단순한 선진적인 선택지에서 현대 건설 업무에 있어 점점 더 필수적인 요소로 전환되고 있습니다.
| 시장 범위 | |
|---|---|
| 개시 연도 | 2025년 |
| 예측 기간 | 2026-2035년 |
| 개시 연도 시장 규모 | 366억 달러 |
| 예측액 | 857억 달러 |
| CAGR | 8.6% |
토공·도로 건설용 장비 부문은 61.1%의 점유율을 차지하며, 2025년에는 224억 달러 시장 규모를 기록했습니다. 해당 부문은 2035년까지 연평균 성장률(CAGR) 8%를 나타낼 것으로 예측됩니다. 이 부문의 확고한 입지는 인프라 개발 및 자원 채굴 활동에서 굴삭기, 그레이더, 로더, 덤프트럭, 포장 장비가 널리 활용되고 있는 데서 비롯됩니다. 텔레매틱스, 자율주행 시스템, 정밀 제어 솔루션 등의 디지털 기술 통합을 통해 기계 성능이 향상되어 생산성 측면에서 뚜렷한 이점을 가져오고 있습니다. 효율적인 프로젝트 수행 및 건설 워크플로우 최적화에 대한 수요가 증가함에 따라 토목·도로 건설 기계 전반에 걸쳐 스마트 기능 도입이 지속적으로 촉진되고 있습니다.
디젤 구동 장비 부문은 92%의 점유율을 차지하며, 2025년에는 336억 달러 시장 규모를 기록했습니다. 디젤 기계는 정평이 난 신뢰성, 높은 출력, 그리고 장시간 가동 주기와 가혹한 작업 부하가 요구되는 까다로운 건설 환경에 대한 적응성 덕분에 계속해서 시장을 독점하고 있습니다. 대체 추진 기술이 주목받고 있음에도 불구하고, 기존 인프라의 정비 현황과 가혹한 가동 조건에서의 성능적 우위 덕분에 대규모 용도에서는 여전히 디젤 구동 기계가 널리 선호되고 있습니다.
북미의 스마트 건설기계 시장은 2025년에 127억 달러에 달한 것으로 평가되었으며, 2035년까지 연평균 성장률(CAGR) 7.1%를 기록하며 259억 달러 규모로 성장할 것으로 전망됩니다. 이 지역의 성장은 교통 인프라, 공공 건설 프로젝트 및 기술 주도형 장비 업그레이드에 대한 지속적인 투자에 힘입고 있습니다. 정부가 지원하는 인프라 구축 노력에 따라 건설업체들은 자동화, 연결성, 디지털 모니터링 기능을 갖춘 첨단 기계의 도입을 촉진하고 있으며, 이는 전미에서 스마트 건설 기계에 대한 지속적인 수요를 창출하고 있습니다.
자주 묻는 질문
목차
제1장 조사 방법 및 범위
제2장 주요 요약
제3장 업계 인사이트
제4장 경쟁 구도
제5장 시장 추산 및 예측 : 기기별(2022-2035년)
제6장 시장 추산 및 예측 : 추진력별(2022-2035년)
제7장 시장 추산 및 예측 : 기술별(2022-2035년)
제8장 시장 추산 및 예측 : 자율성 레벨별(2022-2035년)
제9장 시장 추산 및 예측 : 용도별(2022-2035년)
제10장 시장 추산 및 예측 : 최종 용도별(2022-2035년)
제11장 시장 추산 및 예측 : 지역별(2022-2035년)
제12장 기업 개요
AJY 26.08.18The Global Smart Construction Equipment Market was valued at USD 36.6 billion in 2025 and is estimated to grow at a CAGR of 8.6% to reach USD 85.7 billion in 3025.
The market expansion is supported by the rising adoption of automation, electrification, artificial intelligence, and connected equipment solutions. Construction companies are increasingly investing in intelligent machinery to improve productivity, reduce operating costs, enhance safety, and optimize resource utilization. Autonomous equipment capabilities are expanding beyond traditional applications, while electric powertrains and AI-based diagnostics are becoming important factors influencing equipment purchasing decisions. The integration of smart technologies is also creating opportunities for data-driven fleet management, predictive maintenance, and improved operational efficiency across construction projects. As digital transformation accelerates throughout the construction sector, smart equipment is shifting from an advanced option to an increasingly essential component of modern construction operations.
| Market Scope | |
|---|---|
| Start Year | 2025 |
| Forecast Year | 2026-2035 |
| Start Value | $36.6 Billion |
| Forecast Value | $85.7 Billion |
| CAGR | 8.6% |
The earthmoving and road building equipment segment held a 61.1% share, generating USD 22.4 billion in 2025. The segment is projected to grow at a CAGR of 8% through 2035. The strong position of this category is supported by the widespread use of excavators, graders, loaders, dump trucks, and paving equipment in infrastructure development and resource extraction activities. The integration of digital technologies such as telematics, automated operation systems, and precision control solutions is improving equipment performance and delivering measurable productivity benefits. Increasing demand for efficient project execution and optimized construction workflows continues to support the adoption of smart features across earthmoving and road construction machinery.
The diesel-powered equipment segment held a 92% share, generating USD 33.6 billion in 2025. Diesel machinery continues to dominate due to its established reliability, high power output, and suitability for demanding construction environments where extended operating cycles and heavy workloads are required. Although alternative propulsion technologies are gaining attention, diesel-powered machines remain widely preferred for large-scale applications due to existing infrastructure availability and performance advantages in challenging operating conditions.
North America Smart Construction Equipment Market reached USD 12.7 billion in 2025 and is projected to grow to USD 25.9 billion by 2035 at a CAGR of 7.1%. Growth in the region is supported by ongoing investments in transportation infrastructure, public construction projects, and technology-driven equipment upgrades. Government-supported infrastructure initiatives are encouraging contractors to adopt advanced machinery equipped with automation, connectivity, and digital monitoring capabilities, creating sustained demand for smart construction equipment across the country.
Major players operating in the global smart construction equipment industry are Volvo CE, Caterpillar, XCMG, Komatsu, John Deere, Liebherr, Sany, Shantui, Tadano, and Zoomlion. Companies operating in the smart construction equipment market are focusing on product innovation, digital transformation, strategic collaborations, and technology integration to strengthen their competitive position. Leading manufacturers are investing in autonomous machinery, artificial intelligence-based monitoring systems, electrified equipment platforms, and advanced telematics solutions to meet evolving customer requirements. Businesses are also enhancing their service portfolios by offering connected fleet management solutions, predictive maintenance capabilities, and data-driven operational support. Strategic partnerships with technology providers and investments in research and development are helping companies accelerate the deployment of next-generation construction equipment.
Table of Contents
Chapter 1 Methodology & Scope
- 1.1 Research approach
- 1.2 Quality Commitments
- 1.2.1 GMI AI policy & data integrity commitment
- 1.2.1.1 Source consistency protocol
- 1.2.1 GMI AI policy & data integrity commitment
- 1.3 Research Trail & Confidence Scoring
- 1.3.1 Research Trail Components
- 1.3.2 Scoring Components
- 1.4 Data Collection
- 1.4.1 Partial list of primary sources
- 1.5 Data mining sources
- 1.5.1 Paid sources
- 1.5.1.1 Sources, by region
- 1.5.1 Paid sources
- 1.6 Base estimates and calculations
- 1.6.1 Base year calculation
- 1.7 Forecast
- 1.7.1 Quantified market impact analysis
- 1.7.1.1 Mathematical impact of growth parameters on forecast
- 1.7.1 Quantified market impact analysis
- 1.8 Research transparency addendum
- 1.8.1 Source attribution framework
- 1.8.2 Quality assurance metrics
- 1.8.3 Our commitment to trust
Chapter 2 Executive Summary
- 2.1 Industry 360° synopsis
- 2.2 Key market trends
- 2.2.1 Regional
- 2.2.2 Equipment
- 2.2.3 Propulsion
- 2.2.4 Technology
- 2.2.5 Level of Autonomy
- 2.2.6 Application
- 2.2.7 End Use
- 2.3 TAM Analysis, 2026-2035
- 2.4 CXO perspectives: Strategic imperatives
Chapter 3 Industry Insights
- 3.1 Industry ecosystem analysis
- 3.1.1 Supplier landscape
- 3.1.1.1 Raw material suppliers
- 3.1.1.2 Component suppliers
- 3.1.1.3 Manufacturers
- 3.1.1.4 Service providers
- 3.1.1.5 Distribution channel
- 3.1.1.6 End Use
- 3.1.2 Cost structure
- 3.1.3 Profit margin
- 3.1.4 Value addition at each stage
- 3.1.5 Vertical integration trends
- 3.1.6 Disruptors
- 3.1.1 Supplier landscape
- 3.2 Industry impact forces
- 3.2.1 Growth drivers
- 3.2.1.1 Skilled labor shortage driving automation
- 3.2.1.2 Rising infrastructure investments
- 3.2.1.3 Stricter jobsite safety regulations
- 3.2.1.4 Declining cost of IoT and connectivity technologies
- 3.2.2 Market Restraints
- 3.2.2.1 High upfront equipment costs
- 3.2.2.2 Limited digital infrastructure in remote and emerging markets
- 3.2.3 Market Opportunities
- 3.2.3.1 Growing adoption of electric and hybrid equipment
- 3.2.3.2 Expanding retrofit market for legacy equipment
- 3.2.3.3 Emergence of Equipment-as-a-Service (EaaS) models
- 3.2.1 Growth drivers
- 3.3 Growth potential analysis
- 3.4 Technology and Innovation landscape
- 3.4.1 Current technologies
- 3.4.1.1 IoT-enabled telematics and fleet management
- 3.4.1.2 GPS/GNSS and 3D machine control systems
- 3.4.1.3 AI-assisted operator support and machine guidance
- 3.4.1.4 Electrohydraulic control systems
- 3.4.1.5 Predictive maintenance and remote diagnostics
- 3.4.2 Emerging technologies
- 3.4.2.1 Fully autonomous and semi-autonomous construction equipment
- 3.4.2.2 AI-powered predictive analytics and decision intelligence
- 3.4.2.3 Digital twin technology for equipment and jobsite management
- 3.4.2.4 Robotics and autonomous fleet coordination
- 3.4.2.5 Edge computing and 5G-enabled connected construction ecosystems
- 3.4.1 Current technologies
- 3.5 Pricing Analysis (Driven by Primary Research)
- 3.5.1 Historical Price Trend Analysis
- 3.5.2 Pricing Strategy by Player Type (Premium / Value / Cost-plus)
- 3.6 Regulatory guidelines
- 3.6.1 North America
- 3.6.1.1 Environmental Protection Agency (EPA) – Tier 4 Final Emission Standards
- 3.6.1.2 Occupational Safety and Health Administration (OSHA)
- 3.6.1.3 Federal Communications Commission (FCC)
- 3.6.1.4 National Institute of Standards and Technology (NIST) Cybersecurity Framework
- 3.6.1.5 Canadian Centre for Occupational Health and Safety (CCOHS)
- 3.6.2 Europe
- 3.6.2.1 EU Machinery Regulation (EU) 2023/1230
- 3.6.2.2 CE Marking Compliance
- 3.6.2.3 EU Stage V Non-Road Mobile Machinery (NRMM) Emission Regulation
- 3.6.2.4 General Data Protection Regulation (GDPR)
- 3.6.2.5 Radio Equipment Directive (RED)
- 3.6.3 Asia Pacific
- 3.6.3.1 China Non-Road Stage IV Emission Standards
- 3.6.3.2 China Compulsory Certification (CCC)
- 3.6.3.3 India CEV Stage V Emission Norms
- 3.6.3.4 Japanese Industrial Standards (JIS)
- 3.6.3.5 Australian Work Health and Safety (WHS) Regulations
- 3.6.4 Latin America
- 3.6.4.1 Brazilian National Institute of Metrology (INMETRO)
- 3.6.4.2 Brazilian Institute of Environment and Renewable Natural Resources (IBAMA)
- 3.6.4.3 Mexican Official Standards (NOM)
- 3.6.4.4 National Occupational Safety Regulations
- 3.6.5 MEA
- 3.6.5.1 GCC Standardization Organization (GSO)
- 3.6.5.2 Saudi Standards, Metrology and Quality Organization (SASO)
- 3.6.5.3 UAE Ministry of Industry & Advanced Technology (MoIAT)
- 3.6.1 North America
- 3.7 Trade data analysis (Driven by Paid Research)
- 3.7.1 Import/export volume & value trends
- 3.7.2 Key trade corridors & tariff impact
- 3.8 Capacity & production landscape (Driven by Primary Research)
- 3.8.1 Installed capacity by region & key producer
- 3.8.2 Capacity utilization rates & expansion pipelines
- 3.9 Cost breakdown analysis
- 3.10 Patent analysis (Driven by Primary Research)
- 3.11 Porter’s analysis
- 3.12 PESTEL analysis
- 3.13 Impact of AI & generative AI on the market
- 3.13.1 AI-driven disruption of existing business models
- 3.13.2 GenAI use cases & adoption roadmap by segment
- 3.13.3 Risks, limitations & regulatory considerations
- 3.14 Sustainability and environmental aspects
- 3.14.1 Sustainable practices
- 3.14.2 Waste reduction strategies
- 3.14.3 Energy efficiency in production
- 3.14.4 Eco-friendly Initiatives
- 3.14.5 Carbon footprint considerations
- 3.15 Forecast assumptions & scenario analysis (Driven by Primary Research)
- 3.15.1 Base Case key macro & industry variables driving CAGR
- 3.15.2 Optimistic Scenarios Favorable macro and industry tailwinds
- 3.15.3 Pessimistic Scenario Macroeconomic slowdown or industry headwinds
Chapter 4 Competitive Landscape, 2025
- 4.1 Introduction
- 4.2 Company market share analysis, (Value and Volume), 2022-2025
- 4.2.1 North America
- 4.2.2 Europe
- 4.2.3 Asia-Pacific
- 4.2.4 Latin America
- 4.2.5 Middle East & Africa
- 4.3 Top 10 Company production & sales analysis, 2022-2035
- 4.4 Competitive positioning matrix
- 4.5 Key developments
- 4.5.1 Mergers & acquisitions
- 4.5.2 Partnerships & collaborations
- 4.5.3 New product launches
- 4.5.4 Expansion plans and funding
- 4.6 Company tier benchmarking
- 4.6.1 Tier classification criteria & qualifying thresholds
- 4.6.2 Tier positioning matrix by revenue, geography & innovation
Chapter 5 Market Estimates & Forecast, By Equipment, 2022 - 2035 ($Mn, Units)
- 5.1 Key trends
- 5.2 Earthmoving & Road Building Equipment
- 5.2.1 Excavators
- 5.2.2 Backhoe Loaders
- 5.2.3 Loaders
- 5.2.4 Motor Graders
- 5.2.5 Dump Trucks
- 5.2.6 Asphalt Pavers
- 5.2.7 Compaction Equipment
- 5.2.8 Others
- 5.3 Material Handling & Cranes
- 5.3.1 Crane Systems
- 5.3.2 Industrial Trucks
- 5.3.3 Bulk Material Handling Equipment
- 5.3.4 Storage & Handling Equipment
- 5.3.5 Others
- 5.4 Concrete Equipment
- 5.4.1 Concrete Pumps
- 5.4.2 Transit Mixers
- 5.4.3 Batching Plants
- 5.4.4 Others
- 5.5 Crushing & Screening Equipment
- 5.5.1 Crushers
- 5.5.2 Screening Equipment
- 5.5.3 Others
Chapter 6 Market Estimates & Forecast, By Propulsion, 2022 - 2035 ($Mn, Units)
- 6.1 Key trends
- 6.2 Diesel-powered
- 6.3 Electric
- 6.4 Hybrid
- 6.5 Others
Chapter 7 Market Estimates & Forecast, By Technology, 2022 - 2035 ($Mn, Units)
- 7.1 Key trends
- 7.2 IoT & Telematics
- 7.3 AI & Machine Learning
- 7.4 GPS/GNSS & 3D Machine Control
- 7.5 Robotics & Automation Systems
- 7.6 Others
Chapter 8 Market Estimates & Forecast, By Level of Autonomy, 2022 - 2035 ($Mn, Units)
- 8.1 Key trends
- 8.2 Fully Autonomous
- 8.3 Semi-Autonomous
- 8.4 Remote-Controlled
- 8.5 Operator-Assisted
Chapter 9 Market Estimates & Forecast, By Application, 2022 - 2035 ($Mn, Units)
- 9.1 Key Trends
- 9.2 Earthmoving & Excavation
- 9.3 Road Construction & Paving
- 9.4 Building Construction
- 9.5 Demolition & Recycling
- 9.6 Mining & Quarrying
- 9.7 Utility & Pipeline Installation
- 9.8 Others
Chapter 10 Market Estimates & Forecast, By End Use, 2022 - 2035 ($Mn, Units)
- 10.1 Key Trends
- 10.2 Construction Companies & General Contractors
- 10.3 Government & Public Infrastructure Agencies
- 10.4 Mining Companies
- 10.5 Equipment Rental Companies
- 10.6 Others
Chapter 11 Market Estimates & Forecast, By Region, 2022 - 2035 ($Mn, Units)
- 11.1 Key Trends
- 11.2 North America
- 11.2.1 US
- 11.2.2 Canada
- 11.3 Europe
- 11.3.1 UK
- 11.3.2 Germany
- 11.3.3 France
- 11.3.4 Italy
- 11.3.5 Spain
- 11.3.6 Russia
- 11.3.7 Nordics
- 11.4 Asia Pacific
- 11.4.1 China
- 11.4.2 India
- 11.4.3 Japan
- 11.4.4 South Korea
- 11.4.5 Southeast Asia
- 11.4.5.1 Indonesia
- 11.4.5.2 Malaysia
- 11.4.5.3 Singapore
- 11.4.5.4 Thailand
- 11.4.5.5 Vietnam
- 11.4.6 ANZ
- 11.5 Latin America
- 11.5.1 Brazil
- 11.5.2 Mexico
- 11.5.3 Argentina
- 11.6 MEA
- 11.6.1 South Africa
- 11.6.2 Saudi Arabia
- 11.6.3 UAE
Chapter 12 Company Profiles
- 12.1 Global Players
- 12.1.1 Ammann
- 12.1.2 Bell Equipment
- 12.1.3 BOMAG
- 12.1.4 Brokk
- 12.1.5 Caterpillar
- 12.1.6 Dynapac
- 12.1.7 Komatsu
- 12.1.8 Liebherr
- 12.1.9 Sany
- 12.1.10 Volvo CE
- 12.1.11 Wacker Neuson
- 12.1.12 Wirtgen
- 12.2 Regional Players
- 12.2.1 Hidromek
- 12.2.2 LiuGong
- 12.2.3 LGMG (SDLG)
- 12.2.4 Manitowoc
- 12.2.5 Shantui
- 12.2.6 Tadano
- 12.2.7 XCMG
- 12.2.8 Zoomlion


