|
시장보고서
상품코드
1564891
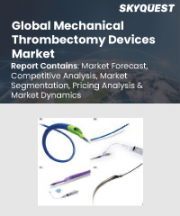
혈전 제거 기기 시장Thrombectomy Devices |
||||||
혈전 제거 장비 세계 시장은 2030년까지 22억 달러에 달할 것으로 예상됩니다
2023년 15억 달러로 추정되는 혈전 제거 장비 세계 시장은 2023-2030년 동안 연평균 5.2%의 성장률을 기록하며 2030년에는 22억 달러에 이를 것으로 예상됩니다. 이 보고서에서 분석한 부문 중 하나인 기계적 혈전 제거술은 CAGR 5.4%를 기록하여 분석 기간 종료 시점에 13억 달러에 도달할 것으로 예상됩니다. 용혈성 혈전제거술 부문은 분석 기간 동안 CAGR 5.6%의 성장률을 나타낼 것으로 추정됩니다.
미국 시장은 4억 360만 달러로 추정, 중국은 CAGR 8.9%로 성장 전망
미국의 혈전 제거 기기 시장은 2023년 4억 360만 달러로 추정됩니다. 세계 2위의 경제 대국인 중국은 2030년까지 5억 100만 달러 규모에 도달할 것으로 예상되며, 2023-2030년의 분석 기간 동안 8.9%의 연평균 복합 성장률(CAGR)을 나타낼 전망입니다. 다른 주목할 만한 지역 시장으로는 일본과 캐나다가 있으며, 분석 기간 동안 각각 2.0%와 5.3%의 연평균 복합 성장률(CAGR)을 나타낼 전망입니다. 유럽에서는 독일이 2.3%의 연평균 복합 성장률(CAGR)로 성장할 것으로 예상됩니다.
세계 혈전 제거 기기 시장 - 주요 동향 및 촉진요인 요약
혈전 제거 기기가 뇌졸중 및 혈관 치료에 변화를 가져올 수 있는 이유는 무엇일까?
혈전 제거 기기는 동맥과 정맥에서 혈전을 제거하는 최소 침습적 솔루션을 제공함으로써 뇌졸중 및 기타 혈관 질환 치료에 혁명을 일으켰습니다. 이 장치는 허혈성 뇌졸중, 폐색전증, 심부정맥혈전증(DVT) 환자를 치료하는 데 사용되어 장기적인 장애와 사망 위험을 크게 줄입니다. 특히 기계적 혈전제거술은 급성 허혈성 뇌졸중의 표준 치료법으로 등장했으며, 신속하게 시행하여 뇌로 가는 혈류를 회복시켜 생명을 구할 수 있는 치료법을 제공합니다. 심혈관 및 신경혈관 질환의 유병률이 증가하는 가운데, 고령화 사회의 도래와 뇌졸중 치료 옵션에 대한 인식이 높아짐에 따라 혈전 제거 기기에 대한 수요는 지속적으로 증가하고 있습니다.
혈전 제거 기기 시장은 어떻게 세분화되어 있는가?
혈전제거기에는 크게 기계식, 레이클라이텍식, 흡입식 혈전제거기가 있습니다. 기계식 혈전 제거 기기는 뇌졸중 치료에 널리 사용되며, 흡입식 혈전 제거 기기는 말초 동맥 질환(PAD) 및 정맥 혈전 색전증(VTE)에 자주 사용됩니다. 치료에는 신경혈관 질환, 심혈관 질환 및 말초 혈관 질환이 포함됩니다. 혈전 제거 기기의 최종 사용자는 병원, 전문 클리닉, 외래수술센터(ASC) 등을 포함합니다. 병원이 여전히 가장 큰 최종 사용자이지만, 기술이 발전하고 기존의 병원 환경 외에서도 최소침습적 시술이 가능해짐에 따라 외래 환자 환경에서의 사용도 확대되고 있습니다.
혈전 제거 장비의 주요 기술 발전은 무엇인가?
기술 혁신은 혈전 제거 기기의 성능과 환자 결과를 개선하는 데 중요한 역할을 하고 있습니다. 차세대 장치는 복잡한 혈관 구조를 보다 정확하게 탐색할 수 있는 개선된 카테터 설계를 통해 시술 시간을 단축하고 혈전 제거 효율을 향상시키는 것이 특징입니다. 주변 조직을 손상시키지 않고 큰 혈전을 제거할 수 있는 능력을 향상시키기 위해 첨단 흡입 시스템이 개발되고 있습니다. 또한 투시 및 초음파 가이드와 같은 실시간 영상 기술을 통합하여 혈전 제거 시술의 정확성과 안전성을 향상시키고 있습니다. 또한, 차세대 생체 흡수성 혈전 지혈제 연구도 진행 중이며, 이는 환자에게 더 낮은 침습적 옵션을 제공하고 재수술의 필요성을 줄일 수 있습니다.
혈전 제거 기기 시장의 성장을 가속하는 요인은 무엇인가?
혈전 제거 기기 시장의 성장은 심혈관 및 신경혈관 질환의 유병률 증가, 최소 침습 수술의 채택 증가, 혈전 제거 기술의 발전 등 여러 가지 요인에 기인합니다. 고령화는 노인이 뇌졸중이나 심부정맥혈전증과 같은 질환에 걸리기 쉽기 때문에 고령화가 중요한 촉진요인으로 작용합니다. 또한, 뇌졸중 증상과 신속한 개입의 중요성에 대한 인식이 높아지면서 혈전 제거 기기에 대한 수요가 증가하고 있습니다. 신흥 시장의 의료 인프라 확대와 외래수술센터(ASC)의 혈전 제거 기기 사용 증가는 시장 성장에 더욱 기여하고 있습니다. 기술 혁신, 특히 기계식 및 흡입식 장치는 혈전 제거술의 효과와 안전성을 향상시켜 시장 수요를 촉진하고 있습니다.
조사 대상 기업 예시(13개사)
- ACANDIS GmbH
- Argon Medical Devices, Inc.
- Boston Scientific Corporation
- BTG International Ltd.
- Edwards Lifesciences Corporation
- Johnson & Johnson
- Medtronic PLC
- Penumbra, Inc.
- Phenox GmbH
- Spectranetics Corporation
- Straub Medical AG
- Stryker Corporation
- Teleflex Inc.
- Terumo Corporation
목차
제1장 조사 방법
제2장 주요 요약
- 시장 개요
- 주요 기업
- 시장 동향과 촉진요인
- 세계 시장 전망
제3장 시장 분석
- 미국
- 캐나다
- 일본
- 중국
- 유럽
- 프랑스
- 독일
- 이탈리아
- 영국
- 스페인
- 러시아
- 기타 유럽
- 아시아태평양
- 호주
- 인도
- 한국
- 기타 아시아태평양
- 라틴아메리카
- 아르헨티나
- 브라질
- 멕시코
- 기타 라틴아메리카
- 중동
- 이란
- 이스라엘
- 사우디아라비아
- 아랍에미리트(UAE)
- 기타 중동
- 아프리카
제4장 경쟁
LSH 24.10.07Global Thrombectomy Devices Market to Reach US$2.2 Billion by 2030
The global market for Thrombectomy Devices estimated at US$1.5 Billion in the year 2023, is expected to reach US$2.2 Billion by 2030, growing at a CAGR of 5.2% over the analysis period 2023-2030. Mechanical Thrombectomy, one of the segments analyzed in the report, is expected to record a 5.4% CAGR and reach US$1.3 Billion by the end of the analysis period. Growth in the Rheolytic Thrombectomy segment is estimated at 5.6% CAGR over the analysis period.
The U.S. Market is Estimated at US$403.6 Million While China is Forecast to Grow at 8.9% CAGR
The Thrombectomy Devices market in the U.S. is estimated at US$403.6 Million in the year 2023. China, the world's second largest economy, is forecast to reach a projected market size of US$501.0 Million by the year 2030 trailing a CAGR of 8.9% over the analysis period 2023-2030. Among the other noteworthy geographic markets are Japan and Canada, each forecast to grow at a CAGR of 2.0% and 5.3% respectively over the analysis period. Within Europe, Germany is forecast to grow at approximately 2.3% CAGR.
Global Thrombectomy Devices Market - Key Trends and Drivers Summarized
Why Are Thrombectomy Devices Transforming Stroke and Vascular Treatment?
Thrombectomy devices have revolutionized the treatment of stroke and other vascular conditions by providing minimally invasive solutions for removing blood clots from arteries and veins. These devices are used to treat patients experiencing ischemic strokes, pulmonary embolisms, and deep vein thrombosis (DVT), significantly reducing the risk of long-term disability or death. Mechanical thrombectomy, in particular, has emerged as a standard of care for acute ischemic stroke, offering a life-saving option that can restore blood flow to the brain when administered quickly. As the prevalence of cardiovascular and neurovascular diseases rises, the demand for thrombectomy devices continues to grow, driven by an aging population and increasing awareness of stroke treatment options.
How Is the Thrombectomy Devices Market Segmented?
The main types of thrombectomy devices are mechanical, rheolytic and aspiration devices. Mechanical thrombectomy devices are widely used in stroke treatment, while aspiration thrombectomy devices are commonly used for peripheral artery disease (PAD) and venous thromboembolism (VTE). Applications include the treatment of neurovascular diseases, cardiovascular conditions, and peripheral vascular diseases. End-users of thrombectomy devices include hospitals, specialty clinics, and ambulatory surgical centers. Hospitals remain the largest end-user segment, but the use of these devices in outpatient settings is expanding as technology improves and more minimally invasive procedures are performed outside of traditional hospital environments.
What Are the Key Technological Advancements in Thrombectomy Devices?
Technological innovations are playing a critical role in advancing thrombectomy device performance and patient outcomes. New generation devices feature improved catheter designs that allow for more precise navigation through complex vascular structures, reducing procedure times and improving clot removal efficiency. Advanced aspiration systems are being developed to enhance the ability to remove large clots without damaging surrounding tissues. Additionally, the integration of real-time imaging technologies, such as fluoroscopy and ultrasound guidance, is improving the accuracy and safety of thrombectomy procedures. Research into next-generation bioresorbable thrombectomy devices is also underway, which could offer even less invasive options for patients, reducing the need for follow-up surgeries.
What Factors Are Driving Growth in the Thrombectomy Devices Market?
The growth in the thrombectomy devices market is driven by several factors, including the rising prevalence of cardiovascular and neurovascular diseases, the increasing adoption of minimally invasive surgical procedures, and advancements in thrombectomy technology. The aging population is a significant driver, as older individuals are more prone to conditions like stroke and deep vein thrombosis. Additionally, growing awareness of stroke symptoms and the importance of rapid intervention is boosting demand for thrombectomy devices. The expansion of healthcare infrastructure in emerging markets and the increased use of thrombectomy devices in ambulatory surgical centers are further contributing to market growth. Technological innovations, particularly in mechanical and aspiration devices, are enhancing the effectiveness and safety of thrombectomy procedures, fueling market demand.
Select Competitors (Total 13 Featured) -
- ACANDIS GmbH
- Argon Medical Devices, Inc.
- Boston Scientific Corporation
- BTG International Ltd.
- Edwards Lifesciences Corporation
- Johnson & Johnson
- Medtronic PLC
- Penumbra, Inc.
- Phenox GmbH
- Spectranetics Corporation
- Straub Medical AG
- Stryker Corporation
- Teleflex Inc.
- Terumo Corporation
TABLE OF CONTENTS
I. METHODOLOGY
II. EXECUTIVE SUMMARY
- 1. MARKET OVERVIEW
- Influencer Market Insights
- World Market Trajectories
- Impact of Covid-19 and a Looming Global Recession
- Thrombectomy Devices - Global Key Competitors Percentage Market Share in 2024 (E)
- Competitive Market Presence - Strong/Active/Niche/Trivial for Players Worldwide in 2024 (E)
- 2. FOCUS ON SELECT PLAYERS
- 3. MARKET TRENDS & DRIVERS
- Rising Prevalence of Cardiovascular and Neurovascular Diseases Spurs Demand for Thrombectomy Devices
- Increasing Adoption of Minimally Invasive Surgical Techniques Propels Growth in Thrombectomy Device Market
- Technological Innovations in Catheter-based Thrombectomy Systems Strengthen Market Expansion
- Growing Focus on Stroke Treatment and Prevention Expands Addressable Market for Thrombectomy Devices
- Surge in Aging Population Drives Demand for Thrombectomy Procedures
- Rising Awareness of Thrombectomy as a Life-saving Procedure Fuels Demand for Devices
- Growing Use of Thrombectomy in Peripheral Artery Disease (PAD) Expands Market Opportunities
- Increased Application of Thrombectomy Devices in Emergency Care Accelerates Market Growth
- Technological Advancements in Mechanical Thrombectomy Devices Improve Patient Outcomes
- Rising Focus on Early Diagnosis and Treatment of Blood Clots Drives Adoption of Thrombectomy Devices
- Growing Demand for Single-use Thrombectomy Devices Strengthens Market Growth
- Increasing Focus on Reducing Procedure Times and Hospital Stays Expands Use of Thrombectomy Devices
- Growing Application of Thrombectomy Devices in Ambulatory Surgical Centers Expands Market Scope
- 4. GLOBAL MARKET PERSPECTIVE
- TABLE 1: World Thrombectomy Devices Market Analysis of Annual Sales in US$ Thousand for Years 2014 through 2030
- TABLE 2: World Recent Past, Current & Future Analysis for Thrombectomy Devices by Geographic Region - USA, Canada, Japan, China, Europe, Asia-Pacific, Latin America, Middle East and Africa Markets - Independent Analysis of Annual Sales in US$ Thousand for Years 2023 through 2030 and % CAGR
- TABLE 3: World Historic Review for Thrombectomy Devices by Geographic Region - USA, Canada, Japan, China, Europe, Asia-Pacific, Latin America, Middle East and Africa Markets - Independent Analysis of Annual Sales in US$ Thousand for Years 2014 through 2022 and % CAGR
- TABLE 4: World 16-Year Perspective for Thrombectomy Devices by Geographic Region - Percentage Breakdown of Value Sales for USA, Canada, Japan, China, Europe, Asia-Pacific, Latin America, Middle East and Africa Markets for Years 2014, 2024 & 2030
- TABLE 5: World Recent Past, Current & Future Analysis for Mechanical Thrombectomy by Geographic Region - USA, Canada, Japan, China, Europe, Asia-Pacific, Latin America, Middle East and Africa Markets - Independent Analysis of Annual Sales in US$ Thousand for Years 2023 through 2030 and % CAGR
- TABLE 6: World Historic Review for Mechanical Thrombectomy by Geographic Region - USA, Canada, Japan, China, Europe, Asia-Pacific, Latin America, Middle East and Africa Markets - Independent Analysis of Annual Sales in US$ Thousand for Years 2014 through 2022 and % CAGR
- TABLE 7: World 16-Year Perspective for Mechanical Thrombectomy by Geographic Region - Percentage Breakdown of Value Sales for USA, Canada, Japan, China, Europe, Asia-Pacific, Latin America, Middle East and Africa for Years 2014, 2024 & 2030
- TABLE 8: World Recent Past, Current & Future Analysis for Rheolytic Thrombectomy by Geographic Region - USA, Canada, Japan, China, Europe, Asia-Pacific, Latin America, Middle East and Africa Markets - Independent Analysis of Annual Sales in US$ Thousand for Years 2023 through 2030 and % CAGR
- TABLE 9: World Historic Review for Rheolytic Thrombectomy by Geographic Region - USA, Canada, Japan, China, Europe, Asia-Pacific, Latin America, Middle East and Africa Markets - Independent Analysis of Annual Sales in US$ Thousand for Years 2014 through 2022 and % CAGR
- TABLE 10: World 16-Year Perspective for Rheolytic Thrombectomy by Geographic Region - Percentage Breakdown of Value Sales for USA, Canada, Japan, China, Europe, Asia-Pacific, Latin America, Middle East and Africa for Years 2014, 2024 & 2030
- TABLE 11: World Recent Past, Current & Future Analysis for Aspiration Thrombectomy by Geographic Region - USA, Canada, Japan, China, Europe, Asia-Pacific, Latin America, Middle East and Africa Markets - Independent Analysis of Annual Sales in US$ Thousand for Years 2023 through 2030 and % CAGR
- TABLE 12: World Historic Review for Aspiration Thrombectomy by Geographic Region - USA, Canada, Japan, China, Europe, Asia-Pacific, Latin America, Middle East and Africa Markets - Independent Analysis of Annual Sales in US$ Thousand for Years 2014 through 2022 and % CAGR
- TABLE 13: World 16-Year Perspective for Aspiration Thrombectomy by Geographic Region - Percentage Breakdown of Value Sales for USA, Canada, Japan, China, Europe, Asia-Pacific, Latin America, Middle East and Africa for Years 2014, 2024 & 2030
- TABLE 14: World Recent Past, Current & Future Analysis for Neurovascular by Geographic Region - USA, Canada, Japan, China, Europe, Asia-Pacific, Latin America, Middle East and Africa Markets - Independent Analysis of Annual Sales in US$ Thousand for Years 2023 through 2030 and % CAGR
- TABLE 15: World Historic Review for Neurovascular by Geographic Region - USA, Canada, Japan, China, Europe, Asia-Pacific, Latin America, Middle East and Africa Markets - Independent Analysis of Annual Sales in US$ Thousand for Years 2014 through 2022 and % CAGR
- TABLE 16: World 16-Year Perspective for Neurovascular by Geographic Region - Percentage Breakdown of Value Sales for USA, Canada, Japan, China, Europe, Asia-Pacific, Latin America, Middle East and Africa for Years 2014, 2024 & 2030
- TABLE 17: World Recent Past, Current & Future Analysis for Cardiovascular by Geographic Region - USA, Canada, Japan, China, Europe, Asia-Pacific, Latin America, Middle East and Africa Markets - Independent Analysis of Annual Sales in US$ Thousand for Years 2023 through 2030 and % CAGR
- TABLE 18: World Historic Review for Cardiovascular by Geographic Region - USA, Canada, Japan, China, Europe, Asia-Pacific, Latin America, Middle East and Africa Markets - Independent Analysis of Annual Sales in US$ Thousand for Years 2014 through 2022 and % CAGR
- TABLE 19: World 16-Year Perspective for Cardiovascular by Geographic Region - Percentage Breakdown of Value Sales for USA, Canada, Japan, China, Europe, Asia-Pacific, Latin America, Middle East and Africa for Years 2014, 2024 & 2030
- TABLE 20: World Recent Past, Current & Future Analysis for Peripheral Vascular by Geographic Region - USA, Canada, Japan, China, Europe, Asia-Pacific, Latin America, Middle East and Africa Markets - Independent Analysis of Annual Sales in US$ Thousand for Years 2023 through 2030 and % CAGR
- TABLE 21: World Historic Review for Peripheral Vascular by Geographic Region - USA, Canada, Japan, China, Europe, Asia-Pacific, Latin America, Middle East and Africa Markets - Independent Analysis of Annual Sales in US$ Thousand for Years 2014 through 2022 and % CAGR
- TABLE 22: World 16-Year Perspective for Peripheral Vascular by Geographic Region - Percentage Breakdown of Value Sales for USA, Canada, Japan, China, Europe, Asia-Pacific, Latin America, Middle East and Africa for Years 2014, 2024 & 2030
- TABLE 23: World Recent Past, Current & Future Analysis for Hospitals by Geographic Region - USA, Canada, Japan, China, Europe, Asia-Pacific, Latin America, Middle East and Africa Markets - Independent Analysis of Annual Sales in US$ Thousand for Years 2023 through 2030 and % CAGR
- TABLE 24: World Historic Review for Hospitals by Geographic Region - USA, Canada, Japan, China, Europe, Asia-Pacific, Latin America, Middle East and Africa Markets - Independent Analysis of Annual Sales in US$ Thousand for Years 2014 through 2022 and % CAGR
- TABLE 25: World 16-Year Perspective for Hospitals by Geographic Region - Percentage Breakdown of Value Sales for USA, Canada, Japan, China, Europe, Asia-Pacific, Latin America, Middle East and Africa for Years 2014, 2024 & 2030
- TABLE 26: World Recent Past, Current & Future Analysis for Ambulatory Surgery Centers by Geographic Region - USA, Canada, Japan, China, Europe, Asia-Pacific, Latin America, Middle East and Africa Markets - Independent Analysis of Annual Sales in US$ Thousand for Years 2023 through 2030 and % CAGR
- TABLE 27: World Historic Review for Ambulatory Surgery Centers by Geographic Region - USA, Canada, Japan, China, Europe, Asia-Pacific, Latin America, Middle East and Africa Markets - Independent Analysis of Annual Sales in US$ Thousand for Years 2014 through 2022 and % CAGR
- TABLE 28: World 16-Year Perspective for Ambulatory Surgery Centers by Geographic Region - Percentage Breakdown of Value Sales for USA, Canada, Japan, China, Europe, Asia-Pacific, Latin America, Middle East and Africa for Years 2014, 2024 & 2030
- TABLE 29: World Recent Past, Current & Future Analysis for Other End-Uses by Geographic Region - USA, Canada, Japan, China, Europe, Asia-Pacific, Latin America, Middle East and Africa Markets - Independent Analysis of Annual Sales in US$ Thousand for Years 2023 through 2030 and % CAGR
- TABLE 30: World Historic Review for Other End-Uses by Geographic Region - USA, Canada, Japan, China, Europe, Asia-Pacific, Latin America, Middle East and Africa Markets - Independent Analysis of Annual Sales in US$ Thousand for Years 2014 through 2022 and % CAGR
- TABLE 31: World 16-Year Perspective for Other End-Uses by Geographic Region - Percentage Breakdown of Value Sales for USA, Canada, Japan, China, Europe, Asia-Pacific, Latin America, Middle East and Africa for Years 2014, 2024 & 2030
III. MARKET ANALYSIS
- UNITED STATES
- Thrombectomy Devices Market Presence - Strong/Active/Niche/Trivial - Key Competitors in the United States for 2024 (E)
- TABLE 32: USA Recent Past, Current & Future Analysis for Thrombectomy Devices by Type - Mechanical Thrombectomy, Rheolytic Thrombectomy and Aspiration Thrombectomy - Independent Analysis of Annual Sales in US$ Thousand for the Years 2023 through 2030 and % CAGR
- TABLE 33: USA Historic Review for Thrombectomy Devices by Type - Mechanical Thrombectomy, Rheolytic Thrombectomy and Aspiration Thrombectomy Markets - Independent Analysis of Annual Sales in US$ Thousand for Years 2014 through 2022 and % CAGR
- TABLE 34: USA 16-Year Perspective for Thrombectomy Devices by Type - Percentage Breakdown of Value Sales for Mechanical Thrombectomy, Rheolytic Thrombectomy and Aspiration Thrombectomy for the Years 2014, 2024 & 2030
- TABLE 35: USA Recent Past, Current & Future Analysis for Thrombectomy Devices by Application - Neurovascular, Cardiovascular and Peripheral Vascular - Independent Analysis of Annual Sales in US$ Thousand for the Years 2023 through 2030 and % CAGR
- TABLE 36: USA Historic Review for Thrombectomy Devices by Application - Neurovascular, Cardiovascular and Peripheral Vascular Markets - Independent Analysis of Annual Sales in US$ Thousand for Years 2014 through 2022 and % CAGR
- TABLE 37: USA 16-Year Perspective for Thrombectomy Devices by Application - Percentage Breakdown of Value Sales for Neurovascular, Cardiovascular and Peripheral Vascular for the Years 2014, 2024 & 2030
- TABLE 38: USA Recent Past, Current & Future Analysis for Thrombectomy Devices by End-Use - Hospitals, Ambulatory Surgery Centers and Other End-Uses - Independent Analysis of Annual Sales in US$ Thousand for the Years 2023 through 2030 and % CAGR
- TABLE 39: USA Historic Review for Thrombectomy Devices by End-Use - Hospitals, Ambulatory Surgery Centers and Other End-Uses Markets - Independent Analysis of Annual Sales in US$ Thousand for Years 2014 through 2022 and % CAGR
- TABLE 40: USA 16-Year Perspective for Thrombectomy Devices by End-Use - Percentage Breakdown of Value Sales for Hospitals, Ambulatory Surgery Centers and Other End-Uses for the Years 2014, 2024 & 2030
- CANADA
- TABLE 41: Canada Recent Past, Current & Future Analysis for Thrombectomy Devices by Type - Mechanical Thrombectomy, Rheolytic Thrombectomy and Aspiration Thrombectomy - Independent Analysis of Annual Sales in US$ Thousand for the Years 2023 through 2030 and % CAGR
- TABLE 42: Canada Historic Review for Thrombectomy Devices by Type - Mechanical Thrombectomy, Rheolytic Thrombectomy and Aspiration Thrombectomy Markets - Independent Analysis of Annual Sales in US$ Thousand for Years 2014 through 2022 and % CAGR
- TABLE 43: Canada 16-Year Perspective for Thrombectomy Devices by Type - Percentage Breakdown of Value Sales for Mechanical Thrombectomy, Rheolytic Thrombectomy and Aspiration Thrombectomy for the Years 2014, 2024 & 2030
- TABLE 44: Canada Recent Past, Current & Future Analysis for Thrombectomy Devices by Application - Neurovascular, Cardiovascular and Peripheral Vascular - Independent Analysis of Annual Sales in US$ Thousand for the Years 2023 through 2030 and % CAGR
- TABLE 45: Canada Historic Review for Thrombectomy Devices by Application - Neurovascular, Cardiovascular and Peripheral Vascular Markets - Independent Analysis of Annual Sales in US$ Thousand for Years 2014 through 2022 and % CAGR
- TABLE 46: Canada 16-Year Perspective for Thrombectomy Devices by Application - Percentage Breakdown of Value Sales for Neurovascular, Cardiovascular and Peripheral Vascular for the Years 2014, 2024 & 2030
- TABLE 47: Canada Recent Past, Current & Future Analysis for Thrombectomy Devices by End-Use - Hospitals, Ambulatory Surgery Centers and Other End-Uses - Independent Analysis of Annual Sales in US$ Thousand for the Years 2023 through 2030 and % CAGR
- TABLE 48: Canada Historic Review for Thrombectomy Devices by End-Use - Hospitals, Ambulatory Surgery Centers and Other End-Uses Markets - Independent Analysis of Annual Sales in US$ Thousand for Years 2014 through 2022 and % CAGR
- TABLE 49: Canada 16-Year Perspective for Thrombectomy Devices by End-Use - Percentage Breakdown of Value Sales for Hospitals, Ambulatory Surgery Centers and Other End-Uses for the Years 2014, 2024 & 2030
- JAPAN
- Thrombectomy Devices Market Presence - Strong/Active/Niche/Trivial - Key Competitors in Japan for 2024 (E)
- TABLE 50: Japan Recent Past, Current & Future Analysis for Thrombectomy Devices by Type - Mechanical Thrombectomy, Rheolytic Thrombectomy and Aspiration Thrombectomy - Independent Analysis of Annual Sales in US$ Thousand for the Years 2023 through 2030 and % CAGR
- TABLE 51: Japan Historic Review for Thrombectomy Devices by Type - Mechanical Thrombectomy, Rheolytic Thrombectomy and Aspiration Thrombectomy Markets - Independent Analysis of Annual Sales in US$ Thousand for Years 2014 through 2022 and % CAGR
- TABLE 52: Japan 16-Year Perspective for Thrombectomy Devices by Type - Percentage Breakdown of Value Sales for Mechanical Thrombectomy, Rheolytic Thrombectomy and Aspiration Thrombectomy for the Years 2014, 2024 & 2030
- TABLE 53: Japan Recent Past, Current & Future Analysis for Thrombectomy Devices by Application - Neurovascular, Cardiovascular and Peripheral Vascular - Independent Analysis of Annual Sales in US$ Thousand for the Years 2023 through 2030 and % CAGR
- TABLE 54: Japan Historic Review for Thrombectomy Devices by Application - Neurovascular, Cardiovascular and Peripheral Vascular Markets - Independent Analysis of Annual Sales in US$ Thousand for Years 2014 through 2022 and % CAGR
- TABLE 55: Japan 16-Year Perspective for Thrombectomy Devices by Application - Percentage Breakdown of Value Sales for Neurovascular, Cardiovascular and Peripheral Vascular for the Years 2014, 2024 & 2030
- TABLE 56: Japan Recent Past, Current & Future Analysis for Thrombectomy Devices by End-Use - Hospitals, Ambulatory Surgery Centers and Other End-Uses - Independent Analysis of Annual Sales in US$ Thousand for the Years 2023 through 2030 and % CAGR
- TABLE 57: Japan Historic Review for Thrombectomy Devices by End-Use - Hospitals, Ambulatory Surgery Centers and Other End-Uses Markets - Independent Analysis of Annual Sales in US$ Thousand for Years 2014 through 2022 and % CAGR
- TABLE 58: Japan 16-Year Perspective for Thrombectomy Devices by End-Use - Percentage Breakdown of Value Sales for Hospitals, Ambulatory Surgery Centers and Other End-Uses for the Years 2014, 2024 & 2030
- CHINA
- Thrombectomy Devices Market Presence - Strong/Active/Niche/Trivial - Key Competitors in China for 2024 (E)
- TABLE 59: China Recent Past, Current & Future Analysis for Thrombectomy Devices by Type - Mechanical Thrombectomy, Rheolytic Thrombectomy and Aspiration Thrombectomy - Independent Analysis of Annual Sales in US$ Thousand for the Years 2023 through 2030 and % CAGR
- TABLE 60: China Historic Review for Thrombectomy Devices by Type - Mechanical Thrombectomy, Rheolytic Thrombectomy and Aspiration Thrombectomy Markets - Independent Analysis of Annual Sales in US$ Thousand for Years 2014 through 2022 and % CAGR
- TABLE 61: China 16-Year Perspective for Thrombectomy Devices by Type - Percentage Breakdown of Value Sales for Mechanical Thrombectomy, Rheolytic Thrombectomy and Aspiration Thrombectomy for the Years 2014, 2024 & 2030
- TABLE 62: China Recent Past, Current & Future Analysis for Thrombectomy Devices by Application - Neurovascular, Cardiovascular and Peripheral Vascular - Independent Analysis of Annual Sales in US$ Thousand for the Years 2023 through 2030 and % CAGR
- TABLE 63: China Historic Review for Thrombectomy Devices by Application - Neurovascular, Cardiovascular and Peripheral Vascular Markets - Independent Analysis of Annual Sales in US$ Thousand for Years 2014 through 2022 and % CAGR
- TABLE 64: China 16-Year Perspective for Thrombectomy Devices by Application - Percentage Breakdown of Value Sales for Neurovascular, Cardiovascular and Peripheral Vascular for the Years 2014, 2024 & 2030
- TABLE 65: China Recent Past, Current & Future Analysis for Thrombectomy Devices by End-Use - Hospitals, Ambulatory Surgery Centers and Other End-Uses - Independent Analysis of Annual Sales in US$ Thousand for the Years 2023 through 2030 and % CAGR
- TABLE 66: China Historic Review for Thrombectomy Devices by End-Use - Hospitals, Ambulatory Surgery Centers and Other End-Uses Markets - Independent Analysis of Annual Sales in US$ Thousand for Years 2014 through 2022 and % CAGR
- TABLE 67: China 16-Year Perspective for Thrombectomy Devices by End-Use - Percentage Breakdown of Value Sales for Hospitals, Ambulatory Surgery Centers and Other End-Uses for the Years 2014, 2024 & 2030
- EUROPE
- Thrombectomy Devices Market Presence - Strong/Active/Niche/Trivial - Key Competitors in Europe for 2024 (E)
- TABLE 68: Europe Recent Past, Current & Future Analysis for Thrombectomy Devices by Geographic Region - France, Germany, Italy, UK, Spain, Russia and Rest of Europe Markets - Independent Analysis of Annual Sales in US$ Thousand for Years 2023 through 2030 and % CAGR
- TABLE 69: Europe Historic Review for Thrombectomy Devices by Geographic Region - France, Germany, Italy, UK, Spain, Russia and Rest of Europe Markets - Independent Analysis of Annual Sales in US$ Thousand for Years 2014 through 2022 and % CAGR
- TABLE 70: Europe 16-Year Perspective for Thrombectomy Devices by Geographic Region - Percentage Breakdown of Value Sales for France, Germany, Italy, UK, Spain, Russia and Rest of Europe Markets for Years 2014, 2024 & 2030
- TABLE 71: Europe Recent Past, Current & Future Analysis for Thrombectomy Devices by Type - Mechanical Thrombectomy, Rheolytic Thrombectomy and Aspiration Thrombectomy - Independent Analysis of Annual Sales in US$ Thousand for the Years 2023 through 2030 and % CAGR
- TABLE 72: Europe Historic Review for Thrombectomy Devices by Type - Mechanical Thrombectomy, Rheolytic Thrombectomy and Aspiration Thrombectomy Markets - Independent Analysis of Annual Sales in US$ Thousand for Years 2014 through 2022 and % CAGR
- TABLE 73: Europe 16-Year Perspective for Thrombectomy Devices by Type - Percentage Breakdown of Value Sales for Mechanical Thrombectomy, Rheolytic Thrombectomy and Aspiration Thrombectomy for the Years 2014, 2024 & 2030
- TABLE 74: Europe Recent Past, Current & Future Analysis for Thrombectomy Devices by Application - Neurovascular, Cardiovascular and Peripheral Vascular - Independent Analysis of Annual Sales in US$ Thousand for the Years 2023 through 2030 and % CAGR
- TABLE 75: Europe Historic Review for Thrombectomy Devices by Application - Neurovascular, Cardiovascular and Peripheral Vascular Markets - Independent Analysis of Annual Sales in US$ Thousand for Years 2014 through 2022 and % CAGR
- TABLE 76: Europe 16-Year Perspective for Thrombectomy Devices by Application - Percentage Breakdown of Value Sales for Neurovascular, Cardiovascular and Peripheral Vascular for the Years 2014, 2024 & 2030
- TABLE 77: Europe Recent Past, Current & Future Analysis for Thrombectomy Devices by End-Use - Hospitals, Ambulatory Surgery Centers and Other End-Uses - Independent Analysis of Annual Sales in US$ Thousand for the Years 2023 through 2030 and % CAGR
- TABLE 78: Europe Historic Review for Thrombectomy Devices by End-Use - Hospitals, Ambulatory Surgery Centers and Other End-Uses Markets - Independent Analysis of Annual Sales in US$ Thousand for Years 2014 through 2022 and % CAGR
- TABLE 79: Europe 16-Year Perspective for Thrombectomy Devices by End-Use - Percentage Breakdown of Value Sales for Hospitals, Ambulatory Surgery Centers and Other End-Uses for the Years 2014, 2024 & 2030
- FRANCE
- Thrombectomy Devices Market Presence - Strong/Active/Niche/Trivial - Key Competitors in France for 2024 (E)
- TABLE 80: France Recent Past, Current & Future Analysis for Thrombectomy Devices by Type - Mechanical Thrombectomy, Rheolytic Thrombectomy and Aspiration Thrombectomy - Independent Analysis of Annual Sales in US$ Thousand for the Years 2023 through 2030 and % CAGR
- TABLE 81: France Historic Review for Thrombectomy Devices by Type - Mechanical Thrombectomy, Rheolytic Thrombectomy and Aspiration Thrombectomy Markets - Independent Analysis of Annual Sales in US$ Thousand for Years 2014 through 2022 and % CAGR
- TABLE 82: France 16-Year Perspective for Thrombectomy Devices by Type - Percentage Breakdown of Value Sales for Mechanical Thrombectomy, Rheolytic Thrombectomy and Aspiration Thrombectomy for the Years 2014, 2024 & 2030
- TABLE 83: France Recent Past, Current & Future Analysis for Thrombectomy Devices by Application - Neurovascular, Cardiovascular and Peripheral Vascular - Independent Analysis of Annual Sales in US$ Thousand for the Years 2023 through 2030 and % CAGR
- TABLE 84: France Historic Review for Thrombectomy Devices by Application - Neurovascular, Cardiovascular and Peripheral Vascular Markets - Independent Analysis of Annual Sales in US$ Thousand for Years 2014 through 2022 and % CAGR
- TABLE 85: France 16-Year Perspective for Thrombectomy Devices by Application - Percentage Breakdown of Value Sales for Neurovascular, Cardiovascular and Peripheral Vascular for the Years 2014, 2024 & 2030
- TABLE 86: France Recent Past, Current & Future Analysis for Thrombectomy Devices by End-Use - Hospitals, Ambulatory Surgery Centers and Other End-Uses - Independent Analysis of Annual Sales in US$ Thousand for the Years 2023 through 2030 and % CAGR
- TABLE 87: France Historic Review for Thrombectomy Devices by End-Use - Hospitals, Ambulatory Surgery Centers and Other End-Uses Markets - Independent Analysis of Annual Sales in US$ Thousand for Years 2014 through 2022 and % CAGR
- TABLE 88: France 16-Year Perspective for Thrombectomy Devices by End-Use - Percentage Breakdown of Value Sales for Hospitals, Ambulatory Surgery Centers and Other End-Uses for the Years 2014, 2024 & 2030
- GERMANY
- Thrombectomy Devices Market Presence - Strong/Active/Niche/Trivial - Key Competitors in Germany for 2024 (E)
- TABLE 89: Germany Recent Past, Current & Future Analysis for Thrombectomy Devices by Type - Mechanical Thrombectomy, Rheolytic Thrombectomy and Aspiration Thrombectomy - Independent Analysis of Annual Sales in US$ Thousand for the Years 2023 through 2030 and % CAGR
- TABLE 90: Germany Historic Review for Thrombectomy Devices by Type - Mechanical Thrombectomy, Rheolytic Thrombectomy and Aspiration Thrombectomy Markets - Independent Analysis of Annual Sales in US$ Thousand for Years 2014 through 2022 and % CAGR
- TABLE 91: Germany 16-Year Perspective for Thrombectomy Devices by Type - Percentage Breakdown of Value Sales for Mechanical Thrombectomy, Rheolytic Thrombectomy and Aspiration Thrombectomy for the Years 2014, 2024 & 2030
- TABLE 92: Germany Recent Past, Current & Future Analysis for Thrombectomy Devices by Application - Neurovascular, Cardiovascular and Peripheral Vascular - Independent Analysis of Annual Sales in US$ Thousand for the Years 2023 through 2030 and % CAGR
- TABLE 93: Germany Historic Review for Thrombectomy Devices by Application - Neurovascular, Cardiovascular and Peripheral Vascular Markets - Independent Analysis of Annual Sales in US$ Thousand for Years 2014 through 2022 and % CAGR
- TABLE 94: Germany 16-Year Perspective for Thrombectomy Devices by Application - Percentage Breakdown of Value Sales for Neurovascular, Cardiovascular and Peripheral Vascular for the Years 2014, 2024 & 2030
- TABLE 95: Germany Recent Past, Current & Future Analysis for Thrombectomy Devices by End-Use - Hospitals, Ambulatory Surgery Centers and Other End-Uses - Independent Analysis of Annual Sales in US$ Thousand for the Years 2023 through 2030 and % CAGR
- TABLE 96: Germany Historic Review for Thrombectomy Devices by End-Use - Hospitals, Ambulatory Surgery Centers and Other End-Uses Markets - Independent Analysis of Annual Sales in US$ Thousand for Years 2014 through 2022 and % CAGR
- TABLE 97: Germany 16-Year Perspective for Thrombectomy Devices by End-Use - Percentage Breakdown of Value Sales for Hospitals, Ambulatory Surgery Centers and Other End-Uses for the Years 2014, 2024 & 2030
- ITALY
- TABLE 98: Italy Recent Past, Current & Future Analysis for Thrombectomy Devices by Type - Mechanical Thrombectomy, Rheolytic Thrombectomy and Aspiration Thrombectomy - Independent Analysis of Annual Sales in US$ Thousand for the Years 2023 through 2030 and % CAGR
- TABLE 99: Italy Historic Review for Thrombectomy Devices by Type - Mechanical Thrombectomy, Rheolytic Thrombectomy and Aspiration Thrombectomy Markets - Independent Analysis of Annual Sales in US$ Thousand for Years 2014 through 2022 and % CAGR
- TABLE 100: Italy 16-Year Perspective for Thrombectomy Devices by Type - Percentage Breakdown of Value Sales for Mechanical Thrombectomy, Rheolytic Thrombectomy and Aspiration Thrombectomy for the Years 2014, 2024 & 2030
- TABLE 101: Italy Recent Past, Current & Future Analysis for Thrombectomy Devices by Application - Neurovascular, Cardiovascular and Peripheral Vascular - Independent Analysis of Annual Sales in US$ Thousand for the Years 2023 through 2030 and % CAGR
- TABLE 102: Italy Historic Review for Thrombectomy Devices by Application - Neurovascular, Cardiovascular and Peripheral Vascular Markets - Independent Analysis of Annual Sales in US$ Thousand for Years 2014 through 2022 and % CAGR
- TABLE 103: Italy 16-Year Perspective for Thrombectomy Devices by Application - Percentage Breakdown of Value Sales for Neurovascular, Cardiovascular and Peripheral Vascular for the Years 2014, 2024 & 2030
- TABLE 104: Italy Recent Past, Current & Future Analysis for Thrombectomy Devices by End-Use - Hospitals, Ambulatory Surgery Centers and Other End-Uses - Independent Analysis of Annual Sales in US$ Thousand for the Years 2023 through 2030 and % CAGR
- TABLE 105: Italy Historic Review for Thrombectomy Devices by End-Use - Hospitals, Ambulatory Surgery Centers and Other End-Uses Markets - Independent Analysis of Annual Sales in US$ Thousand for Years 2014 through 2022 and % CAGR
- TABLE 106: Italy 16-Year Perspective for Thrombectomy Devices by End-Use - Percentage Breakdown of Value Sales for Hospitals, Ambulatory Surgery Centers and Other End-Uses for the Years 2014, 2024 & 2030
- UNITED KINGDOM
- Thrombectomy Devices Market Presence - Strong/Active/Niche/Trivial - Key Competitors in the United Kingdom for 2024 (E)
- TABLE 107: UK Recent Past, Current & Future Analysis for Thrombectomy Devices by Type - Mechanical Thrombectomy, Rheolytic Thrombectomy and Aspiration Thrombectomy - Independent Analysis of Annual Sales in US$ Thousand for the Years 2023 through 2030 and % CAGR
- TABLE 108: UK Historic Review for Thrombectomy Devices by Type - Mechanical Thrombectomy, Rheolytic Thrombectomy and Aspiration Thrombectomy Markets - Independent Analysis of Annual Sales in US$ Thousand for Years 2014 through 2022 and % CAGR
- TABLE 109: UK 16-Year Perspective for Thrombectomy Devices by Type - Percentage Breakdown of Value Sales for Mechanical Thrombectomy, Rheolytic Thrombectomy and Aspiration Thrombectomy for the Years 2014, 2024 & 2030
- TABLE 110: UK Recent Past, Current & Future Analysis for Thrombectomy Devices by Application - Neurovascular, Cardiovascular and Peripheral Vascular - Independent Analysis of Annual Sales in US$ Thousand for the Years 2023 through 2030 and % CAGR
- TABLE 111: UK Historic Review for Thrombectomy Devices by Application - Neurovascular, Cardiovascular and Peripheral Vascular Markets - Independent Analysis of Annual Sales in US$ Thousand for Years 2014 through 2022 and % CAGR
- TABLE 112: UK 16-Year Perspective for Thrombectomy Devices by Application - Percentage Breakdown of Value Sales for Neurovascular, Cardiovascular and Peripheral Vascular for the Years 2014, 2024 & 2030
- TABLE 113: UK Recent Past, Current & Future Analysis for Thrombectomy Devices by End-Use - Hospitals, Ambulatory Surgery Centers and Other End-Uses - Independent Analysis of Annual Sales in US$ Thousand for the Years 2023 through 2030 and % CAGR
- TABLE 114: UK Historic Review for Thrombectomy Devices by End-Use - Hospitals, Ambulatory Surgery Centers and Other End-Uses Markets - Independent Analysis of Annual Sales in US$ Thousand for Years 2014 through 2022 and % CAGR
- TABLE 115: UK 16-Year Perspective for Thrombectomy Devices by End-Use - Percentage Breakdown of Value Sales for Hospitals, Ambulatory Surgery Centers and Other End-Uses for the Years 2014, 2024 & 2030
- SPAIN
- TABLE 116: Spain Recent Past, Current & Future Analysis for Thrombectomy Devices by Type - Mechanical Thrombectomy, Rheolytic Thrombectomy and Aspiration Thrombectomy - Independent Analysis of Annual Sales in US$ Thousand for the Years 2023 through 2030 and % CAGR
- TABLE 117: Spain Historic Review for Thrombectomy Devices by Type - Mechanical Thrombectomy, Rheolytic Thrombectomy and Aspiration Thrombectomy Markets - Independent Analysis of Annual Sales in US$ Thousand for Years 2014 through 2022 and % CAGR
- TABLE 118: Spain 16-Year Perspective for Thrombectomy Devices by Type - Percentage Breakdown of Value Sales for Mechanical Thrombectomy, Rheolytic Thrombectomy and Aspiration Thrombectomy for the Years 2014, 2024 & 2030
- TABLE 119: Spain Recent Past, Current & Future Analysis for Thrombectomy Devices by Application - Neurovascular, Cardiovascular and Peripheral Vascular - Independent Analysis of Annual Sales in US$ Thousand for the Years 2023 through 2030 and % CAGR
- TABLE 120: Spain Historic Review for Thrombectomy Devices by Application - Neurovascular, Cardiovascular and Peripheral Vascular Markets - Independent Analysis of Annual Sales in US$ Thousand for Years 2014 through 2022 and % CAGR
- TABLE 121: Spain 16-Year Perspective for Thrombectomy Devices by Application - Percentage Breakdown of Value Sales for Neurovascular, Cardiovascular and Peripheral Vascular for the Years 2014, 2024 & 2030
- TABLE 122: Spain Recent Past, Current & Future Analysis for Thrombectomy Devices by End-Use - Hospitals, Ambulatory Surgery Centers and Other End-Uses - Independent Analysis of Annual Sales in US$ Thousand for the Years 2023 through 2030 and % CAGR
- TABLE 123: Spain Historic Review for Thrombectomy Devices by End-Use - Hospitals, Ambulatory Surgery Centers and Other End-Uses Markets - Independent Analysis of Annual Sales in US$ Thousand for Years 2014 through 2022 and % CAGR
- TABLE 124: Spain 16-Year Perspective for Thrombectomy Devices by End-Use - Percentage Breakdown of Value Sales for Hospitals, Ambulatory Surgery Centers and Other End-Uses for the Years 2014, 2024 & 2030
- RUSSIA
- TABLE 125: Russia Recent Past, Current & Future Analysis for Thrombectomy Devices by Type - Mechanical Thrombectomy, Rheolytic Thrombectomy and Aspiration Thrombectomy - Independent Analysis of Annual Sales in US$ Thousand for the Years 2023 through 2030 and % CAGR
- TABLE 126: Russia Historic Review for Thrombectomy Devices by Type - Mechanical Thrombectomy, Rheolytic Thrombectomy and Aspiration Thrombectomy Markets - Independent Analysis of Annual Sales in US$ Thousand for Years 2014 through 2022 and % CAGR
- TABLE 127: Russia 16-Year Perspective for Thrombectomy Devices by Type - Percentage Breakdown of Value Sales for Mechanical Thrombectomy, Rheolytic Thrombectomy and Aspiration Thrombectomy for the Years 2014, 2024 & 2030
- TABLE 128: Russia Recent Past, Current & Future Analysis for Thrombectomy Devices by Application - Neurovascular, Cardiovascular and Peripheral Vascular - Independent Analysis of Annual Sales in US$ Thousand for the Years 2023 through 2030 and % CAGR
- TABLE 129: Russia Historic Review for Thrombectomy Devices by Application - Neurovascular, Cardiovascular and Peripheral Vascular Markets - Independent Analysis of Annual Sales in US$ Thousand for Years 2014 through 2022 and % CAGR
- TABLE 130: Russia 16-Year Perspective for Thrombectomy Devices by Application - Percentage Breakdown of Value Sales for Neurovascular, Cardiovascular and Peripheral Vascular for the Years 2014, 2024 & 2030
- TABLE 131: Russia Recent Past, Current & Future Analysis for Thrombectomy Devices by End-Use - Hospitals, Ambulatory Surgery Centers and Other End-Uses - Independent Analysis of Annual Sales in US$ Thousand for the Years 2023 through 2030 and % CAGR
- TABLE 132: Russia Historic Review for Thrombectomy Devices by End-Use - Hospitals, Ambulatory Surgery Centers and Other End-Uses Markets - Independent Analysis of Annual Sales in US$ Thousand for Years 2014 through 2022 and % CAGR
- TABLE 133: Russia 16-Year Perspective for Thrombectomy Devices by End-Use - Percentage Breakdown of Value Sales for Hospitals, Ambulatory Surgery Centers and Other End-Uses for the Years 2014, 2024 & 2030
- REST OF EUROPE
- TABLE 134: Rest of Europe Recent Past, Current & Future Analysis for Thrombectomy Devices by Type - Mechanical Thrombectomy, Rheolytic Thrombectomy and Aspiration Thrombectomy - Independent Analysis of Annual Sales in US$ Thousand for the Years 2023 through 2030 and % CAGR
- TABLE 135: Rest of Europe Historic Review for Thrombectomy Devices by Type - Mechanical Thrombectomy, Rheolytic Thrombectomy and Aspiration Thrombectomy Markets - Independent Analysis of Annual Sales in US$ Thousand for Years 2014 through 2022 and % CAGR
- TABLE 136: Rest of Europe 16-Year Perspective for Thrombectomy Devices by Type - Percentage Breakdown of Value Sales for Mechanical Thrombectomy, Rheolytic Thrombectomy and Aspiration Thrombectomy for the Years 2014, 2024 & 2030
- TABLE 137: Rest of Europe Recent Past, Current & Future Analysis for Thrombectomy Devices by Application - Neurovascular, Cardiovascular and Peripheral Vascular - Independent Analysis of Annual Sales in US$ Thousand for the Years 2023 through 2030 and % CAGR
- TABLE 138: Rest of Europe Historic Review for Thrombectomy Devices by Application - Neurovascular, Cardiovascular and Peripheral Vascular Markets - Independent Analysis of Annual Sales in US$ Thousand for Years 2014 through 2022 and % CAGR
- TABLE 139: Rest of Europe 16-Year Perspective for Thrombectomy Devices by Application - Percentage Breakdown of Value Sales for Neurovascular, Cardiovascular and Peripheral Vascular for the Years 2014, 2024 & 2030
- TABLE 140: Rest of Europe Recent Past, Current & Future Analysis for Thrombectomy Devices by End-Use - Hospitals, Ambulatory Surgery Centers and Other End-Uses - Independent Analysis of Annual Sales in US$ Thousand for the Years 2023 through 2030 and % CAGR
- TABLE 141: Rest of Europe Historic Review for Thrombectomy Devices by End-Use - Hospitals, Ambulatory Surgery Centers and Other End-Uses Markets - Independent Analysis of Annual Sales in US$ Thousand for Years 2014 through 2022 and % CAGR
- TABLE 142: Rest of Europe 16-Year Perspective for Thrombectomy Devices by End-Use - Percentage Breakdown of Value Sales for Hospitals, Ambulatory Surgery Centers and Other End-Uses for the Years 2014, 2024 & 2030
- ASIA-PACIFIC
- Thrombectomy Devices Market Presence - Strong/Active/Niche/Trivial - Key Competitors in Asia-Pacific for 2024 (E)
- TABLE 143: Asia-Pacific Recent Past, Current & Future Analysis for Thrombectomy Devices by Geographic Region - Australia, India, South Korea and Rest of Asia-Pacific Markets - Independent Analysis of Annual Sales in US$ Thousand for Years 2023 through 2030 and % CAGR
- TABLE 144: Asia-Pacific Historic Review for Thrombectomy Devices by Geographic Region - Australia, India, South Korea and Rest of Asia-Pacific Markets - Independent Analysis of Annual Sales in US$ Thousand for Years 2014 through 2022 and % CAGR
- TABLE 145: Asia-Pacific 16-Year Perspective for Thrombectomy Devices by Geographic Region - Percentage Breakdown of Value Sales for Australia, India, South Korea and Rest of Asia-Pacific Markets for Years 2014, 2024 & 2030
- TABLE 146: Asia-Pacific Recent Past, Current & Future Analysis for Thrombectomy Devices by Type - Mechanical Thrombectomy, Rheolytic Thrombectomy and Aspiration Thrombectomy - Independent Analysis of Annual Sales in US$ Thousand for the Years 2023 through 2030 and % CAGR
- TABLE 147: Asia-Pacific Historic Review for Thrombectomy Devices by Type - Mechanical Thrombectomy, Rheolytic Thrombectomy and Aspiration Thrombectomy Markets - Independent Analysis of Annual Sales in US$ Thousand for Years 2014 through 2022 and % CAGR
- TABLE 148: Asia-Pacific 16-Year Perspective for Thrombectomy Devices by Type - Percentage Breakdown of Value Sales for Mechanical Thrombectomy, Rheolytic Thrombectomy and Aspiration Thrombectomy for the Years 2014, 2024 & 2030
- TABLE 149: Asia-Pacific Recent Past, Current & Future Analysis for Thrombectomy Devices by Application - Neurovascular, Cardiovascular and Peripheral Vascular - Independent Analysis of Annual Sales in US$ Thousand for the Years 2023 through 2030 and % CAGR
- TABLE 150: Asia-Pacific Historic Review for Thrombectomy Devices by Application - Neurovascular, Cardiovascular and Peripheral Vascular Markets - Independent Analysis of Annual Sales in US$ Thousand for Years 2014 through 2022 and % CAGR
- TABLE 151: Asia-Pacific 16-Year Perspective for Thrombectomy Devices by Application - Percentage Breakdown of Value Sales for Neurovascular, Cardiovascular and Peripheral Vascular for the Years 2014, 2024 & 2030
- TABLE 152: Asia-Pacific Recent Past, Current & Future Analysis for Thrombectomy Devices by End-Use - Hospitals, Ambulatory Surgery Centers and Other End-Uses - Independent Analysis of Annual Sales in US$ Thousand for the Years 2023 through 2030 and % CAGR
- TABLE 153: Asia-Pacific Historic Review for Thrombectomy Devices by End-Use - Hospitals, Ambulatory Surgery Centers and Other End-Uses Markets - Independent Analysis of Annual Sales in US$ Thousand for Years 2014 through 2022 and % CAGR
- TABLE 154: Asia-Pacific 16-Year Perspective for Thrombectomy Devices by End-Use - Percentage Breakdown of Value Sales for Hospitals, Ambulatory Surgery Centers and Other End-Uses for the Years 2014, 2024 & 2030
- AUSTRALIA
- Thrombectomy Devices Market Presence - Strong/Active/Niche/Trivial - Key Competitors in Australia for 2024 (E)
- TABLE 155: Australia Recent Past, Current & Future Analysis for Thrombectomy Devices by Type - Mechanical Thrombectomy, Rheolytic Thrombectomy and Aspiration Thrombectomy - Independent Analysis of Annual Sales in US$ Thousand for the Years 2023 through 2030 and % CAGR
- TABLE 156: Australia Historic Review for Thrombectomy Devices by Type - Mechanical Thrombectomy, Rheolytic Thrombectomy and Aspiration Thrombectomy Markets - Independent Analysis of Annual Sales in US$ Thousand for Years 2014 through 2022 and % CAGR
- TABLE 157: Australia 16-Year Perspective for Thrombectomy Devices by Type - Percentage Breakdown of Value Sales for Mechanical Thrombectomy, Rheolytic Thrombectomy and Aspiration Thrombectomy for the Years 2014, 2024 & 2030
- TABLE 158: Australia Recent Past, Current & Future Analysis for Thrombectomy Devices by Application - Neurovascular, Cardiovascular and Peripheral Vascular - Independent Analysis of Annual Sales in US$ Thousand for the Years 2023 through 2030 and % CAGR
- TABLE 159: Australia Historic Review for Thrombectomy Devices by Application - Neurovascular, Cardiovascular and Peripheral Vascular Markets - Independent Analysis of Annual Sales in US$ Thousand for Years 2014 through 2022 and % CAGR
- TABLE 160: Australia 16-Year Perspective for Thrombectomy Devices by Application - Percentage Breakdown of Value Sales for Neurovascular, Cardiovascular and Peripheral Vascular for the Years 2014, 2024 & 2030
- TABLE 161: Australia Recent Past, Current & Future Analysis for Thrombectomy Devices by End-Use - Hospitals, Ambulatory Surgery Centers and Other End-Uses - Independent Analysis of Annual Sales in US$ Thousand for the Years 2023 through 2030 and % CAGR
- TABLE 162: Australia Historic Review for Thrombectomy Devices by End-Use - Hospitals, Ambulatory Surgery Centers and Other End-Uses Markets - Independent Analysis of Annual Sales in US$ Thousand for Years 2014 through 2022 and % CAGR
- TABLE 163: Australia 16-Year Perspective for Thrombectomy Devices by End-Use - Percentage Breakdown of Value Sales for Hospitals, Ambulatory Surgery Centers and Other End-Uses for the Years 2014, 2024 & 2030
- INDIA
- Thrombectomy Devices Market Presence - Strong/Active/Niche/Trivial - Key Competitors in India for 2024 (E)
- TABLE 164: India Recent Past, Current & Future Analysis for Thrombectomy Devices by Type - Mechanical Thrombectomy, Rheolytic Thrombectomy and Aspiration Thrombectomy - Independent Analysis of Annual Sales in US$ Thousand for the Years 2023 through 2030 and % CAGR
- TABLE 165: India Historic Review for Thrombectomy Devices by Type - Mechanical Thrombectomy, Rheolytic Thrombectomy and Aspiration Thrombectomy Markets - Independent Analysis of Annual Sales in US$ Thousand for Years 2014 through 2022 and % CAGR
- TABLE 166: India 16-Year Perspective for Thrombectomy Devices by Type - Percentage Breakdown of Value Sales for Mechanical Thrombectomy, Rheolytic Thrombectomy and Aspiration Thrombectomy for the Years 2014, 2024 & 2030
- TABLE 167: India Recent Past, Current & Future Analysis for Thrombectomy Devices by Application - Neurovascular, Cardiovascular and Peripheral Vascular - Independent Analysis of Annual Sales in US$ Thousand for the Years 2023 through 2030 and % CAGR
- TABLE 168: India Historic Review for Thrombectomy Devices by Application - Neurovascular, Cardiovascular and Peripheral Vascular Markets - Independent Analysis of Annual Sales in US$ Thousand for Years 2014 through 2022 and % CAGR
- TABLE 169: India 16-Year Perspective for Thrombectomy Devices by Application - Percentage Breakdown of Value Sales for Neurovascular, Cardiovascular and Peripheral Vascular for the Years 2014, 2024 & 2030
- TABLE 170: India Recent Past, Current & Future Analysis for Thrombectomy Devices by End-Use - Hospitals, Ambulatory Surgery Centers and Other End-Uses - Independent Analysis of Annual Sales in US$ Thousand for the Years 2023 through 2030 and % CAGR
- TABLE 171: India Historic Review for Thrombectomy Devices by End-Use - Hospitals, Ambulatory Surgery Centers and Other End-Uses Markets - Independent Analysis of Annual Sales in US$ Thousand for Years 2014 through 2022 and % CAGR
- TABLE 172: India 16-Year Perspective for Thrombectomy Devices by End-Use - Percentage Breakdown of Value Sales for Hospitals, Ambulatory Surgery Centers and Other End-Uses for the Years 2014, 2024 & 2030
- SOUTH KOREA
- TABLE 173: South Korea Recent Past, Current & Future Analysis for Thrombectomy Devices by Type - Mechanical Thrombectomy, Rheolytic Thrombectomy and Aspiration Thrombectomy - Independent Analysis of Annual Sales in US$ Thousand for the Years 2023 through 2030 and % CAGR
- TABLE 174: South Korea Historic Review for Thrombectomy Devices by Type - Mechanical Thrombectomy, Rheolytic Thrombectomy and Aspiration Thrombectomy Markets - Independent Analysis of Annual Sales in US$ Thousand for Years 2014 through 2022 and % CAGR
- TABLE 175: South Korea 16-Year Perspective for Thrombectomy Devices by Type - Percentage Breakdown of Value Sales for Mechanical Thrombectomy, Rheolytic Thrombectomy and Aspiration Thrombectomy for the Years 2014, 2024 & 2030
- TABLE 176: South Korea Recent Past, Current & Future Analysis for Thrombectomy Devices by Application - Neurovascular, Cardiovascular and Peripheral Vascular - Independent Analysis of Annual Sales in US$ Thousand for the Years 2023 through 2030 and % CAGR
- TABLE 177: South Korea Historic Review for Thrombectomy Devices by Application - Neurovascular, Cardiovascular and Peripheral Vascular Markets - Independent Analysis of Annual Sales in US$ Thousand for Years 2014 through 2022 and % CAGR
- TABLE 178: South Korea 16-Year Perspective for Thrombectomy Devices by Application - Percentage Breakdown of Value Sales for Neurovascular, Cardiovascular and Peripheral Vascular for the Years 2014, 2024 & 2030
- TABLE 179: South Korea Recent Past, Current & Future Analysis for Thrombectomy Devices by End-Use - Hospitals, Ambulatory Surgery Centers and Other End-Uses - Independent Analysis of Annual Sales in US$ Thousand for the Years 2023 through 2030 and % CAGR
- TABLE 180: South Korea Historic Review for Thrombectomy Devices by End-Use - Hospitals, Ambulatory Surgery Centers and Other End-Uses Markets - Independent Analysis of Annual Sales in US$ Thousand for Years 2014 through 2022 and % CAGR
- TABLE 181: South Korea 16-Year Perspective for Thrombectomy Devices by End-Use - Percentage Breakdown of Value Sales for Hospitals, Ambulatory Surgery Centers and Other End-Uses for the Years 2014, 2024 & 2030
- REST OF ASIA-PACIFIC
- TABLE 182: Rest of Asia-Pacific Recent Past, Current & Future Analysis for Thrombectomy Devices by Type - Mechanical Thrombectomy, Rheolytic Thrombectomy and Aspiration Thrombectomy - Independent Analysis of Annual Sales in US$ Thousand for the Years 2023 through 2030 and % CAGR
- TABLE 183: Rest of Asia-Pacific Historic Review for Thrombectomy Devices by Type - Mechanical Thrombectomy, Rheolytic Thrombectomy and Aspiration Thrombectomy Markets - Independent Analysis of Annual Sales in US$ Thousand for Years 2014 through 2022 and % CAGR
- TABLE 184: Rest of Asia-Pacific 16-Year Perspective for Thrombectomy Devices by Type - Percentage Breakdown of Value Sales for Mechanical Thrombectomy, Rheolytic Thrombectomy and Aspiration Thrombectomy for the Years 2014, 2024 & 2030
- TABLE 185: Rest of Asia-Pacific Recent Past, Current & Future Analysis for Thrombectomy Devices by Application - Neurovascular, Cardiovascular and Peripheral Vascular - Independent Analysis of Annual Sales in US$ Thousand for the Years 2023 through 2030 and % CAGR
- TABLE 186: Rest of Asia-Pacific Historic Review for Thrombectomy Devices by Application - Neurovascular, Cardiovascular and Peripheral Vascular Markets - Independent Analysis of Annual Sales in US$ Thousand for Years 2014 through 2022 and % CAGR
- TABLE 187: Rest of Asia-Pacific 16-Year Perspective for Thrombectomy Devices by Application - Percentage Breakdown of Value Sales for Neurovascular, Cardiovascular and Peripheral Vascular for the Years 2014, 2024 & 2030
- TABLE 188: Rest of Asia-Pacific Recent Past, Current & Future Analysis for Thrombectomy Devices by End-Use - Hospitals, Ambulatory Surgery Centers and Other End-Uses - Independent Analysis of Annual Sales in US$ Thousand for the Years 2023 through 2030 and % CAGR
- TABLE 189: Rest of Asia-Pacific Historic Review for Thrombectomy Devices by End-Use - Hospitals, Ambulatory Surgery Centers and Other End-Uses Markets - Independent Analysis of Annual Sales in US$ Thousand for Years 2014 through 2022 and % CAGR
- TABLE 190: Rest of Asia-Pacific 16-Year Perspective for Thrombectomy Devices by End-Use - Percentage Breakdown of Value Sales for Hospitals, Ambulatory Surgery Centers and Other End-Uses for the Years 2014, 2024 & 2030
- LATIN AMERICA
- Thrombectomy Devices Market Presence - Strong/Active/Niche/Trivial - Key Competitors in Latin America for 2024 (E)
- TABLE 191: Latin America Recent Past, Current & Future Analysis for Thrombectomy Devices by Geographic Region - Argentina, Brazil, Mexico and Rest of Latin America Markets - Independent Analysis of Annual Sales in US$ Thousand for Years 2023 through 2030 and % CAGR
- TABLE 192: Latin America Historic Review for Thrombectomy Devices by Geographic Region - Argentina, Brazil, Mexico and Rest of Latin America Markets - Independent Analysis of Annual Sales in US$ Thousand for Years 2014 through 2022 and % CAGR
- TABLE 193: Latin America 16-Year Perspective for Thrombectomy Devices by Geographic Region - Percentage Breakdown of Value Sales for Argentina, Brazil, Mexico and Rest of Latin America Markets for Years 2014, 2024 & 2030
- TABLE 194: Latin America Recent Past, Current & Future Analysis for Thrombectomy Devices by Type - Mechanical Thrombectomy, Rheolytic Thrombectomy and Aspiration Thrombectomy - Independent Analysis of Annual Sales in US$ Thousand for the Years 2023 through 2030 and % CAGR
- TABLE 195: Latin America Historic Review for Thrombectomy Devices by Type - Mechanical Thrombectomy, Rheolytic Thrombectomy and Aspiration Thrombectomy Markets - Independent Analysis of Annual Sales in US$ Thousand for Years 2014 through 2022 and % CAGR
- TABLE 196: Latin America 16-Year Perspective for Thrombectomy Devices by Type - Percentage Breakdown of Value Sales for Mechanical Thrombectomy, Rheolytic Thrombectomy and Aspiration Thrombectomy for the Years 2014, 2024 & 2030
- TABLE 197: Latin America Recent Past, Current & Future Analysis for Thrombectomy Devices by Application - Neurovascular, Cardiovascular and Peripheral Vascular - Independent Analysis of Annual Sales in US$ Thousand for the Years 2023 through 2030 and % CAGR
- TABLE 198: Latin America Historic Review for Thrombectomy Devices by Application - Neurovascular, Cardiovascular and Peripheral Vascular Markets - Independent Analysis of Annual Sales in US$ Thousand for Years 2014 through 2022 and % CAGR
- TABLE 199: Latin America 16-Year Perspective for Thrombectomy Devices by Application - Percentage Breakdown of Value Sales for Neurovascular, Cardiovascular and Peripheral Vascular for the Years 2014, 2024 & 2030
- TABLE 200: Latin America Recent Past, Current & Future Analysis for Thrombectomy Devices by End-Use - Hospitals, Ambulatory Surgery Centers and Other End-Uses - Independent Analysis of Annual Sales in US$ Thousand for the Years 2023 through 2030 and % CAGR
- TABLE 201: Latin America Historic Review for Thrombectomy Devices by End-Use - Hospitals, Ambulatory Surgery Centers and Other End-Uses Markets - Independent Analysis of Annual Sales in US$ Thousand for Years 2014 through 2022 and % CAGR
- TABLE 202: Latin America 16-Year Perspective for Thrombectomy Devices by End-Use - Percentage Breakdown of Value Sales for Hospitals, Ambulatory Surgery Centers and Other End-Uses for the Years 2014, 2024 & 2030
- ARGENTINA
- TABLE 203: Argentina Recent Past, Current & Future Analysis for Thrombectomy Devices by Type - Mechanical Thrombectomy, Rheolytic Thrombectomy and Aspiration Thrombectomy - Independent Analysis of Annual Sales in US$ Thousand for the Years 2023 through 2030 and % CAGR
- TABLE 204: Argentina Historic Review for Thrombectomy Devices by Type - Mechanical Thrombectomy, Rheolytic Thrombectomy and Aspiration Thrombectomy Markets - Independent Analysis of Annual Sales in US$ Thousand for Years 2014 through 2022 and % CAGR
- TABLE 205: Argentina 16-Year Perspective for Thrombectomy Devices by Type - Percentage Breakdown of Value Sales for Mechanical Thrombectomy, Rheolytic Thrombectomy and Aspiration Thrombectomy for the Years 2014, 2024 & 2030
- TABLE 206: Argentina Recent Past, Current & Future Analysis for Thrombectomy Devices by Application - Neurovascular, Cardiovascular and Peripheral Vascular - Independent Analysis of Annual Sales in US$ Thousand for the Years 2023 through 2030 and % CAGR
- TABLE 207: Argentina Historic Review for Thrombectomy Devices by Application - Neurovascular, Cardiovascular and Peripheral Vascular Markets - Independent Analysis of Annual Sales in US$ Thousand for Years 2014 through 2022 and % CAGR
- TABLE 208: Argentina 16-Year Perspective for Thrombectomy Devices by Application - Percentage Breakdown of Value Sales for Neurovascular, Cardiovascular and Peripheral Vascular for the Years 2014, 2024 & 2030
- TABLE 209: Argentina Recent Past, Current & Future Analysis for Thrombectomy Devices by End-Use - Hospitals, Ambulatory Surgery Centers and Other End-Uses - Independent Analysis of Annual Sales in US$ Thousand for the Years 2023 through 2030 and % CAGR
- TABLE 210: Argentina Historic Review for Thrombectomy Devices by End-Use - Hospitals, Ambulatory Surgery Centers and Other End-Uses Markets - Independent Analysis of Annual Sales in US$ Thousand for Years 2014 through 2022 and % CAGR
- TABLE 211: Argentina 16-Year Perspective for Thrombectomy Devices by End-Use - Percentage Breakdown of Value Sales for Hospitals, Ambulatory Surgery Centers and Other End-Uses for the Years 2014, 2024 & 2030
- BRAZIL
- TABLE 212: Brazil Recent Past, Current & Future Analysis for Thrombectomy Devices by Type - Mechanical Thrombectomy, Rheolytic Thrombectomy and Aspiration Thrombectomy - Independent Analysis of Annual Sales in US$ Thousand for the Years 2023 through 2030 and % CAGR
- TABLE 213: Brazil Historic Review for Thrombectomy Devices by Type - Mechanical Thrombectomy, Rheolytic Thrombectomy and Aspiration Thrombectomy Markets - Independent Analysis of Annual Sales in US$ Thousand for Years 2014 through 2022 and % CAGR
- TABLE 214: Brazil 16-Year Perspective for Thrombectomy Devices by Type - Percentage Breakdown of Value Sales for Mechanical Thrombectomy, Rheolytic Thrombectomy and Aspiration Thrombectomy for the Years 2014, 2024 & 2030
- TABLE 215: Brazil Recent Past, Current & Future Analysis for Thrombectomy Devices by Application - Neurovascular, Cardiovascular and Peripheral Vascular - Independent Analysis of Annual Sales in US$ Thousand for the Years 2023 through 2030 and % CAGR
- TABLE 216: Brazil Historic Review for Thrombectomy Devices by Application - Neurovascular, Cardiovascular and Peripheral Vascular Markets - Independent Analysis of Annual Sales in US$ Thousand for Years 2014 through 2022 and % CAGR
- TABLE 217: Brazil 16-Year Perspective for Thrombectomy Devices by Application - Percentage Breakdown of Value Sales for Neurovascular, Cardiovascular and Peripheral Vascular for the Years 2014, 2024 & 2030
- TABLE 218: Brazil Recent Past, Current & Future Analysis for Thrombectomy Devices by End-Use - Hospitals, Ambulatory Surgery Centers and Other End-Uses - Independent Analysis of Annual Sales in US$ Thousand for the Years 2023 through 2030 and % CAGR
- TABLE 219: Brazil Historic Review for Thrombectomy Devices by End-Use - Hospitals, Ambulatory Surgery Centers and Other End-Uses Markets - Independent Analysis of Annual Sales in US$ Thousand for Years 2014 through 2022 and % CAGR
- TABLE 220: Brazil 16-Year Perspective for Thrombectomy Devices by End-Use - Percentage Breakdown of Value Sales for Hospitals, Ambulatory Surgery Centers and Other End-Uses for the Years 2014, 2024 & 2030
- MEXICO
- TABLE 221: Mexico Recent Past, Current & Future Analysis for Thrombectomy Devices by Type - Mechanical Thrombectomy, Rheolytic Thrombectomy and Aspiration Thrombectomy - Independent Analysis of Annual Sales in US$ Thousand for the Years 2023 through 2030 and % CAGR
- TABLE 222: Mexico Historic Review for Thrombectomy Devices by Type - Mechanical Thrombectomy, Rheolytic Thrombectomy and Aspiration Thrombectomy Markets - Independent Analysis of Annual Sales in US$ Thousand for Years 2014 through 2022 and % CAGR
- TABLE 223: Mexico 16-Year Perspective for Thrombectomy Devices by Type - Percentage Breakdown of Value Sales for Mechanical Thrombectomy, Rheolytic Thrombectomy and Aspiration Thrombectomy for the Years 2014, 2024 & 2030
- TABLE 224: Mexico Recent Past, Current & Future Analysis for Thrombectomy Devices by Application - Neurovascular, Cardiovascular and Peripheral Vascular - Independent Analysis of Annual Sales in US$ Thousand for the Years 2023 through 2030 and % CAGR
- TABLE 225: Mexico Historic Review for Thrombectomy Devices by Application - Neurovascular, Cardiovascular and Peripheral Vascular Markets - Independent Analysis of Annual Sales in US$ Thousand for Years 2014 through 2022 and % CAGR
- TABLE 226: Mexico 16-Year Perspective for Thrombectomy Devices by Application - Percentage Breakdown of Value Sales for Neurovascular, Cardiovascular and Peripheral Vascular for the Years 2014, 2024 & 2030
- TABLE 227: Mexico Recent Past, Current & Future Analysis for Thrombectomy Devices by End-Use - Hospitals, Ambulatory Surgery Centers and Other End-Uses - Independent Analysis of Annual Sales in US$ Thousand for the Years 2023 through 2030 and % CAGR
- TABLE 228: Mexico Historic Review for Thrombectomy Devices by End-Use - Hospitals, Ambulatory Surgery Centers and Other End-Uses Markets - Independent Analysis of Annual Sales in US$ Thousand for Years 2014 through 2022 and % CAGR
- TABLE 229: Mexico 16-Year Perspective for Thrombectomy Devices by End-Use - Percentage Breakdown of Value Sales for Hospitals, Ambulatory Surgery Centers and Other End-Uses for the Years 2014, 2024 & 2030
- REST OF LATIN AMERICA
- TABLE 230: Rest of Latin America Recent Past, Current & Future Analysis for Thrombectomy Devices by Type - Mechanical Thrombectomy, Rheolytic Thrombectomy and Aspiration Thrombectomy - Independent Analysis of Annual Sales in US$ Thousand for the Years 2023 through 2030 and % CAGR
- TABLE 231: Rest of Latin America Historic Review for Thrombectomy Devices by Type - Mechanical Thrombectomy, Rheolytic Thrombectomy and Aspiration Thrombectomy Markets - Independent Analysis of Annual Sales in US$ Thousand for Years 2014 through 2022 and % CAGR
- TABLE 232: Rest of Latin America 16-Year Perspective for Thrombectomy Devices by Type - Percentage Breakdown of Value Sales for Mechanical Thrombectomy, Rheolytic Thrombectomy and Aspiration Thrombectomy for the Years 2014, 2024 & 2030
- TABLE 233: Rest of Latin America Recent Past, Current & Future Analysis for Thrombectomy Devices by Application - Neurovascular, Cardiovascular and Peripheral Vascular - Independent Analysis of Annual Sales in US$ Thousand for the Years 2023 through 2030 and % CAGR
- TABLE 234: Rest of Latin America Historic Review for Thrombectomy Devices by Application - Neurovascular, Cardiovascular and Peripheral Vascular Markets - Independent Analysis of Annual Sales in US$ Thousand for Years 2014 through 2022 and % CAGR
- TABLE 235: Rest of Latin America 16-Year Perspective for Thrombectomy Devices by Application - Percentage Breakdown of Value Sales for Neurovascular, Cardiovascular and Peripheral Vascular for the Years 2014, 2024 & 2030
- TABLE 236: Rest of Latin America Recent Past, Current & Future Analysis for Thrombectomy Devices by End-Use - Hospitals, Ambulatory Surgery Centers and Other End-Uses - Independent Analysis of Annual Sales in US$ Thousand for the Years 2023 through 2030 and % CAGR
- TABLE 237: Rest of Latin America Historic Review for Thrombectomy Devices by End-Use - Hospitals, Ambulatory Surgery Centers and Other End-Uses Markets - Independent Analysis of Annual Sales in US$ Thousand for Years 2014 through 2022 and % CAGR
- TABLE 238: Rest of Latin America 16-Year Perspective for Thrombectomy Devices by End-Use - Percentage Breakdown of Value Sales for Hospitals, Ambulatory Surgery Centers and Other End-Uses for the Years 2014, 2024 & 2030
- MIDDLE EAST
- Thrombectomy Devices Market Presence - Strong/Active/Niche/Trivial - Key Competitors in Middle East for 2024 (E)
- TABLE 239: Middle East Recent Past, Current & Future Analysis for Thrombectomy Devices by Geographic Region - Iran, Israel, Saudi Arabia, UAE and Rest of Middle East Markets - Independent Analysis of Annual Sales in US$ Thousand for Years 2023 through 2030 and % CAGR
- TABLE 240: Middle East Historic Review for Thrombectomy Devices by Geographic Region - Iran, Israel, Saudi Arabia, UAE and Rest of Middle East Markets - Independent Analysis of Annual Sales in US$ Thousand for Years 2014 through 2022 and % CAGR
- TABLE 241: Middle East 16-Year Perspective for Thrombectomy Devices by Geographic Region - Percentage Breakdown of Value Sales for Iran, Israel, Saudi Arabia, UAE and Rest of Middle East Markets for Years 2014, 2024 & 2030
- TABLE 242: Middle East Recent Past, Current & Future Analysis for Thrombectomy Devices by Type - Mechanical Thrombectomy, Rheolytic Thrombectomy and Aspiration Thrombectomy - Independent Analysis of Annual Sales in US$ Thousand for the Years 2023 through 2030 and % CAGR
- TABLE 243: Middle East Historic Review for Thrombectomy Devices by Type - Mechanical Thrombectomy, Rheolytic Thrombectomy and Aspiration Thrombectomy Markets - Independent Analysis of Annual Sales in US$ Thousand for Years 2014 through 2022 and % CAGR
- TABLE 244: Middle East 16-Year Perspective for Thrombectomy Devices by Type - Percentage Breakdown of Value Sales for Mechanical Thrombectomy, Rheolytic Thrombectomy and Aspiration Thrombectomy for the Years 2014, 2024 & 2030
- TABLE 245: Middle East Recent Past, Current & Future Analysis for Thrombectomy Devices by Application - Neurovascular, Cardiovascular and Peripheral Vascular - Independent Analysis of Annual Sales in US$ Thousand for the Years 2023 through 2030 and % CAGR
- TABLE 246: Middle East Historic Review for Thrombectomy Devices by Application - Neurovascular, Cardiovascular and Peripheral Vascular Markets - Independent Analysis of Annual Sales in US$ Thousand for Years 2014 through 2022 and % CAGR
- TABLE 247: Middle East 16-Year Perspective for Thrombectomy Devices by Application - Percentage Breakdown of Value Sales for Neurovascular, Cardiovascular and Peripheral Vascular for the Years 2014, 2024 & 2030
- TABLE 248: Middle East Recent Past, Current & Future Analysis for Thrombectomy Devices by End-Use - Hospitals, Ambulatory Surgery Centers and Other End-Uses - Independent Analysis of Annual Sales in US$ Thousand for the Years 2023 through 2030 and % CAGR
- TABLE 249: Middle East Historic Review for Thrombectomy Devices by End-Use - Hospitals, Ambulatory Surgery Centers and Other End-Uses Markets - Independent Analysis of Annual Sales in US$ Thousand for Years 2014 through 2022 and % CAGR
- TABLE 250: Middle East 16-Year Perspective for Thrombectomy Devices by End-Use - Percentage Breakdown of Value Sales for Hospitals, Ambulatory Surgery Centers and Other End-Uses for the Years 2014, 2024 & 2030
- IRAN
- TABLE 251: Iran Recent Past, Current & Future Analysis for Thrombectomy Devices by Type - Mechanical Thrombectomy, Rheolytic Thrombectomy and Aspiration Thrombectomy - Independent Analysis of Annual Sales in US$ Thousand for the Years 2023 through 2030 and % CAGR
- TABLE 252: Iran Historic Review for Thrombectomy Devices by Type - Mechanical Thrombectomy, Rheolytic Thrombectomy and Aspiration Thrombectomy Markets - Independent Analysis of Annual Sales in US$ Thousand for Years 2014 through 2022 and % CAGR
- TABLE 253: Iran 16-Year Perspective for Thrombectomy Devices by Type - Percentage Breakdown of Value Sales for Mechanical Thrombectomy, Rheolytic Thrombectomy and Aspiration Thrombectomy for the Years 2014, 2024 & 2030
- TABLE 254: Iran Recent Past, Current & Future Analysis for Thrombectomy Devices by Application - Neurovascular, Cardiovascular and Peripheral Vascular - Independent Analysis of Annual Sales in US$ Thousand for the Years 2023 through 2030 and % CAGR
- TABLE 255: Iran Historic Review for Thrombectomy Devices by Application - Neurovascular, Cardiovascular and Peripheral Vascular Markets - Independent Analysis of Annual Sales in US$ Thousand for Years 2014 through 2022 and % CAGR
- TABLE 256: Iran 16-Year Perspective for Thrombectomy Devices by Application - Percentage Breakdown of Value Sales for Neurovascular, Cardiovascular and Peripheral Vascular for the Years 2014, 2024 & 2030
- TABLE 257: Iran Recent Past, Current & Future Analysis for Thrombectomy Devices by End-Use - Hospitals, Ambulatory Surgery Centers and Other End-Uses - Independent Analysis of Annual Sales in US$ Thousand for the Years 2023 through 2030 and % CAGR
- TABLE 258: Iran Historic Review for Thrombectomy Devices by End-Use - Hospitals, Ambulatory Surgery Centers and Other End-Uses Markets - Independent Analysis of Annual Sales in US$ Thousand for Years 2014 through 2022 and % CAGR
- TABLE 259: Iran 16-Year Perspective for Thrombectomy Devices by End-Use - Percentage Breakdown of Value Sales for Hospitals, Ambulatory Surgery Centers and Other End-Uses for the Years 2014, 2024 & 2030
- ISRAEL
- TABLE 260: Israel Recent Past, Current & Future Analysis for Thrombectomy Devices by Type - Mechanical Thrombectomy, Rheolytic Thrombectomy and Aspiration Thrombectomy - Independent Analysis of Annual Sales in US$ Thousand for the Years 2023 through 2030 and % CAGR
- TABLE 261: Israel Historic Review for Thrombectomy Devices by Type - Mechanical Thrombectomy, Rheolytic Thrombectomy and Aspiration Thrombectomy Markets - Independent Analysis of Annual Sales in US$ Thousand for Years 2014 through 2022 and % CAGR
- TABLE 262: Israel 16-Year Perspective for Thrombectomy Devices by Type - Percentage Breakdown of Value Sales for Mechanical Thrombectomy, Rheolytic Thrombectomy and Aspiration Thrombectomy for the Years 2014, 2024 & 2030
- TABLE 263: Israel Recent Past, Current & Future Analysis for Thrombectomy Devices by Application - Neurovascular, Cardiovascular and Peripheral Vascular - Independent Analysis of Annual Sales in US$ Thousand for the Years 2023 through 2030 and % CAGR
- TABLE 264: Israel Historic Review for Thrombectomy Devices by Application - Neurovascular, Cardiovascular and Peripheral Vascular Markets - Independent Analysis of Annual Sales in US$ Thousand for Years 2014 through 2022 and % CAGR
- TABLE 265: Israel 16-Year Perspective for Thrombectomy Devices by Application - Percentage Breakdown of Value Sales for Neurovascular, Cardiovascular and Peripheral Vascular for the Years 2014, 2024 & 2030
- TABLE 266: Israel Recent Past, Current & Future Analysis for Thrombectomy Devices by End-Use - Hospitals, Ambulatory Surgery Centers and Other End-Uses - Independent Analysis of Annual Sales in US$ Thousand for the Years 2023 through 2030 and % CAGR
- TABLE 267: Israel Historic Review for Thrombectomy Devices by End-Use - Hospitals, Ambulatory Surgery Centers and Other End-Uses Markets - Independent Analysis of Annual Sales in US$ Thousand for Years 2014 through 2022 and % CAGR
- TABLE 268: Israel 16-Year Perspective for Thrombectomy Devices by End-Use - Percentage Breakdown of Value Sales for Hospitals, Ambulatory Surgery Centers and Other End-Uses for the Years 2014, 2024 & 2030
- SAUDI ARABIA
- TABLE 269: Saudi Arabia Recent Past, Current & Future Analysis for Thrombectomy Devices by Type - Mechanical Thrombectomy, Rheolytic Thrombectomy and Aspiration Thrombectomy - Independent Analysis of Annual Sales in US$ Thousand for the Years 2023 through 2030 and % CAGR
- TABLE 270: Saudi Arabia Historic Review for Thrombectomy Devices by Type - Mechanical Thrombectomy, Rheolytic Thrombectomy and Aspiration Thrombectomy Markets - Independent Analysis of Annual Sales in US$ Thousand for Years 2014 through 2022 and % CAGR
- TABLE 271: Saudi Arabia 16-Year Perspective for Thrombectomy Devices by Type - Percentage Breakdown of Value Sales for Mechanical Thrombectomy, Rheolytic Thrombectomy and Aspiration Thrombectomy for the Years 2014, 2024 & 2030
- TABLE 272: Saudi Arabia Recent Past, Current & Future Analysis for Thrombectomy Devices by Application - Neurovascular, Cardiovascular and Peripheral Vascular - Independent Analysis of Annual Sales in US$ Thousand for the Years 2023 through 2030 and % CAGR
- TABLE 273: Saudi Arabia Historic Review for Thrombectomy Devices by Application - Neurovascular, Cardiovascular and Peripheral Vascular Markets - Independent Analysis of Annual Sales in US$ Thousand for Years 2014 through 2022 and % CAGR
- TABLE 274: Saudi Arabia 16-Year Perspective for Thrombectomy Devices by Application - Percentage Breakdown of Value Sales for Neurovascular, Cardiovascular and Peripheral Vascular for the Years 2014, 2024 & 2030
- TABLE 275: Saudi Arabia Recent Past, Current & Future Analysis for Thrombectomy Devices by End-Use - Hospitals, Ambulatory Surgery Centers and Other End-Uses - Independent Analysis of Annual Sales in US$ Thousand for the Years 2023 through 2030 and % CAGR
- TABLE 276: Saudi Arabia Historic Review for Thrombectomy Devices by End-Use - Hospitals, Ambulatory Surgery Centers and Other End-Uses Markets - Independent Analysis of Annual Sales in US$ Thousand for Years 2014 through 2022 and % CAGR
- TABLE 277: Saudi Arabia 16-Year Perspective for Thrombectomy Devices by End-Use - Percentage Breakdown of Value Sales for Hospitals, Ambulatory Surgery Centers and Other End-Uses for the Years 2014, 2024 & 2030
- UNITED ARAB EMIRATES
- TABLE 278: UAE Recent Past, Current & Future Analysis for Thrombectomy Devices by Type - Mechanical Thrombectomy, Rheolytic Thrombectomy and Aspiration Thrombectomy - Independent Analysis of Annual Sales in US$ Thousand for the Years 2023 through 2030 and % CAGR
- TABLE 279: UAE Historic Review for Thrombectomy Devices by Type - Mechanical Thrombectomy, Rheolytic Thrombectomy and Aspiration Thrombectomy Markets - Independent Analysis of Annual Sales in US$ Thousand for Years 2014 through 2022 and % CAGR
- TABLE 280: UAE 16-Year Perspective for Thrombectomy Devices by Type - Percentage Breakdown of Value Sales for Mechanical Thrombectomy, Rheolytic Thrombectomy and Aspiration Thrombectomy for the Years 2014, 2024 & 2030
- TABLE 281: UAE Recent Past, Current & Future Analysis for Thrombectomy Devices by Application - Neurovascular, Cardiovascular and Peripheral Vascular - Independent Analysis of Annual Sales in US$ Thousand for the Years 2023 through 2030 and % CAGR
- TABLE 282: UAE Historic Review for Thrombectomy Devices by Application - Neurovascular, Cardiovascular and Peripheral Vascular Markets - Independent Analysis of Annual Sales in US$ Thousand for Years 2014 through 2022 and % CAGR
- TABLE 283: UAE 16-Year Perspective for Thrombectomy Devices by Application - Percentage Breakdown of Value Sales for Neurovascular, Cardiovascular and Peripheral Vascular for the Years 2014, 2024 & 2030
- TABLE 284: UAE Recent Past, Current & Future Analysis for Thrombectomy Devices by End-Use - Hospitals, Ambulatory Surgery Centers and Other End-Uses - Independent Analysis of Annual Sales in US$ Thousand for the Years 2023 through 2030 and % CAGR
- TABLE 285: UAE Historic Review for Thrombectomy Devices by End-Use - Hospitals, Ambulatory Surgery Centers and Other End-Uses Markets - Independent Analysis of Annual Sales in US$ Thousand for Years 2014 through 2022 and % CAGR
- TABLE 286: UAE 16-Year Perspective for Thrombectomy Devices by End-Use - Percentage Breakdown of Value Sales for Hospitals, Ambulatory Surgery Centers and Other End-Uses for the Years 2014, 2024 & 2030
- REST OF MIDDLE EAST
- TABLE 287: Rest of Middle East Recent Past, Current & Future Analysis for Thrombectomy Devices by Type - Mechanical Thrombectomy, Rheolytic Thrombectomy and Aspiration Thrombectomy - Independent Analysis of Annual Sales in US$ Thousand for the Years 2023 through 2030 and % CAGR
- TABLE 288: Rest of Middle East Historic Review for Thrombectomy Devices by Type - Mechanical Thrombectomy, Rheolytic Thrombectomy and Aspiration Thrombectomy Markets - Independent Analysis of Annual Sales in US$ Thousand for Years 2014 through 2022 and % CAGR
- TABLE 289: Rest of Middle East 16-Year Perspective for Thrombectomy Devices by Type - Percentage Breakdown of Value Sales for Mechanical Thrombectomy, Rheolytic Thrombectomy and Aspiration Thrombectomy for the Years 2014, 2024 & 2030
- TABLE 290: Rest of Middle East Recent Past, Current & Future Analysis for Thrombectomy Devices by Application - Neurovascular, Cardiovascular and Peripheral Vascular - Independent Analysis of Annual Sales in US$ Thousand for the Years 2023 through 2030 and % CAGR
- TABLE 291: Rest of Middle East Historic Review for Thrombectomy Devices by Application - Neurovascular, Cardiovascular and Peripheral Vascular Markets - Independent Analysis of Annual Sales in US$ Thousand for Years 2014 through 2022 and % CAGR
- TABLE 292: Rest of Middle East 16-Year Perspective for Thrombectomy Devices by Application - Percentage Breakdown of Value Sales for Neurovascular, Cardiovascular and Peripheral Vascular for the Years 2014, 2024 & 2030
- TABLE 293: Rest of Middle East Recent Past, Current & Future Analysis for Thrombectomy Devices by End-Use - Hospitals, Ambulatory Surgery Centers and Other End-Uses - Independent Analysis of Annual Sales in US$ Thousand for the Years 2023 through 2030 and % CAGR
- TABLE 294: Rest of Middle East Historic Review for Thrombectomy Devices by End-Use - Hospitals, Ambulatory Surgery Centers and Other End-Uses Markets - Independent Analysis of Annual Sales in US$ Thousand for Years 2014 through 2022 and % CAGR
- TABLE 295: Rest of Middle East 16-Year Perspective for Thrombectomy Devices by End-Use - Percentage Breakdown of Value Sales for Hospitals, Ambulatory Surgery Centers and Other End-Uses for the Years 2014, 2024 & 2030
- AFRICA
- Thrombectomy Devices Market Presence - Strong/Active/Niche/Trivial - Key Competitors in Africa for 2024 (E)
- TABLE 296: Africa Recent Past, Current & Future Analysis for Thrombectomy Devices by Type - Mechanical Thrombectomy, Rheolytic Thrombectomy and Aspiration Thrombectomy - Independent Analysis of Annual Sales in US$ Thousand for the Years 2023 through 2030 and % CAGR
- TABLE 297: Africa Historic Review for Thrombectomy Devices by Type - Mechanical Thrombectomy, Rheolytic Thrombectomy and Aspiration Thrombectomy Markets - Independent Analysis of Annual Sales in US$ Thousand for Years 2014 through 2022 and % CAGR
- TABLE 298: Africa 16-Year Perspective for Thrombectomy Devices by Type - Percentage Breakdown of Value Sales for Mechanical Thrombectomy, Rheolytic Thrombectomy and Aspiration Thrombectomy for the Years 2014, 2024 & 2030
- TABLE 299: Africa Recent Past, Current & Future Analysis for Thrombectomy Devices by Application - Neurovascular, Cardiovascular and Peripheral Vascular - Independent Analysis of Annual Sales in US$ Thousand for the Years 2023 through 2030 and % CAGR
- TABLE 300: Africa Historic Review for Thrombectomy Devices by Application - Neurovascular, Cardiovascular and Peripheral Vascular Markets - Independent Analysis of Annual Sales in US$ Thousand for Years 2014 through 2022 and % CAGR
- TABLE 301: Africa 16-Year Perspective for Thrombectomy Devices by Application - Percentage Breakdown of Value Sales for Neurovascular, Cardiovascular and Peripheral Vascular for the Years 2014, 2024 & 2030
- TABLE 302: Africa Recent Past, Current & Future Analysis for Thrombectomy Devices by End-Use - Hospitals, Ambulatory Surgery Centers and Other End-Uses - Independent Analysis of Annual Sales in US$ Thousand for the Years 2023 through 2030 and % CAGR
- TABLE 303: Africa Historic Review for Thrombectomy Devices by End-Use - Hospitals, Ambulatory Surgery Centers and Other End-Uses Markets - Independent Analysis of Annual Sales in US$ Thousand for Years 2014 through 2022 and % CAGR
- TABLE 304: Africa 16-Year Perspective for Thrombectomy Devices by End-Use - Percentage Breakdown of Value Sales for Hospitals, Ambulatory Surgery Centers and Other End-Uses for the Years 2014, 2024 & 2030