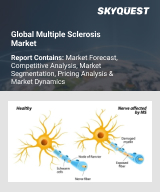
|
시장보고서
상품코드
1771503
다발성 경화증 치료제 시장 규모, 점유율, 동향 분석 보고서 : 약물 종류별, 투여 경로별, 유통 채널별, 지역별, 부문별 예측(2025-2030년)Multiple Sclerosis Therapeutic Market Size, Share & Trends Analysis Report By Drug Class (Immunosuppressants, Immunostimulants), By Route Of Administration (Oral, Injectable), By Distribution Channel, By Region, And Segment Forecasts, 2025 - 2030 |
||||||
다발성 경화증 치료제 시장 성장과 동향:
Grand View Research, Inc.의 최신 보고서에 따르면, 세계 다발성 경화증 치료제 시장 규모는 2025년부터 2030년까지 5.93%의 CAGR을 기록하며 2030년까지 386억 2,000만 달러에 달할 것으로 예상됩니다.
신흥 시장에서의 높은 임상적 미충족 수요는 다발성 경화증 치료제 시장의 가장 영향력 있는 촉진요인 중 하나입니다. 전 세계 많은 단체들이 진행성 다발성 경화증 및 관련 증상에 대한 인식 개선에 적극적으로 참여하고 있습니다. 미국의 National Multiple Sclerosis Society(NMSS), 캐나다의 Multiple Sclerosis International Federation, European Multiple Sclerosis Platform(EMSP), Multiple Sclerosis Society(MSC) 등이 있습니다.
상환 프로그램도 다발성 경화증 치료제의 보급을 증가시킬 것으로 예상됩니다. 예를 들어, 2014년 6월 바이오젠 아이덱 캐나다(Biogen Idec Canada)는 자사의 다발성 경화증 치료제 TECFIDERA가 B.C. PharmaCare를 통해 영국 콜롬비아에서 급여를 받을 수 있게 되었다고 발표하였습니다.
최소 용량으로 비용 효율적인 새로운 치료제의 도입은 시장 성장을 더욱 촉진할 것으로 예상됩니다. 예를 들어, 사노피의 렘트라다(Lemtrada)는 매일 복용해야 하는 코팍손(Copaxone)에 비해 1년에 3-5회만 복용하면 됩니다.
다발성 경화증 치료제 시장 : 분석 개요
- 약제 클래스별로는 면역억제제가 2024년 매출 점유율 60.50%를 차지하며 시장을 주도했습니다. 강력한 약물 파이프라인의 존재와 향후 6년 이내에 상용화될 것으로 예상되는 약물이 시장 성장을 견인할 것으로 예상되는 몇 가지 요인이 있습니다.
- 투여 경로별로는 경구제가 예측 기간 동안 가장 빠른 CAGR로 성장할 것으로 예상됩니다.
- 2024년, 주사제 시장은 52.50%의 가장 큰 점유율을 차지했습니다.
- 2024년 북미가 38.28%의 점유율로 세계 시장을 독점했습니다. 다발성 경화증 유병률 증가, 신약의 도입, 미국에서의 타이사브리, 오버지오 등의 높은 약가 등이 그 우위 요인으로 작용할 것으로 예상됩니다.
목차
제1장 분석 방법·범위
제2장 주요 요약
제3장 다발성 경화증 치료제 시장 : 변수, 동향, 범위
- 시장 개요/연관 전망
- 시장 규모와 성장 전망
- 시장 역학
- 시장 성장 촉진요인 분석
- 시장 성장 억제요인 분석
- 다발성 경화증 치료제 시장 : 분석 툴
- 업계 분석 : Porter's Five Forces 분석
- PESTEL 분석
제4장 다발성 경화증 치료제 시장 : 약물 클래스별 추정·동향 분석
- 부문 대시보드
- 다발성 경화증 치료제 시장 : 변동 분석, 약물 클래스별(2024년·2030년)
- 면역억제제
- 면역자극제
제5장 다발성 경화증 치료제 시장 : 투여 경로별 추정·동향 분석
- 부문 대시보드
- 다발성 경화증 치료제 시장 : 변동 분석, 투여 경로별(2024년·2030년)
- 경구제
- 주사제
- 기타
제6장 다발성 경화증 치료제 시장 : 유통 채널별 추정·동향 분석
- 부문 대시보드
- 다발성 경화증 치료제 시장 : 변동 분석, 유통 채널별(2024년·2030년)
- 병원 약국
- 소매 약국
- E-Commerce
제7장 다발성 경화증 치료제 시장 : 지역별 추정·동향 분석
- 다발성 경화증 치료제 시장 점유율 : 지역별(2024년·2030년)
- 북미
- 미국
- 캐나다
- 멕시코
- 유럽
- 영국
- 독일
- 프랑스
- 이탈리아
- 스페인
- 덴마크
- 스웨덴
- 노르웨이
- 아시아태평양
- 중국
- 일본
- 인도
- 한국
- 호주
- 태국
- 라틴아메리카
- 브라질
- 아르헨티나
- 중동 및 아프리카
- 남아프리카공화국
- 사우디아라비아
- 아랍에미리트
- 쿠웨이트
제8장 경쟁 구도
- 최근 동향과 영향 분석 : 주요 시장 진입 기업별
- 기업 분류
- 기업 히트맵 분석
- 기업 개요
- Teva Pharmaceutical Industries Ltd.
- Pfizer Inc.
- Biogen
- Bayer AG
- Sanofi
- F. Hoffman-La Roche Ltd
- Johnson & Johnson Services, Inc.
- Merck & Co., Inc.
- Takeda Pharmaceuticals Company Limited.
- Horizon Therapeutics plc
Multiple Sclerosis Therapeutic Market Growth & Trends:
The global multiple sclerosis therapeutic market size is estimated to reach USD 38.62 billion by 2030, registering a CAGR of 5.93% from 2025 to 2030, according to a new report by Grand View Research, Inc. The presence of high unmet clinical needs in developing regions is one of the highest impact rendering drivers of the multiple sclerosis therapeutics market. Many organizations over the globe are actively involved in spreading awareness among people regarding progressive multiple sclerosis and the symptoms associated with it. Some notable examples include the National Multiple Sclerosis Society (NMSS) in the U.S., Multiple Sclerosis International Federation in Canada, European Multiple Sclerosis Platform (EMSP), and the Multiple Sclerosis Society (MSC).
Reimbursement programs are also anticipated to enhance the penetration of multiple sclerosis drugs. For instance, In June 2014, Biogen Idec Canada, announced that its TECFIDERA drug for the treatment of MS is available for reimbursement in British Colombia through B.C PharmaCare.
The introduction of novel therapeutics with minimal dosage requirement and cost-effectiveness is further expected to favor market growth. For, instance Lemtrada by Sanofi needs to be administered 3-5 times per year as compared to Copaxone, which requires daily administration.
Multiple Sclerosis Therapeutic Market Report Highlights:
- Based on drug class, the immunosuppressant segment dominated the market with the largest revenue share of 60.50% in 2024. The presence of a strong drug pipeline and its expected commercialization in the coming six years are some factors expected to drive market growth.
- Based on route of administration, the oral segment is expected to grow at the fastest CAGR rate over the forecast period, propelled by increasing patient preference for convenient, home-based treatment options.
- In 2024, the injectable market held the largest share of 52.50% in 2024, owing to high prescription rates & price.
- North America dominated the global market with a share of 38.28% in 2024. The increasing prevalence of multiple sclerosis, the introduction of new drugs, and high prices of drugs, such as Tysabri and Aubagio in the U.S., are some factors responsible for its dominance.
Table of Contents
Chapter 1. Methodology and Scope
- 1.1. Market Segmentation and Scope
- 1.2. Market Definitions
- 1.3. Research Methodology
- 1.3.1. Information Procurement
- 1.3.2. Information or Data Analysis
- 1.3.3. Market Formulation & Data Visualization
- 1.3.4. Data Validation & Publishing
- 1.4. Research Scope and Assumptions
- 1.4.1. List of Data Sources
Chapter 2. Executive Summary
- 2.1. Market Outlook
- 2.2. Segment Outlook
- 2.3. Competitive Insights
Chapter 3. Multiple Sclerosis Therapeutics Market Variables, Trends & Scope
- 3.1. Market Introduction/Lineage Outlook
- 3.2. Market Size and Growth Prospects (USD Million)
- 3.3. Market Dynamics
- 3.3.1. Market Drivers Analysis
- 3.3.2. Market Restraints Analysis
- 3.4. Multiple Sclerosis Therapeutic Market Analysis Tools
- 3.4.1. Porter's Analysis
- 3.4.1.1. Bargaining power of the suppliers
- 3.4.1.2. Bargaining power of the buyers
- 3.4.1.3. Threats of substitution
- 3.4.1.4. Threats from new entrants
- 3.4.1.5. Competitive rivalry
- 3.4.2. PESTEL Analysis
- 3.4.2.1. Political landscape
- 3.4.2.2. Economic and Social landscape
- 3.4.2.3. Technological landscape
- 3.4.2.4. Environmental landscape
- 3.4.2.5. Legal landscape
- 3.4.3. Pipeline Analysis, By Phase
- 3.4.1. Porter's Analysis
Chapter 4. Multiple Sclerosis Therapeutics Market: Drug Class Estimates & Trend Analysis
- 4.1. Segment Dashboard
- 4.2. Multiple Sclerosis Therapeutic Market: Drug Class Movement Analysis, 2024 & 2030 (USD Million)
- 4.3. Immunosuppressants
- 4.3.1. Immunosuppressants Market Revenue Estimates and Forecasts, 2018 - 2030 (USD Million)
- 4.4. Immunostimulants
- 4.4.1. Immunostimulants Market Revenue Estimates and Forecasts, 2018 - 2030 (USD Million)
Chapter 5. Multiple Sclerosis Therapeutics Market: Route of Administration Estimates & Trend Analysis
- 5.1. Segment Dashboard
- 5.2. Multiple Sclerosis Therapeutic Market: Route of Administration Movement Analysis, 2024 & 2030 (USD Million)
- 5.3. Oral
- 5.3.1. Oral Market Revenue Estimates and Forecasts, 2018 - 2030 (USD Million)
- 5.4. Injectable
- 5.4.1. Injectable Market Revenue Estimates and Forecasts, 2018 - 2030 (USD Million)
- 5.5. Others
- 5.5.1. Others Market Revenue Estimates and Forecasts, 2018 - 2030 (USD Million)
Chapter 6. Multiple Sclerosis Therapeutics Market: Distribution Channel Estimates & Trend Analysis
- 6.1. Segment Dashboard
- 6.2. Multiple Sclerosis Therapeutic Market: Distribution Channel Movement Analysis, 2024 & 2030 (USD Million)
- 6.3. Hospital Pharmacies
- 6.3.1. Hospital Pharmacies Market Revenue Estimates and Forecasts, 2018 - 2030 (USD Million)
- 6.4. Retail Pharmacies
- 6.4.1. Retail Pharmacies Market Revenue Estimates and Forecasts, 2018 - 2030 (USD Million)
- 6.5. E-Commerce
- 6.5.1. E-Commerce Market Revenue Estimates and Forecasts, 2018 - 2030 (USD Million)
Chapter 7. Multiple Sclerosis Therapeutic Market: Regional Estimates & Trend Analysis
- 7.1. Multiple Sclerosis Therapeutic Market Share, By Region, 2024 & 2030 (USD Million)
- 7.2. North America
- 7.2.1. North America Multiple Sclerosis Therapeutic Market Estimates and Forecasts, 2018 - 2030 (USD Million)
- 7.2.2. U.S.
- 7.2.2.1. U.S. Multiple Sclerosis Therapeutic Market Estimates and Forecasts, 2018 - 2030 (USD Million)
- 7.2.3. Canada
- 7.2.3.1. Canada Multiple Sclerosis Therapeutic Market Estimates and Forecasts, 2018 - 2030 (USD Million)
- 7.2.4. Mexico
- 7.2.4.1. Mexico Multiple Sclerosis Therapeutic Market Estimates and Forecasts, 2018 - 2030 (USD Million)
- 7.3. Europe
- 7.3.1. Europe Multiple Sclerosis Therapeutic Market Estimates and Forecasts, 2018 - 2030 (USD Million)
- 7.3.2. UK
- 7.3.2.1. UK Multiple Sclerosis Therapeutic Market Estimates and Forecasts, 2018 - 2030 (USD Million)
- 7.3.3. Germany
- 7.3.3.1. Germany Multiple Sclerosis Therapeutic Market Estimates and Forecasts, 2018 - 2030 (USD Million)
- 7.3.4. France
- 7.3.4.1. France Multiple Sclerosis Therapeutic Market Estimates and Forecasts, 2018 - 2030 (USD Million)
- 7.3.5. Italy
- 7.3.5.1. Italy Multiple Sclerosis Therapeutic Market Estimates and Forecasts, 2018 - 2030 (USD Million)
- 7.3.6. Spain
- 7.3.6.1. Spain Multiple Sclerosis Therapeutic Market Estimates and Forecasts, 2018 - 2030 (USD Million)
- 7.3.7. Denmark
- 7.3.7.1. Denmark Multiple Sclerosis Therapeutic Market Estimates and Forecasts, 2018 - 2030 (USD Million)
- 7.3.8. Sweden
- 7.3.8.1. Sweden Multiple Sclerosis Therapeutic Market Estimates and Forecasts, 2018 - 2030 (USD Million)
- 7.3.9. Norway
- 7.3.9.1. Norway Multiple Sclerosis Therapeutic Market Estimates and Forecasts, 2018 - 2030 (USD Million)
- 7.4. Asia Pacific
- 7.4.1. Asia Pacific Multiple Sclerosis Therapeutic Market Estimates and Forecasts, 2018 - 2030 (USD Million)
- 7.4.2. China
- 7.4.2.1. China Multiple Sclerosis Therapeutic Market Estimates and Forecasts, 2018 - 2030 (USD Million)
- 7.4.3. Japan
- 7.4.3.1. Japan Multiple Sclerosis Therapeutic Market Estimates and Forecasts, 2018 - 2030 (USD Million)
- 7.4.4. India
- 7.4.4.1. India Multiple Sclerosis Therapeutic Market Estimates and Forecasts, 2018 - 2030 (USD Million)
- 7.4.5. South Korea
- 7.4.5.1. South Korea Multiple Sclerosis Therapeutic Market Estimates and Forecasts, 2018 - 2030 (USD Million)
- 7.4.6. Australia
- 7.4.6.1. Australia Multiple Sclerosis Therapeutic Market Estimates and Forecasts, 2018 - 2030 (USD Million)
- 7.4.7. Thailand
- 7.4.7.1. Thailand Multiple Sclerosis Therapeutic Market Estimates and Forecasts, 2018 - 2030 (USD Million)
- 7.5. Latin America
- 7.5.1. Latin America Multiple Sclerosis Therapeutic Market Estimates and Forecasts, 2018 - 2030 (USD Million)
- 7.5.2. Brazil
- 7.5.2.1. Brazil Multiple Sclerosis Therapeutic Market Estimates and Forecasts, 2018 - 2030 (USD Million)
- 7.5.3. Argentina
- 7.5.3.1. Argentina Multiple Sclerosis Therapeutic Market Estimates and Forecasts, 2018 - 2030 (USD Million)
- 7.6. Middle East and Africa
- 7.6.1. Middle East and Africa Multiple Sclerosis Therapeutic Market Estimates and Forecasts, 2018 - 2030 (USD Million)
- 7.6.2. South Africa
- 7.6.2.1. South Africa Multiple Sclerosis Therapeutic Market Estimates and Forecasts, 2018 - 2030 (USD Million)
- 7.6.3. Saudi Arabia
- 7.6.3.1. Saudi Arabia Multiple Sclerosis Therapeutic Market Estimates and Forecasts, 2018 - 2030 (USD Million)
- 7.6.4. UAE
- 7.6.4.1. UAE Multiple Sclerosis Therapeutic Market Estimates and Forecasts, 2018 - 2030 (USD Million)
- 7.6.5. Kuwait
- 7.6.5.1. Kuwait Multiple Sclerosis Therapeutic Market Estimates and Forecasts, 2018 - 2030 (USD Million)
Chapter 8. Competitive Landscape
- 8.1. Recent Developments & Impact Analysis by Key Market Participants
- 8.2. Company Categorization
- 8.3. Company Heat Map Analysis
- 8.4. Company Profiles
- 8.4.1. Teva Pharmaceutical Industries Ltd.
- 8.4.1.1. Participant's Overview
- 8.4.1.2. Financial Performance
- 8.4.1.3. Product Benchmarking
- 8.4.1.4. Recent Developments/ Strategic Initiatives
- 8.4.2. Pfizer Inc.
- 8.4.2.1. Participant's Overview
- 8.4.2.2. Financial Performance
- 8.4.2.3. Product Benchmarking
- 8.4.2.4. Recent Developments/ Strategic Initiatives
- 8.4.3. Biogen
- 8.4.3.1. Participant's Overview
- 8.4.3.2. Financial Performance
- 8.4.3.3. Product Benchmarking
- 8.4.3.4. Recent Developments/ Strategic Initiatives
- 8.4.4. Bayer AG
- 8.4.4.1. Participant's Overview
- 8.4.4.2. Financial Performance
- 8.4.4.3. Product Benchmarking
- 8.4.4.4. Recent Developments/ Strategic Initiatives
- 8.4.5. Sanofi
- 8.4.5.1. Participant's Overview
- 8.4.5.2. Financial Performance
- 8.4.5.3. Product Benchmarking
- 8.4.5.4. Recent Developments/ Strategic Initiatives
- 8.4.6. F. Hoffman-La Roche Ltd
- 8.4.6.1. Participant's Overview
- 8.4.6.2. Financial Performance
- 8.4.6.3. Product Benchmarking
- 8.4.6.4. Recent Developments/ Strategic Initiatives
- 8.4.7. Johnson & Johnson Services, Inc.
- 8.4.7.1. Participant's Overview
- 8.4.7.2. Financial Performance
- 8.4.7.3. Product Benchmarking
- 8.4.7.4. Recent Developments/ Strategic Initiatives
- 8.4.8. Merck & Co., Inc.
- 8.4.8.1. Participant's Overview
- 8.4.8.2. Financial Performance
- 8.4.8.3. Product Benchmarking
- 8.4.8.4. Recent Developments/ Strategic Initiatives
- 8.4.9. Takeda Pharmaceuticals Company Limited.
- 8.4.9.1. Participant's Overview
- 8.4.9.2. Financial Performance
- 8.4.9.3. Product Benchmarking
- 8.4.9.4. Recent Developments/ Strategic Initiatives
- 8.4.10. Horizon Therapeutics plc
- 8.4.10.1. Participant's Overview
- 8.4.10.2. Financial Performance
- 8.4.10.3. Product Benchmarking
- 8.4.10.4. Recent Developments/ Strategic Initiatives
- 8.4.1. Teva Pharmaceutical Industries Ltd.
(주말 및 공휴일 제외)


