|
시장보고서
상품코드
1557650
헬스케어 분야 마이크로플루이딕스 시장(2024-2028년)Global Microfluidics Market for Healthcare Application 2024-2028 |
||||||
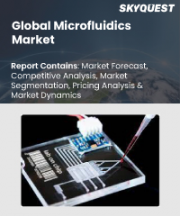
헬스케어 분야 마이크로플루이딕스 시장은 2023-2028년간 1,102억 달러 확대되고, 예측 기간 중 연평균 복합 성장률(CAGR)은 27.16%를 나타낼 전망입니다.헬스케어 분야 마이크로플루이딕스 시장에 대한 전체적인 분석, 시장 규모와 예측, 동향, 시장 성장 촉진요인·과제, 약 25개 벤더를 대상으로 한 벤더 분석 등의 정보를 게재했습니다.
현재의 시장 시나리오, 최신 동향과 촉진요인, 시장 환경 전체에 관한 최신 분석을 제공합니다. 마이크로플루이딕스 디바이스의 소형화, 생활습관병 증가, DNA 시퀀싱 진보에 의해 시장 성장이 촉진되고 있습니다.
| 시장 범위 | |
|---|---|
| 기준년 | 2024년 |
| 종료년 | 2028년 |
| 예측 기간 | 2024-2028년 |
| 성장 모멘텀 | 가속 |
| YOY 2024 | 20.89% |
| CAGR | 27.16% |
| 증분액 | 1,102억 달러 |
본 조사에서는 종이 기반 마이크로플루이딕스 디바이스 사용이 향후 몇 년간 헬스케어 분야 마이크로플루이딕스 시장 성장을 가속하는 주요 이유 중 하나라고 지적하고 있습니다. 또한 소프트 로봇 도입이나 약물전달 기술 마이크로플루이딕스 응용 증가는 시장의 큰 수요로 연결될 것입니다.
목차
제1장 주요 요약
- 시장 개요
제2장 시장 구도
- 시장 생태계
- 시장 특징
- 밸류체인 분석
제3장 시장 규모 평가
- 시장의 정의
- 시장 부문 분석
- 시장 규모(2023년)
- 시장 전망(2023-2028년)
제4장 시장 규모 실적
- 세계의 헬스케어 분야 마이크로플루이딕스 시장(2018-2022년)
- 용도별 부문 분석(2018-2022년)
- 소재별 부문 분석(2018-2022년)
- 지역별 부문 분석(2018-2022년)
- 국가별 부문 분석(2018-2022년)
제5장 Five Forces 분석
- Five Forces 요약
- 바이어의 교섭력
- 공급 기업의 교섭력
- 신규 진출업체의 위협
- 대체품의 위협
- 경쟁 위협
- 시장 현황
제6장 시장 세분화 : 용도별
- 시장 세분화
- 비교 : 용도별
- 체외진단 : 시장 규모와 예측(2023-2028년)
- 의약품 연구 : 시장 규모와 예측(2023-2028년)
- 약물전달 서비스 : 시장 규모와 예측(2023-2028년)
- 시장 기회 : 용도별
제7장 시장 세분화 : 소재별
- 시장 세분화
- 비교 : 소재별
- 폴리머 기반 : 시장 규모와 예측(2023-2028년)
- 유리 기반 : 시장 규모와 예측(2023-2028년)
- 실리콘 기반 : 시장 규모와 예측(2023-2028년)
- 시장 기회 : 소재별
제8장 고객 상황
- 고객 상황 개요
제9장 지역별 상황
- 지역별 세분화
- 지역별 비교
- 북미 : 시장 규모와 예측(2023-2028년)
- 유럽 : 시장 규모와 예측(2023-2028년)
- 아시아태평양 : 시장 규모와 예측(2023-2028년)
- 남미 : 시장 규모와 예측(2023-2028년)
- 중동 및 아프리카 : 시장 규모와 예측(2023-2028년)
- 미국 : 시장 규모와 예측(2023-2028년)
- 중국 : 시장 규모와 예측(2023-2028년)
- 독일 : 시장 규모와 예측(2023-2028년)
- 영국 : 시장 규모와 예측(2023-2028년)
- 일본 : 시장 규모와 예측(2023-2028년)
- 시장 기회 : 지역별
제10장 성장 촉진요인, 과제, 기회 및 성장 억제요인
- 시장 성장 촉진요인
- 시장이 해결해야 할 과제
- 성장 촉진요인과 과제의 영향
- 시장 기회와 시장 성장 억제요인
제11장 경쟁 구도
- 개요
- 경쟁 구도
- 혼란 상황
- 업계 리스크
제12장 경쟁 분석
- 기업 개요
- 기업의 시장 포지셔닝
- Agilent Technologies Inc.
- BioMerieux SA
- Bio Rad Laboratories Inc.
- Blacktrace Holdings Ltd.
- Cellix Ltd.
- Danaher Corp.
- Fluigent SA
- Illumina Inc.
- MICRUX FLUIDIC S.L.
- Perkin Elmer Inc.
- QIAGEN NV
- Teledyne Technologies Inc.
- Thermo Fisher Scientific Inc.
- uFluidix Inc.
제13장 부록
LSH 24.10.10Global Microfluidics For Healthcare Application Market 2024-2028
The microfluidics for healthcare application market is forecasted to grow by USD 110.2 bn during 2023-2028, accelerating at a CAGR of 27.16% during the forecast period. The report on the microfluidics for healthcare application market provides a holistic analysis, market size and forecast, trends, growth drivers, and challenges, as well as vendor analysis covering around 25 vendors.
The report offers an up-to-date analysis regarding the current market scenario, the latest trends and drivers, and the overall market environment. The market is driven by compact size of microfluidic devices, growth in lifestyle diseases, and advances in dna sequencing.
| Market Scope | |
|---|---|
| Base Year | 2024 |
| End Year | 2028 |
| Series Year | 2024-2028 |
| Growth Momentum | Accelerate |
| YOY 2024 | 20.89% |
| CAGR | 27.16% |
| Incremental Value | $110.2bn |
Technavio's microfluidics for healthcare application market is segmented as below:
By Application
- In-vitro diagnostics
- Pharmaceutical research
- Drug delivery services
By Material
- Polymer-based
- Glass-based
- Silicon-based
By Geography
- North America
- Europe
- APAC
- South America
- Middle East and Africa
This study identifies the use of paper-based microfluidic devices as one of the prime reasons driving the microfluidics for healthcare application market growth during the next few years. Also, introduction of soft robots and increasing applications of microfluidics in drug delivery technologies will lead to sizable demand in the market.
The report on the microfluidics for healthcare application market covers the following areas:
- Microfluidics for healthcare application market sizing
- Microfluidics for healthcare application market forecast
- Microfluidics for healthcare application market industry analysis
The robust vendor analysis is designed to help clients improve their market position, and in line with this, this report provides a detailed analysis of several leading microfluidics for healthcare application market vendors that include 908 Devices Inc., Agilent Technologies Inc., BioMerieux SA, Bio Rad Laboratories Inc., Blacktrace Holdings Ltd., Cellix Ltd., Danaher Corp., Elveflow, Fluigent SA, General Electric Co., Hamilton Co., Illumina Inc., Microfluidic Chipshop GmbH, MICRUX FLUIDIC S.L., Perkin Elmer Inc., QIAGEN NV, SMC Corp., Teledyne Technologies Inc., Thermo Fisher Scientific Inc., and uFluidix Inc.. Also, the microfluidics for healthcare application market analysis report includes information on upcoming trends and challenges that will influence market growth. This is to help companies strategize and leverage all forthcoming growth opportunities.
The study was conducted using an objective combination of primary and secondary information including inputs from key participants in the industry. The report contains a comprehensive market and vendor landscape in addition to an analysis of the key vendors.
The publisher presents a detailed picture of the market by the way of study, synthesis, and summation of data from multiple sources by an analysis of key parameters such as profit, pricing, competition, and promotions. It presents various market facets by identifying the key industry influencers. The data presented is comprehensive, reliable, and a result of extensive research - both primary and secondary. The market research reports provide a complete competitive landscape and an in-depth vendor selection methodology and analysis using qualitative and quantitative research to forecast the accurate market growth.
Table of Contents
1 Executive Summary
- 1.1 Market overview
- Executive Summary - Chart on Market Overview
- Executive Summary - Data Table on Market Overview
- Executive Summary - Chart on Global Market Characteristics
- Executive Summary - Chart on Market by Geography
- Executive Summary - Chart on Market Segmentation by Application
- Executive Summary - Chart on Market Segmentation by Material
- Executive Summary - Chart on Incremental Growth
- Executive Summary - Data Table on Incremental Growth
- Executive Summary - Chart on Company Market Positioning
2 Market Landscape
- 2.1 Market ecosystem
- Parent Market
- Data Table on - Parent Market
- 2.2 Market characteristics
- Market characteristics analysis
- 2.3 Value chain analysis
- Value Chain Analysis
3 Market Sizing
- 3.1 Market definition
- Offerings of companies included in the market definition
- 3.2 Market segment analysis
- Market segments
- 3.3 Market size 2023
- 3.4 Market outlook: Forecast for 2023-2028
- Chart on Global - Market size and forecast 2023-2028 ($ billion)
- Data Table on Global - Market size and forecast 2023-2028 ($ billion)
- Chart on Global Market: Year-over-year growth 2023-2028 (%)
- Data Table on Global Market: Year-over-year growth 2023-2028 (%)
4 Historic Market Size
- 4.1 Global Microfluidics Market For Healthcare Application 2018 - 2022
- Historic Market Size - Data Table on Global Microfluidics Market For Healthcare Application 2018 - 2022 ($ billion)
- 4.2 Application segment analysis 2018 - 2022
- Historic Market Size - Application Segment 2018 - 2022 ($ billion)
- 4.3 Material segment analysis 2018 - 2022
- Historic Market Size - Material Segment 2018 - 2022 ($ billion)
- 4.4 Geography segment analysis 2018 - 2022
- Historic Market Size - Geography Segment 2018 - 2022 ($ billion)
- 4.5 Country segment analysis 2018 - 2022
- Historic Market Size - Country Segment 2018 - 2022 ($ billion)
5 Five Forces Analysis
- 5.1 Five forces summary
- Five forces analysis - Comparison between 2023 and 2028
- 5.2 Bargaining power of buyers
- Bargaining power of buyers - Impact of key factors 2023 and 2028
- 5.3 Bargaining power of suppliers
- Bargaining power of suppliers - Impact of key factors in 2023 and 2028
- 5.4 Threat of new entrants
- Threat of new entrants - Impact of key factors in 2023 and 2028
- 5.5 Threat of substitutes
- Threat of substitutes - Impact of key factors in 2023 and 2028
- 5.6 Threat of rivalry
- Threat of rivalry - Impact of key factors in 2023 and 2028
- 5.7 Market condition
- Chart on Market condition - Five forces 2023 and 2028
6 Market Segmentation by Application
- 6.1 Market segments
- Chart on Application - Market share 2023-2028 (%)
- Data Table on Application - Market share 2023-2028 (%)
- 6.2 Comparison by Application
- Chart on Comparison by Application
- Data Table on Comparison by Application
- 6.3 In-vitro diagnostics - Market size and forecast 2023-2028
- Chart on In-vitro diagnostics - Market size and forecast 2023-2028 ($ billion)
- Data Table on In-vitro diagnostics - Market size and forecast 2023-2028 ($ billion)
- Chart on In-vitro diagnostics - Year-over-year growth 2023-2028 (%)
- Data Table on In-vitro diagnostics - Year-over-year growth 2023-2028 (%)
- 6.4 Pharmaceutical research - Market size and forecast 2023-2028
- Chart on Pharmaceutical research - Market size and forecast 2023-2028 ($ billion)
- Data Table on Pharmaceutical research - Market size and forecast 2023-2028 ($ billion)
- Chart on Pharmaceutical research - Year-over-year growth 2023-2028 (%)
- Data Table on Pharmaceutical research - Year-over-year growth 2023-2028 (%)
- 6.5 Drug delivery services - Market size and forecast 2023-2028
- Chart on Drug delivery services - Market size and forecast 2023-2028 ($ billion)
- Data Table on Drug delivery services - Market size and forecast 2023-2028 ($ billion)
- Chart on Drug delivery services - Year-over-year growth 2023-2028 (%)
- Data Table on Drug delivery services - Year-over-year growth 2023-2028 (%)
- 6.6 Market opportunity by Application
- Market opportunity by Application ($ billion)
- Data Table on Market opportunity by Application ($ billion)
7 Market Segmentation by Material
- 7.1 Market segments
- Chart on Material - Market share 2023-2028 (%)
- Data Table on Material - Market share 2023-2028 (%)
- 7.2 Comparison by Material
- Chart on Comparison by Material
- Data Table on Comparison by Material
- 7.3 Polymer-based - Market size and forecast 2023-2028
- Chart on Polymer-based - Market size and forecast 2023-2028 ($ billion)
- Data Table on Polymer-based - Market size and forecast 2023-2028 ($ billion)
- Chart on Polymer-based - Year-over-year growth 2023-2028 (%)
- Data Table on Polymer-based - Year-over-year growth 2023-2028 (%)
- 7.4 Glass-based - Market size and forecast 2023-2028
- Chart on Glass-based - Market size and forecast 2023-2028 ($ billion)
- Data Table on Glass-based - Market size and forecast 2023-2028 ($ billion)
- Chart on Glass-based - Year-over-year growth 2023-2028 (%)
- Data Table on Glass-based - Year-over-year growth 2023-2028 (%)
- 7.5 Silicon-based - Market size and forecast 2023-2028
- Chart on Silicon-based - Market size and forecast 2023-2028 ($ billion)
- Data Table on Silicon-based - Market size and forecast 2023-2028 ($ billion)
- Chart on Silicon-based - Year-over-year growth 2023-2028 (%)
- Data Table on Silicon-based - Year-over-year growth 2023-2028 (%)
- 7.6 Market opportunity by Material
- Market opportunity by Material ($ billion)
- Data Table on Market opportunity by Material ($ billion)
8 Customer Landscape
- 8.1 Customer landscape overview
- Analysis of price sensitivity, lifecycle, customer purchase basket, adoption rates, and purchase criteria
9 Geographic Landscape
- 9.1 Geographic segmentation
- Chart on Market share by geography 2023-2028 (%)
- Data Table on Market share by geography 2023-2028 (%)
- 9.2 Geographic comparison
- Chart on Geographic comparison
- Data Table on Geographic comparison
- 9.3 North America - Market size and forecast 2023-2028
- Chart on North America - Market size and forecast 2023-2028 ($ billion)
- Data Table on North America - Market size and forecast 2023-2028 ($ billion)
- Chart on North America - Year-over-year growth 2023-2028 (%)
- Data Table on North America - Year-over-year growth 2023-2028 (%)
- 9.4 Europe - Market size and forecast 2023-2028
- Chart on Europe - Market size and forecast 2023-2028 ($ billion)
- Data Table on Europe - Market size and forecast 2023-2028 ($ billion)
- Chart on Europe - Year-over-year growth 2023-2028 (%)
- Data Table on Europe - Year-over-year growth 2023-2028 (%)
- 9.5 APAC - Market size and forecast 2023-2028
- Chart on APAC - Market size and forecast 2023-2028 ($ billion)
- Data Table on APAC - Market size and forecast 2023-2028 ($ billion)
- Chart on APAC - Year-over-year growth 2023-2028 (%)
- Data Table on APAC - Year-over-year growth 2023-2028 (%)
- 9.6 South America - Market size and forecast 2023-2028
- Chart on South America - Market size and forecast 2023-2028 ($ billion)
- Data Table on South America - Market size and forecast 2023-2028 ($ billion)
- Chart on South America - Year-over-year growth 2023-2028 (%)
- Data Table on South America - Year-over-year growth 2023-2028 (%)
- 9.7 Middle East and Africa - Market size and forecast 2023-2028
- Chart on Middle East and Africa - Market size and forecast 2023-2028 ($ billion)
- Data Table on Middle East and Africa - Market size and forecast 2023-2028 ($ billion)
- Chart on Middle East and Africa - Year-over-year growth 2023-2028 (%)
- Data Table on Middle East and Africa - Year-over-year growth 2023-2028 (%)
- 9.8 US - Market size and forecast 2023-2028
- Chart on US - Market size and forecast 2023-2028 ($ billion)
- Data Table on US - Market size and forecast 2023-2028 ($ billion)
- Chart on US - Year-over-year growth 2023-2028 (%)
- Data Table on US - Year-over-year growth 2023-2028 (%)
- 9.9 China - Market size and forecast 2023-2028
- Chart on China - Market size and forecast 2023-2028 ($ billion)
- Data Table on China - Market size and forecast 2023-2028 ($ billion)
- Chart on China - Year-over-year growth 2023-2028 (%)
- Data Table on China - Year-over-year growth 2023-2028 (%)
- 9.10 Germany - Market size and forecast 2023-2028
- Chart on Germany - Market size and forecast 2023-2028 ($ billion)
- Data Table on Germany - Market size and forecast 2023-2028 ($ billion)
- Chart on Germany - Year-over-year growth 2023-2028 (%)
- Data Table on Germany - Year-over-year growth 2023-2028 (%)
- 9.11 UK - Market size and forecast 2023-2028
- Chart on UK - Market size and forecast 2023-2028 ($ billion)
- Data Table on UK - Market size and forecast 2023-2028 ($ billion)
- Chart on UK - Year-over-year growth 2023-2028 (%)
- Data Table on UK - Year-over-year growth 2023-2028 (%)
- 9.12 Japan - Market size and forecast 2023-2028
- Chart on Japan - Market size and forecast 2023-2028 ($ billion)
- Data Table on Japan - Market size and forecast 2023-2028 ($ billion)
- Chart on Japan - Year-over-year growth 2023-2028 (%)
- Data Table on Japan - Year-over-year growth 2023-2028 (%)
- 9.13 Market opportunity by geography
- Market opportunity by geography ($ billion)
- Data Tables on Market opportunity by geography ($ billion)
10 Drivers, Challenges, and Opportunity/Restraints
- 10.1 Market drivers
- 10.2 Market challenges
- 10.3 Impact of drivers and challenges
- Impact of drivers and challenges in 2023 and 2028
- 10.4 Market opportunities/restraints
11 Competitive Landscape
- 11.1 Overview
- 11.2 Competitive Landscape
- Overview on criticality of inputs and factors of differentiation
- 11.3 Landscape disruption
- Overview on factors of disruption
- 11.4 Industry risks
- Impact of key risks on business
12 Competitive Analysis
- 12.1 Companies profiled
- Companies covered
- 12.2 Market positioning of companies
- Matrix on companies position and classification
- 908 Devices Inc.
- 908 Devices Inc. - Overview
- 908 Devices Inc. - Product / Service
- 908 Devices Inc. - Key offerings
- 12.4 Agilent Technologies Inc.
- Agilent Technologies Inc. - Overview
- Agilent Technologies Inc. - Business segments
- Agilent Technologies Inc. - Key news
- Agilent Technologies Inc. - Key offerings
- Agilent Technologies Inc. - Segment focus
- 12.5 BioMerieux SA
- BioMerieux SA - Overview
- BioMerieux SA - Product / Service
- BioMerieux SA - Key news
- BioMerieux SA - Key offerings
- 12.6 Bio Rad Laboratories Inc.
- Bio Rad Laboratories Inc. - Overview
- Bio Rad Laboratories Inc. - Business segments
- Bio Rad Laboratories Inc. - Key news
- Bio Rad Laboratories Inc. - Key offerings
- Bio Rad Laboratories Inc. - Segment focus
- 12.7 Blacktrace Holdings Ltd.
- Blacktrace Holdings Ltd. - Overview
- Blacktrace Holdings Ltd. - Product / Service
- Blacktrace Holdings Ltd. - Key offerings
- 12.8 Cellix Ltd.
- Cellix Ltd. - Overview
- Cellix Ltd. - Product / Service
- Cellix Ltd. - Key offerings
- 12.9 Danaher Corp.
- Danaher Corp. - Overview
- Danaher Corp. - Business segments
- Danaher Corp. - Key news
- Danaher Corp. - Key offerings
- Danaher Corp. - Segment focus
- 12.10 Fluigent SA
- Fluigent SA - Overview
- Fluigent SA - Product / Service
- Fluigent SA - Key offerings
- 12.11 Illumina Inc.
- Illumina Inc. - Overview
- Illumina Inc. - Business segments
- Illumina Inc. - Key news
- Illumina Inc. - Key offerings
- Illumina Inc. - Segment focus
- 12.12 MICRUX FLUIDIC S.L.
- MICRUX FLUIDIC S.L. - Overview
- MICRUX FLUIDIC S.L. - Product / Service
- MICRUX FLUIDIC S.L. - Key offerings
- 12.13 Perkin Elmer Inc.
- Perkin Elmer Inc. - Overview
- Perkin Elmer Inc. - Business segments
- Perkin Elmer Inc. - Key news
- Perkin Elmer Inc. - Key offerings
- Perkin Elmer Inc. - Segment focus
- 12.14 QIAGEN NV
- QIAGEN NV - Overview
- QIAGEN NV - Product / Service
- QIAGEN NV - Key news
- QIAGEN NV - Key offerings
- 12.15 Teledyne Technologies Inc.
- Teledyne Technologies Inc. - Overview
- Teledyne Technologies Inc. - Business segments
- Teledyne Technologies Inc. - Key news
- Teledyne Technologies Inc. - Key offerings
- Teledyne Technologies Inc. - Segment focus
- 12.16 Thermo Fisher Scientific Inc.
- Thermo Fisher Scientific Inc. - Overview
- Thermo Fisher Scientific Inc. - Business segments
- Thermo Fisher Scientific Inc. - Key news
- Thermo Fisher Scientific Inc. - Key offerings
- Thermo Fisher Scientific Inc. - Segment focus
- 12.17 uFluidix Inc.
- uFluidix Inc. - Overview
- uFluidix Inc. - Product / Service
- uFluidix Inc. - Key offerings
13 Appendix
- 13.1 Scope of the report
- 13.2 Inclusions and exclusions checklist
- Inclusions checklist
- Exclusions checklist
- 13.3 Currency conversion rates for US$
- Currency conversion rates for US$
- 13.4 Research methodology
- Research methodology
- 13.5 Data procurement
- Information sources
- 13.6 Data validation
- Data validation
- 13.7 Validation techniques employed for market sizing
- Validation techniques employed for market sizing
- 13.8 Data synthesis
- Data synthesis
- 13.9 360 degree market analysis
- 360 degree market analysis
- 13.10 List of abbreviations
- List of abbreviations