|
시장보고서
상품코드
1915354
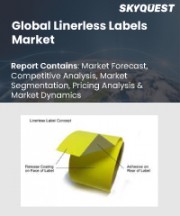
라이너리스 라벨 시장(2026-2030년)Global Linerless Labels Market 2026-2030 |
||||||
세계의 라이너리스 라벨 시장은 2025-2030년 11억 3,960만 달러 증가하고, 예측 기간 중 연평균 복합 성장률(CAGR)은 8.1%를 나타낼 것으로 예측됩니다. 본 보고서에서는 세계의 라이너리스 라벨 시장에 관한 종합적 분석, 시장 규모와 예측, 동향, 성장요인, 과제와 약 25개사 벤더 분석 등의 정보를 제공합니다.
본 보고서는 현재 시장 상황, 최신 동향 및 성장요인, 시장 환경 전반에 대한 최신 분석을 제공합니다. 이 시장은 환경 지속가능성과 폐기물 감소에 대한 기업의 관심 증가, 업무 생산성 및 자원 관리의 최적화, 자동화 용도 및 접착제 기술의 기술 발전으로 인해 성장하고 있습니다.
이번 조사는 업계 주요 관계자들의 정보를 포함한 1차 정보와 2차 정보를 객관적으로 조합하여 진행되었습니다. 이 보고서에는 주요 기업 분석과 함께 종합적인 시장 규모 데이터, 지역별 분석과 함께 부문 및 공급업체 현황이 포함되어 있습니다. 보고서에는 과거 데이터와 예측 데이터가 수록되어 있습니다.
| 시장 범위 | |
|---|---|
| 기준 연도 | 2026년 |
| 종료 연도 | 2030년 |
| 예측 기간 | 2026-2030년 |
| 성장 모멘텀 | 가속 |
| YOY 2026 | 8.1% |
| CAGR | 8.1% |
| 증가액 | 11억 3,960만 달러 |
이 보고서는 지속 가능한 재료 과학과 바이오 접착제의 발전이 향후 몇 년 동안 세계 라이너리스 라벨 시장의 성장을 주도할 주요 요인 중 하나로 꼽았습니다. 또한, 디지털 식별 기술과 스마트 기술을 라이너리스 형태로의 통합, 고속 자동화 및 지능형 용도 시스템의 진화는 시장에서 상당한 수요를 창출할 것으로 예측됩니다.
목차
제1장 주요 요약
제2장 Technavio 분석
- 가격, 수명주기, 고객 구입 바스켓, 채택 비율, 구입 기준 분석
- 인풋의 중요성과 차별화 요인
- 혼란 요인
- 성장 촉진요인과 과제의 영향
제3장 시장 구도
- 시장 생태계
- 시장 특징
- 밸류체인 분석
제4장 시장 규모
- 시장의 정의
- 시장 부문 분석
- 시장 규모(2025년)
- 시장 전망(2025-2030년)
제5장 시장 규모 실적
- 세계의 라이너리스 라벨 시장(2020-2024년)
- 유형별 분석(2020-2024년)
- 최종사용자별 분석(2020-2024년)
- 제품 유형별 분석(2020-2024년)
- 지역별 분석(2020-2024년)
- 국가별 분석(2020-2024년)
제6장 정성 분석
- AI의 영향 : 세계의 라이너리스 라벨 시장
제7장 Five Forces 분석
- Five Forces 요약
- 바이어의 교섭력
- 공급 기업의 교섭력
- 신규 진출업체의 위협
- 대체품의 위협
- 경쟁 위협
- 시장 현황
제8장 시장 세분화 : 유형별
- 비교 : 유형별
- 수성 잉크
- UV 경화형 잉크
- 용제계 잉크
- 핫멜트계 잉크
- 시장 기회 : 유형별
제9장 시장 세분화 : 최종사용자별
- 비교 : 최종사용자별
- 식품 및 음료
- 소매
- 퍼스널케어
- 의약품
- 기타
- 시장 기회 : 최종사용자별
제10장 시장 세분화 : 제품 유형별
- 비교 : 제품 유형별
- 가변 정보 인쇄
- 프라이머리 라벨
- 시장 기회 : 제품 유형별
제11장 고객 상황
제12장 지역별 상황
- 지역별 세분화
- 지역별 비교
- 아시아태평양
- 중국
- 인도
- 일본
- 한국
- 호주
- 인도네시아
- 유럽
- 독일
- 영국
- 프랑스
- 이탈리아
- 스페인
- 네덜란드
- 북미
- 미국
- 캐나다
- 멕시코
- 남미
- 브라질
- 아르헨티나
- 칠레
- 중동 및 아프리카
- 사우디아라비아
- 아랍에미리트(UAE)
- 남아프리카공화국
- 이스라엘
- 튀르키예
- 시장 기회 : 지역별
제13장 촉진요인·과제·기회
- 시장 성장 촉진요인
- 시장이 해결해야 할 과제
- 성장 촉진요인과 과제의 영향
- 시장 기회
제14장 경쟁 구도
- 개요
- 경쟁 구도
- 파괴적 혁신 상황
- 업계 리스크
제15장 경쟁 분석
- 기업 개요
- 기업 순위 지표
- 기업의 시장 포지셔닝
- 3M Co.
- Avery Dennison Corp.
- CCL Industries Inc.
- Constantia Flexibles GmbH
- Coveris Management GmbH
- FEDRIGONI Spa
- General Data Co. Inc.
- Gipako UAB
- Linerless
- NAStar Inc.
- Reflex Labels Ltd.
- RR Donnelley and Sons Co.
- SATO Holdings Corp.
- Skanem AS
- UPM Kymmene Corp.
제16장 부록
LSH 26.02.04The global linerless labels market is forecasted to grow by USD 1139.6 mn during 2025-2030, accelerating at a CAGR of 8.1% during the forecast period. The report on the global linerless labels market provides a holistic analysis, market size and forecast, trends, growth drivers, and challenges, as well as vendor analysis covering around 25 vendors.
The report offers an up-to-date analysis regarding the current market scenario, the latest trends and drivers, and the overall market environment. The market is driven by growing corporate emphasis on environmental sustainability and waste reduction, optimization of operational productivity and resource management, technological advancements in automated application and adhesive engineering.
The study was conducted using an objective combination of primary and secondary information including inputs from key participants in the industry. The report contains a comprehensive market size data, segment with regional analysis and vendor landscape in addition to an analysis of the key companies. Reports have historic and forecast data.
| Market Scope | |
|---|---|
| Base Year | 2026 |
| End Year | 2030 |
| Series Year | 2026-2030 |
| Growth Momentum | Accelerate |
| YOY 2026 | 8.1% |
| CAGR | 8.1% |
| Incremental Value | $1139.6 mn |
Technavio's global linerless labels market is segmented as below:
By Type
- Water-based inks
- UV-curable inks
- Solvent-based inks
- Hot melt-based inks
By End-User
- Food and beverages
- Retail
- Personal care
- Pharmaceuticals
- Others
By Product Type
- Variable information print
- Primary labels
Geography
- APAC
- China
- India
- Japan
- South Korea
- Australia
- Indonesia
- Europe
- Germany
- UK
- France
- Italy
- Spain
- The Netherlands
- North America
- US
- Canada
- Mexico
- South America
- Brazil
- Argentina
- Chile
- Middle East and Africa
- UAE
- South Africa
- Turkey
- Rest of World (ROW)
This study identifies the advancement of sustainable material science and bio-based adhesives as one of the prime reasons driving the global linerless labels market growth during the next few years. Also, integration of digital identification and smart technology in linerless formats and evolution of high-speed automation and intelligent application systems will lead to sizable demand in the market.
The report on the global linerless labels market covers the following areas:
- Global linerless labels market sizing
- Global linerless labels market forecast
- Global linerless labels market industry analysis
The robust vendor analysis is designed to help clients improve their market position, and in line with this, this report provides a detailed analysis of several leading global linerless labels market vendors that include 3M Co., Avery Dennison Corp., CCL Industries Inc., Constantia Flexibles GmbH, Conver Autoadhesivos SA, Coveris Management GmbH, FEDRIGONI Spa, General Data Co. Inc., Gipako UAB, Linerless, NAStar Inc., Optimum Group, Puramark, Reflex Labels Ltd., RR Donnelley and Sons Co., SATO Holdings Corp., Skanem AS, UPM Kymmene Corp.. Also, the global linerless labels market analysis report includes information on upcoming trends and challenges that will influence market growth. This is to help companies strategize and leverage all forthcoming growth opportunities.
The publisher presents a detailed picture of the market by the way of study, synthesis, and summation of data from multiple sources by an analysis of key parameters such as profit, pricing, competition, and promotions. It presents various market facets by identifying the key industry influencers. The data presented is comprehensive, reliable, and a result of extensive primary and secondary research. The market research reports provide a complete competitive landscape and an in-depth vendor selection methodology and analysis using qualitative and quantitative research to forecast accurate market growth.
Table of Contents
1 Executive Summary
- 1.1 Market overview
- Executive Summary - Chart on Market Overview
- Executive Summary - Data Table on Market Overview
- Executive Summary - Chart on Global Market Characteristics
- Executive Summary - Chart on Market by Geography
- Executive Summary - Chart on Market Segmentation by Type
- Executive Summary - Chart on Market Segmentation by End-user
- Executive Summary - Chart on Market Segmentation by Product Type
- Executive Summary - Chart on Incremental Growth
- Executive Summary - Data Table on Incremental Growth
- Executive Summary - Chart on Company Market Positioning
2 Technavio Analysis
- 2.1 Analysis of price sensitivity, lifecycle, customer purchase basket, adoption rates, and purchase criteria
- Analysis of price sensitivity, lifecycle, customer purchase basket, adoption rates, and purchase criteria
- 2.2 Criticality of inputs and Factors of differentiation
- 2.3 Factors of disruption
- 2.4 Impact of drivers and challenges
3 Market Landscape
- 3.1 Market ecosystem
- 3.2 Market characteristics
- 3.3 Value chain analysis
4 Market Sizing
- 4.1 Market definition
- 4.2 Market segment analysis
- Market segments
- 4.3 Market size 2025
- 4.4 Market outlook: Forecast for 2025-2030
5 Historic Market Size
- 5.1 Global Linerless Labels Market 2020 - 2024
- Historic Market Size - Data Table on Global Linerless Labels Market 2020 - 2024 ($ million)
- 5.2 Type segment analysis 2020 - 2024
- Historic Market Size - Type Segment 2020 - 2024 ($ million)
- 5.3 End-user segment analysis 2020 - 2024
- Historic Market Size - End-user Segment 2020 - 2024 ($ million)
- 5.4 Product Type segment analysis 2020 - 2024
- Historic Market Size - Product Type Segment 2020 - 2024 ($ million)
- 5.5 Geography segment analysis 2020 - 2024
- Historic Market Size - Geography Segment 2020 - 2024 ($ million)
- 5.6 Country segment analysis 2020 - 2024
- Historic Market Size - Country Segment 2020 - 2024 ($ million)
6 Qualitative Analysis
- 6.1 The AI impact on Global Linerless Labels Market
7 Five Forces Analysis
- 7.1 Five forces summary
- Five forces analysis - Comparison between 2025 and 2030
- 7.2 Bargaining power of buyers
- Bargaining power of buyers - Impact of key factors 2025 and 2030
- 7.3 Bargaining power of suppliers
- Bargaining power of suppliers - Impact of key factors in 2025 and 2030
- 7.4 Threat of new entrants
- Threat of new entrants - Impact of key factors in 2025 and 2030
- 7.5 Threat of substitutes
- Threat of substitutes - Impact of key factors in 2025 and 2030
- 7.6 Threat of rivalry
- Threat of rivalry - Impact of key factors in 2025 and 2030
- 7.7 Market condition
8 Market Segmentation by Type
- 8.1 Market segments
- 8.2 Comparison by Type
- 8.3 Water-based inks - Market size and forecast 2025-2030
- 8.4 UV-curable inks - Market size and forecast 2025-2030
- 8.5 Solvent-based inks - Market size and forecast 2025-2030
- 8.6 Hot melt-based inks - Market size and forecast 2025-2030
- 8.7 Market opportunity by Type
- Market opportunity by Type ($ million)
9 Market Segmentation by End-user
- 9.1 Market segments
- 9.2 Comparison by End-user
- 9.3 Food and beverages - Market size and forecast 2025-2030
- 9.4 Retail - Market size and forecast 2025-2030
- 9.5 Personal care - Market size and forecast 2025-2030
- 9.6 Pharmaceuticals - Market size and forecast 2025-2030
- 9.7 Others - Market size and forecast 2025-2030
- 9.8 Market opportunity by End-user
- Market opportunity by End-user ($ million)
10 Market Segmentation by Product Type
- 10.1 Market segments
- 10.2 Comparison by Product Type
- 10.3 Variable information print - Market size and forecast 2025-2030
- 10.4 Primary labels - Market size and forecast 2025-2030
- 10.5 Market opportunity by Product Type
- Market opportunity by Product Type ($ million)
11 Customer Landscape
- 11.1 Customer landscape overview
- Analysis of price sensitivity, lifecycle, customer purchase basket, adoption rates, and purchase criteria
12 Geographic Landscape
- 12.1 Geographic segmentation
- 12.2 Geographic comparison
- 12.3 APAC - Market size and forecast 2025-2030
- 12.3.1 China - Market size and forecast 2025-2030
- 12.3.2 India - Market size and forecast 2025-2030
- 12.3.3 Japan - Market size and forecast 2025-2030
- 12.3.4 South Korea - Market size and forecast 2025-2030
- 12.3.5 Australia - Market size and forecast 2025-2030
- 12.3.6 Indonesia - Market size and forecast 2025-2030
- 12.4 Europe - Market size and forecast 2025-2030
- 12.4.1 Germany - Market size and forecast 2025-2030
- 12.4.2 UK - Market size and forecast 2025-2030
- 12.4.3 France - Market size and forecast 2025-2030
- 12.4.4 Italy - Market size and forecast 2025-2030
- 12.4.5 Spain - Market size and forecast 2025-2030
- 12.4.6 The Netherlands - Market size and forecast 2025-2030
- 12.5 North America - Market size and forecast 2025-2030
- 12.5.1 US - Market size and forecast 2025-2030
- 12.5.2 Canada - Market size and forecast 2025-2030
- 12.5.3 Mexico - Market size and forecast 2025-2030
- 12.6 South America - Market size and forecast 2025-2030
- 12.6.1 Brazil - Market size and forecast 2025-2030
- 12.6.2 Argentina - Market size and forecast 2025-2030
- 12.6.3 Chile - Market size and forecast 2025-2030
- 12.7 Middle East and Africa - Market size and forecast 2025-2030
- 12.7.1 Saudi Arabia - Market size and forecast 2025-2030
- 12.7.2 UAE - Market size and forecast 2025-2030
- 12.7.3 South Africa - Market size and forecast 2025-2030
- 12.7.4 Israel - Market size and forecast 2025-2030
- 12.7.5 Turkey - Market size and forecast 2025-2030
- 12.8 Market opportunity by geography
- Market opportunity by geography ($ million)
- Data Tables on Market opportunity by geography ($ million)
13 Drivers, Challenges, and Opportunity
- 13.1 Market drivers
- Growing corporate emphasis on environmental sustainability and waste reduction
- Optimization of operational productivity and resource management
- Technological advancements in automated application and adhesive engineering
- 13.2 Market challenges
- Technical limitations regarding adhesive accumulation and hardware compatibility
- Significant capital expenditure requirements for system transition and equipment retrofitting
- Constraints in die-cutting versatility and aesthetic branding options
- 13.3 Impact of drivers and challenges
- Impact of drivers and challenges in 2025 and 2030
- 13.4 Market opportunities
- Advancement of sustainable material science and bio-based adhesives
- Integration of digital identification and smart technology in linerless formats
- Evolution of high-speed automation and intelligent application systems
14 Competitive Landscape
- 14.1 Overview
- 14.2 Competitive Landscape
- Overview on criticality of inputs and factors of differentiation
- 14.3 Landscape disruption
- Overview on factors of disruption
- 14.4 Industry risks
- Impact of key risks on business
15 Competitive Analysis
- 15.1 Companies profiled
- Companies covered
- 15.2 Company ranking index
- Company ranking index
- 15.3 Market positioning of companies
- Matrix on companies position and classification
- 15.4 3M Co.
- 3M Co. - Overview
- 3M Co. - Business segments
- 3M Co. - Key news
- 3M Co. - Key offerings
- 3M Co. - Segment focus
- SWOT
- 15.5 Avery Dennison Corp.
- Avery Dennison Corp. - Overview
- Avery Dennison Corp. - Business segments
- Avery Dennison Corp. - Key news
- Avery Dennison Corp. - Key offerings
- Avery Dennison Corp. - Segment focus
- SWOT
- 15.6 CCL Industries Inc.
- CCL Industries Inc. - Overview
- CCL Industries Inc. - Business segments
- CCL Industries Inc. - Key offerings
- CCL Industries Inc. - Segment focus
- SWOT
- 15.7 Constantia Flexibles GmbH
- Constantia Flexibles GmbH - Overview
- Constantia Flexibles GmbH - Product / Service
- Constantia Flexibles GmbH - Key offerings
- SWOT
- 15.8 Coveris Management GmbH
- Coveris Management GmbH - Overview
- Coveris Management GmbH - Product / Service
- Coveris Management GmbH - Key offerings
- SWOT
- 15.9 FEDRIGONI Spa
- FEDRIGONI Spa - Overview
- FEDRIGONI Spa - Product / Service
- FEDRIGONI Spa - Key offerings
- SWOT
- 15.10 General Data Co. Inc.
- General Data Co. Inc. - Overview
- General Data Co. Inc. - Product / Service
- General Data Co. Inc. - Key offerings
- SWOT
- 15.11 Gipako UAB
- Gipako UAB - Overview
- Gipako UAB - Product / Service
- Gipako UAB - Key offerings
- SWOT
- 15.12 Linerless
- Linerless - Overview
- Linerless - Product / Service
- Linerless - Key offerings
- SWOT
- 15.13 NAStar Inc.
- NAStar Inc. - Overview
- NAStar Inc. - Product / Service
- NAStar Inc. - Key offerings
- SWOT
- 15.14 Reflex Labels Ltd.
- Reflex Labels Ltd. - Overview
- Reflex Labels Ltd. - Product / Service
- Reflex Labels Ltd. - Key offerings
- SWOT
- 15.15 RR Donnelley and Sons Co.
- RR Donnelley and Sons Co. - Overview
- RR Donnelley and Sons Co. - Product / Service
- RR Donnelley and Sons Co. - Key offerings
- SWOT
- 15.16 SATO Holdings Corp.
- SATO Holdings Corp. - Overview
- SATO Holdings Corp. - Business segments
- SATO Holdings Corp. - Key offerings
- SATO Holdings Corp. - Segment focus
- SWOT
- 15.17 Skanem AS
- Skanem AS - Overview
- Skanem AS - Product / Service
- Skanem AS - Key offerings
- SWOT
- 15.18 UPM Kymmene Corp.
- UPM Kymmene Corp. - Overview
- UPM Kymmene Corp. - Business segments
- UPM Kymmene Corp. - Key offerings
- UPM Kymmene Corp. - Segment focus
- SWOT
16 Appendix
- 16.1 Scope of the report
- Market definition
- Objectives
- Notes and caveats
- 16.2 Inclusions and exclusions checklist
- Inclusions checklist
- Exclusions checklist
- 16.3 Currency conversion rates for US$
- Currency conversion rates for US$
- 16.4 Research methodology
- Research methodology
- 16.5 Data procurement
- Information sources
- 16.6 Data validation
- Data validation
- 16.7 Validation techniques employed for market sizing
- Validation techniques employed for market sizing
- 16.8 Data synthesis
- Data synthesis
- 16.9 360 degree market analysis
- 360 degree market analysis
- 16.10 List of abbreviations
- List of abbreviations