|
시장보고서
상품코드
1625790
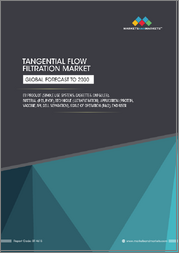
접선유동여과 시장(2024-2028년)Global Tangential Flow Filtration Market 2024-2028 |
||||||
접선유동여과 시장은 2023-2028년간 5억 8,720만 달러 확대되고, 예측 기간 동안 9.4%의 연평균 복합 성장률(CAGR)을 나타낼 전망입니다.
본 보고서는 탄젠셜 플로우 여과(Tangential Flow Filtration) 시장에 대한 전반적인 분석, 시장 규모와 예측, 동향, 성장 촉진요인, 과제, 약 25개 벤더를 대상으로 한 벤더 분석 등의 정보를 전해드립니다.
현재의 시장 시나리오, 최신 동향 및 성장요인, 전체 시장 환경에 대한 최신 분석을 제공합니다. 이 시장은 바이오 제약 분야에서의 채택 확대, 일반 흐름 여과에 비해 접선 흐름 여과의 우위, 정밀 여과와 같은 일회용 기술의 채택 확대가 시장을 주도하고 있습니다.
| 시장 범위 | |
|---|---|
| 기준 년도 | 2024 |
| 종료 년도 | 2028 |
| 예측 기간 | 2024-2028 |
| 성장 모멘텀 | 가속 |
| YOY 2024 | 8.5% |
| CAGR | 9.4% |
| 증분 금액 | 5억 8,720만 달러 |
이 보고서는 향후 몇 년간 탄젠셜 플로우 여과 시장의 성장을 견인할 주요 요인으로 벤더들의 전략적 이니셔티브를 꼽았습니다. 또한, GAMP(Good Automated Manufacturing Practice, 우수 자동화 제조 기준)의 채택 증가와 아시아태평양의 CMOS 증가가 시장 수요를 견인할 것으로 예상됩니다.
목차
제1장 주요 요약
- 시장 개요
제2장 Technavio 분석
- 가격·수명주기·고객 구입 바스켓·채택 비율·구입 기준 분석
- 인풋의 중요성과 차별화 요인
- 혼란 요인
- 성장 촉진요인과 과제의 영향
제3장 시장 구도
- 시장 생태계
- 시장 특징
- 밸류체인 분석
제4장 시장 규모
- 시장의 정의
- 시장 부문 분석
- 시장 규모(2023년)
- 시장 전망(2023-2028년)
제5장 시장 규모 실적
- 세계의 접선유동여과(TFF) 시장(2018-2022년)
- 제품별 분석(2018-2022년)
- 지역별 분석(2018-2022년)
- 국가별 분석(2018-2022년)
제6장 정성 분석
- 접선유동여과(TFF) 세계 시장에 대한 AI의 영향
제7장 Five Forces 분석
- Five Forces 요약
- 바이어의 교섭력
- 공급 기업의 교섭력
- 신규 진출업체의 위협
- 대체품의 위협
- 경쟁 위협
- 시장 현황
제8장 시장 세분화 : 제품별
- 시장 부문
- 비교 : 제품별
- 일회용 시스템 : 시장 규모와 예측(2023-2028년)
- 재이용 가능한 시스템 : 시장 규모와 예측(2023-2028년)
- 시장 기회 : 제품별
제9장 고객 상황
- 고객 상황 개요
제10장 지역별 상황
- 지역별 세분화
- 지역별 비교
- 북미 : 시장 규모와 예측(2023-2028년)
- 유럽 : 시장 규모와 예측(2023-2028년)
- 아시아 : 시장 규모와 예측(2023-2028년)
- 세계 기타 지역 : 시장 규모와 예측(2023-2028년)
- 미국 : 시장 규모와 예측(2023-2028년)
- 중국 : 시장 규모와 예측(2023-2028년)
- 영국 : 시장 규모와 예측(2023-2028년)
- 독일 : 시장 규모와 예측(2023-2028년)
- 일본 : 시장 규모와 예측(2023-2028년)
- 캐나다 : 시장 규모와 예측(2023-2028년)
- 인도 : 시장 규모와 예측(2023-2028년)
- 한국 : 시장 규모와 예측(2023-2028년)
- 프랑스 : 시장 규모와 예측(2023-2028년)
- 이탈리아 : 시장 규모와 예측(2023-2028년)
- 시장 기회 : 지역 상황별
제11장 성장 촉진요인, 과제, 기회, 억제요인
- 시장 성장 촉진요인
- 시장이 해결해야 할 과제
- 성장 촉진요인과 과제의 영향
- 시장 기회와 성장 억제요인
제12장 경쟁 구도
- 개요
- 경쟁 구도
- 혼란 상황
- 업계 리스크
제13장 경쟁 분석
- 기업 개요
- 기업 순위 지수
- 기업의 시장 포지셔닝
- Alfa Laval AB
- Andritz AG
- Cole Parmer
- Danaher Corp.
- General Electric Co.
- Merck KGaA
- Novasep Holding SAS
- Parker Hannifin Corp.
- Repligen Corp.
- Sartorius AG
제14장 부록
LSH 25.01.20Tangential Flow Filtration Market 2024-2028
The tangential flow filtration market is forecasted to grow by USD 587.2 mn during 2023-2028, accelerating at a CAGR of 9.4% during the forecast period. The report on the tangential flow filtration market provides a holistic analysis, market size and forecast, trends, growth drivers, and challenges, as well as vendor analysis covering around 25 vendors.
The report offers an up-to-date analysis regarding the current market scenario, the latest trends and drivers, and the overall market environment. The market is driven by growing adoption in biopharmaceutical sector, advantages of tangential flow filtration over normal flow filtration, and growing adoption of single-use technologies such as microfiltration.
| Market Scope | |
|---|---|
| Base Year | 2024 |
| End Year | 2028 |
| Series Year | 2024-2028 |
| Growth Momentum | Accelerate |
| YOY 2024 | 8.5% |
| CAGR | 9.4% |
| Incremental Value | $587.2 mn |
Technavio's tangential flow filtration market is segmented as below:
By Product
- Single-use systems
- Reusable systems
By Geographical Landscape
- North America
- Europe
- Asia
- Rest of World (ROW)
This study identifies the strategic initiatives by market vendors as one of the prime reasons driving the tangential flow filtration market growth during the next few years. Also, increased adoption of good automated manufacturing practices (GAMP) and growing number of cmos in apac will lead to sizable demand in the market.
The report on the tangential flow filtration market covers the following areas:
- Tangential Flow Filtration Market sizing
- Tangential Flow Filtration Market forecast
- Tangential Flow Filtration Market industry analysis
The robust vendor analysis is designed to help clients improve their market position, and in line with this, this report provides a detailed analysis of several leading tangential flow filtration market vendors that include Alfa Laval AB, Andritz AG, Cole Parmer, Danaher Corp., Donaldson Co. Inc., Evoqua Water Technologies LLC, GEA Group AG, General Electric Co., Koch Industries Inc., Merck KGaA, Novasep Holding SAS, OSMO Membrane Systems GmbH, Parker Hannifin Corp., PendoTECH, Repligen Corp., Sartorius AG, Synder Filtration Inc., TAMI Industries SAS, Thermo Fisher Scientific Inc., and Veolia Environnement SA. Also, the tangential flow filtration market analysis report includes information on upcoming trends and challenges that will influence market growth. This is to help companies strategize and leverage all forthcoming growth opportunities.
The study was conducted using an objective combination of primary and secondary information including inputs from key participants in the industry. The report contains a comprehensive market and vendor landscape in addition to an analysis of the key vendors.
The publisher presents a detailed picture of the market by the way of study, synthesis, and summation of data from multiple sources by an analysis of key parameters such as profit, pricing, competition, and promotions. It presents various market facets by identifying the key industry influencers. The data presented is comprehensive, reliable, and a result of extensive primary and secondary research. The market research reports provide a complete competitive landscape and an in-depth vendor selection methodology and analysis using qualitative and quantitative research to forecast accurate market growth.
Table of Contents
1 Executive Summary
- 1.1 Market overview
- Executive Summary - Chart on Market Overview
- Executive Summary - Data Table on Market Overview
- Executive Summary - Chart on Global Market Characteristics
- Executive Summary - Chart on Market By Geographical Landscape
- Executive Summary - Chart on Market Segmentation by Product
- Executive Summary - Chart on Incremental Growth
- Executive Summary - Data Table on Incremental Growth
- Executive Summary - Chart on Company Market Positioning
2 Technavio Analysis
- 2.1 Analysis of price sensitivity, lifecycle, customer purchase basket, adoption rates, and purchase criteria
- Analysis of price sensitivity, lifecycle, customer purchase basket, adoption rates, and purchase criteria
- 2.2 Criticality of inputs and Factors of differentiation
- Overview on criticality of inputs and factors of differentiation
- 2.3 Factors of disruption
- Overview on factors of disruption
- 2.4 Impact of drivers and challenges
- Impact of drivers and challenges in 2023 and 2028
3 Market Landscape
- 3.1 Market ecosystem
- Parent Market
- Data Table on - Parent Market
- 3.2 Market characteristics
- Market characteristics analysis
- 3.3 Value chain analysis
- Value Chain Analysis
4 Market Sizing
- 4.1 Market definition
- Offerings of companies included in the market definition
- 4.2 Market segment analysis
- Market segments
- 4.3 Market size 2023
- 4.4 Market outlook: Forecast for 2023-2028
- Chart on Global - Market size and forecast 2023-2028 ($ million)
- Data Table on Global - Market size and forecast 2023-2028 ($ million)
- Chart on Global Market: Year-over-year growth 2023-2028 (%)
- Data Table on Global Market: Year-over-year growth 2023-2028 (%)
5 Historic Market Size
- 5.1 Global Tangential Flow Filtration Market 2018 - 2022
- Historic Market Size - Data Table on Global Tangential Flow Filtration Market 2018 - 2022 ($ million)
- 5.2 Product segment analysis 2018 - 2022
- Historic Market Size - Product Segment 2018 - 2022 ($ million)
- 5.3 Geography segment analysis 2018 - 2022
- Historic Market Size - Geography Segment 2018 - 2022 ($ million)
- 5.4 Country segment analysis 2018 - 2022
- Historic Market Size - Country Segment 2018 - 2022 ($ million)
6 Qualitative Analysis
- 6.1 Impact of AI on the Global Tangential Flow Filtration Market
7 Five Forces Analysis
- 7.1 Five forces summary
- Five forces analysis - Comparison between 2023 and 2028
- 7.2 Bargaining power of buyers
- Bargaining power of buyers - Impact of key factors 2023 and 2028
- 7.3 Bargaining power of suppliers
- Bargaining power of suppliers - Impact of key factors in 2023 and 2028
- 7.4 Threat of new entrants
- Threat of new entrants - Impact of key factors in 2023 and 2028
- 7.5 Threat of substitutes
- Threat of substitutes - Impact of key factors in 2023 and 2028
- 7.6 Threat of rivalry
- Threat of rivalry - Impact of key factors in 2023 and 2028
- 7.7 Market condition
- Chart on Market condition - Five forces 2023 and 2028
8 Market Segmentation by Product
- 8.1 Market segments
- Chart on Product - Market share 2023-2028 (%)
- Data Table on Product - Market share 2023-2028 (%)
- 8.2 Comparison by Product
- Chart on Comparison by Product
- Data Table on Comparison by Product
- 8.3 Single-use systems - Market size and forecast 2023-2028
- Chart on Single-use systems - Market size and forecast 2023-2028 ($ million)
- Data Table on Single-use systems - Market size and forecast 2023-2028 ($ million)
- Chart on Single-use systems - Year-over-year growth 2023-2028 (%)
- Data Table on Single-use systems - Year-over-year growth 2023-2028 (%)
- 8.4 Reusable systems - Market size and forecast 2023-2028
- Chart on Reusable systems - Market size and forecast 2023-2028 ($ million)
- Data Table on Reusable systems - Market size and forecast 2023-2028 ($ million)
- Chart on Reusable systems - Year-over-year growth 2023-2028 (%)
- Data Table on Reusable systems - Year-over-year growth 2023-2028 (%)
- 8.5 Market opportunity by Product
- Market opportunity by Product ($ million)
- Data Table on Market opportunity by Product ($ million)
9 Customer Landscape
- 9.1 Customer landscape overview
- Analysis of price sensitivity, lifecycle, customer purchase basket, adoption rates, and purchase criteria
10 Geographic Landscape
- 10.1 Geographic segmentation
- Chart on Market share By Geographical Landscape 2023-2028 (%)
- Data Table on Market share By Geographical Landscape 2023-2028 (%)
- 10.2 Geographic comparison
- Chart on Geographic comparison
- Data Table on Geographic comparison
- 10.3 North America - Market size and forecast 2023-2028
- Chart on North America - Market size and forecast 2023-2028 ($ million)
- Data Table on North America - Market size and forecast 2023-2028 ($ million)
- Chart on North America - Year-over-year growth 2023-2028 (%)
- Data Table on North America - Year-over-year growth 2023-2028 (%)
- 10.4 Europe - Market size and forecast 2023-2028
- Chart on Europe - Market size and forecast 2023-2028 ($ million)
- Data Table on Europe - Market size and forecast 2023-2028 ($ million)
- Chart on Europe - Year-over-year growth 2023-2028 (%)
- Data Table on Europe - Year-over-year growth 2023-2028 (%)
- 10.5 Asia - Market size and forecast 2023-2028
- Chart on Asia - Market size and forecast 2023-2028 ($ million)
- Data Table on Asia - Market size and forecast 2023-2028 ($ million)
- Chart on Asia - Year-over-year growth 2023-2028 (%)
- Data Table on Asia - Year-over-year growth 2023-2028 (%)
- 10.6 Rest of World (ROW) - Market size and forecast 2023-2028
- Chart on Rest of World (ROW) - Market size and forecast 2023-2028 ($ million)
- Data Table on Rest of World (ROW) - Market size and forecast 2023-2028 ($ million)
- Chart on Rest of World (ROW) - Year-over-year growth 2023-2028 (%)
- Data Table on Rest of World (ROW) - Year-over-year growth 2023-2028 (%)
- 10.7 US - Market size and forecast 2023-2028
- Chart on US - Market size and forecast 2023-2028 ($ million)
- Data Table on US - Market size and forecast 2023-2028 ($ million)
- Chart on US - Year-over-year growth 2023-2028 (%)
- Data Table on US - Year-over-year growth 2023-2028 (%)
- 10.8 China - Market size and forecast 2023-2028
- Chart on China - Market size and forecast 2023-2028 ($ million)
- Data Table on China - Market size and forecast 2023-2028 ($ million)
- Chart on China - Year-over-year growth 2023-2028 (%)
- Data Table on China - Year-over-year growth 2023-2028 (%)
- 10.9 UK - Market size and forecast 2023-2028
- Chart on UK - Market size and forecast 2023-2028 ($ million)
- Data Table on UK - Market size and forecast 2023-2028 ($ million)
- Chart on UK - Year-over-year growth 2023-2028 (%)
- Data Table on UK - Year-over-year growth 2023-2028 (%)
- 10.10 Germany - Market size and forecast 2023-2028
- Chart on Germany - Market size and forecast 2023-2028 ($ million)
- Data Table on Germany - Market size and forecast 2023-2028 ($ million)
- Chart on Germany - Year-over-year growth 2023-2028 (%)
- Data Table on Germany - Year-over-year growth 2023-2028 (%)
- 10.11 Japan - Market size and forecast 2023-2028
- Chart on Japan - Market size and forecast 2023-2028 ($ million)
- Data Table on Japan - Market size and forecast 2023-2028 ($ million)
- Chart on Japan - Year-over-year growth 2023-2028 (%)
- Data Table on Japan - Year-over-year growth 2023-2028 (%)
- 10.12 Canada - Market size and forecast 2023-2028
- Chart on Canada - Market size and forecast 2023-2028 ($ million)
- Data Table on Canada - Market size and forecast 2023-2028 ($ million)
- Chart on Canada - Year-over-year growth 2023-2028 (%)
- Data Table on Canada - Year-over-year growth 2023-2028 (%)
- 10.13 India - Market size and forecast 2023-2028
- Chart on India - Market size and forecast 2023-2028 ($ million)
- Data Table on India - Market size and forecast 2023-2028 ($ million)
- Chart on India - Year-over-year growth 2023-2028 (%)
- Data Table on India - Year-over-year growth 2023-2028 (%)
- 10.14 South Korea - Market size and forecast 2023-2028
- Chart on South Korea - Market size and forecast 2023-2028 ($ million)
- Data Table on South Korea - Market size and forecast 2023-2028 ($ million)
- Chart on South Korea - Year-over-year growth 2023-2028 (%)
- Data Table on South Korea - Year-over-year growth 2023-2028 (%)
- 10.15 France - Market size and forecast 2023-2028
- Chart on France - Market size and forecast 2023-2028 ($ million)
- Data Table on France - Market size and forecast 2023-2028 ($ million)
- Chart on France - Year-over-year growth 2023-2028 (%)
- Data Table on France - Year-over-year growth 2023-2028 (%)
- 10.16 Italy - Market size and forecast 2023-2028
- Chart on Italy - Market size and forecast 2023-2028 ($ million)
- Data Table on Italy - Market size and forecast 2023-2028 ($ million)
- Chart on Italy - Year-over-year growth 2023-2028 (%)
- Data Table on Italy - Year-over-year growth 2023-2028 (%)
- 10.17 Market opportunity By Geographical Landscape
- Market opportunity By Geographical Landscape ($ million)
- Data Tables on Market opportunity By Geographical Landscape ($ million)
11 Drivers, Challenges, and Opportunity/Restraints
- 11.1 Market drivers
- 11.2 Market challenges
- 11.3 Impact of drivers and challenges
- Impact of drivers and challenges in 2023 and 2028
- 11.4 Market opportunities/restraints
12 Competitive Landscape
- 12.1 Overview
- 12.2 Competitive Landscape
- Overview on criticality of inputs and factors of differentiation
- 12.3 Landscape disruption
- Overview on factors of disruption
- 12.4 Industry risks
- Impact of key risks on business
13 Competitive Analysis
- 13.1 Companies profiled
- Companies covered
- 13.2 Company ranking index
- Company ranking index
- 13.3 Market positioning of companies
- Matrix on companies position and classification
- 13.4 Alfa Laval AB
- Alfa Laval AB - Overview
- Alfa Laval AB - Business segments
- Alfa Laval AB - Key news
- Alfa Laval AB - Key offerings
- Alfa Laval AB - Segment focus
- SWOT
- 13.5 Andritz AG
- Andritz AG - Overview
- Andritz AG - Business segments
- Andritz AG - Key news
- Andritz AG - Key offerings
- Andritz AG - Segment focus
- SWOT
- 13.6 Cole Parmer
- Cole Parmer - Overview
- Cole Parmer - Product / Service
- Cole Parmer - Key offerings
- SWOT
- 13.7 Danaher Corp.
- Danaher Corp. - Overview
- Danaher Corp. - Business segments
- Danaher Corp. - Key news
- Danaher Corp. - Key offerings
- Danaher Corp. - Segment focus
- SWOT
- 13.8 General Electric Co.
- General Electric Co. - Overview
- General Electric Co. - Business segments
- General Electric Co. - Key news
- General Electric Co. - Key offerings
- General Electric Co. - Segment focus
- SWOT
- 13.9 Merck KGaA
- Merck KGaA - Overview
- Merck KGaA - Business segments
- Merck KGaA - Key news
- Merck KGaA - Key offerings
- Merck KGaA - Segment focus
- SWOT
- 13.10 Novasep Holding SAS
- Novasep Holding SAS - Overview
- Novasep Holding SAS - Product / Service
- Novasep Holding SAS - Key news
- Novasep Holding SAS - Key offerings
- SWOT
- 13.11 Parker Hannifin Corp.
- Parker Hannifin Corp. - Overview
- Parker Hannifin Corp. - Business segments
- Parker Hannifin Corp. - Key news
- Parker Hannifin Corp. - Key offerings
- Parker Hannifin Corp. - Segment focus
- SWOT
- 13.12 Repligen Corp.
- Repligen Corp. - Overview
- Repligen Corp. - Product / Service
- Repligen Corp. - Key offerings
- SWOT
- 13.13 Sartorius AG
- Sartorius AG - Overview
- Sartorius AG - Business segments
- Sartorius AG - Key news
- Sartorius AG - Key offerings
- Sartorius AG - Segment focus
- SWOT
14 Appendix
- 14.1 Scope of the report
- 14.2 Inclusions and exclusions checklist
- Inclusions checklist
- Exclusions checklist
- 14.3 Currency conversion rates for US$
- Currency conversion rates for US$
- 14.4 Research methodology
- Research methodology
- 14.5 Data procurement
- Information sources
- 14.6 Data validation
- Data validation
- 14.7 Validation techniques employed for market sizing
- Validation techniques employed for market sizing
- 14.8 Data synthesis
- Data synthesis
- 14.9 360 degree market analysis
- 360 degree market analysis
- 14.10 List of abbreviations
- List of abbreviations