
|
시장보고서
상품코드
1733999
셀룰러 IoT 시장(2025-2030년)Cellular IoT Market: 2025-2030 |
||||||
'셀룰러 IoT : GSMA의 최신 eSIM 규격이 2030년까지 세계에서 65억 건의 연결에 필수적'
| 주요 통계 | |
|---|---|
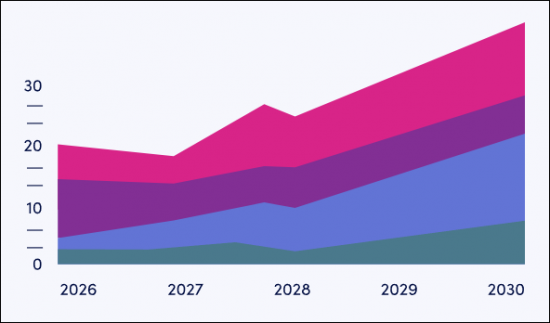
| 셀룰러 IoT의 총 연결 수(2025년) : | 41억 |
| 셀룰러 IoT의 총 연결 수(2030년) : | 65억 |
| 셀룰러 IoT 연결을 통한 총 수익(2030년) : | 310억 달러 |
| 예측 기간 : | 2025-2030년 |
본 조사 스위트는 통신 사업자, 가상 이동 통신 사업자(MVNO), 연결 서비스 제공업체에게 진화하는 셀룰러 IoT 시장에 대한 광범위한 분석과 실용적인 인사이트를 제공합니다. 본 스위트에는 이해관계자가 셀룰러 IoT 시장에서의 비즈니스 전략에 대해 충분한 정보를 바탕으로 의사결정을 하기 위한 데이터가 포함되어 있습니다. 조사는 셀룰러 IoT 시장에서 주요한 파괴적 서비스--예를 들면, 통신 API, 위성 및 비지상계 네트워크(NTN), 양자 시큐리티, eSIM 및 iSIM, 프라이빗 네트워크 등--의 동향을 커버하고 있으며, 한층 더 자연어 인터페이스, AI 추론, AI 데이터 분석이라고 하는 셀룰러 IoT에서 AI 서비스에도 초점을 맞추고 있습니다.
주요 특징
- 시장 역학 : NTN 커넥티비티의 전개, 새로운 AI 서비스, eSIM 등 셀룰러 IoT 시장의 주요 동향과 사업 기회에 관한 인사이트를 제공하며, 통신 API와 같은 대처나 셀룰러 IoT 내에서의 보다 고급 보안의 추진이 이해관계자에 의해 어떻게 활용될 수 있는지에 대한 전략적 분석도 포함되어 있습니다.
- 주요 요점 및 전략적 제안 : 셀룰러 IoT 시장의 주요 발전 기회와 지식을 상세하게 분석하고, 연결당 평균 수익 증가와 비즈니스 모델의 다양화를 목표로 하는 통신 사업자 및 기타 이해관계자에 대한 전략적 제안을 제공합니다.
- 벤치마크 업계 예측 : 셀룰러 IoT 연결 수, 셀룰러 IoT로부터의 연결 수익, 셀룰러 IoT 연결에 의해 생성되는 데이터, 셀룰러 IoT 모듈 출하 수, 셀룰러 IoT 모듈에 대한 지출액, 셀룰러 IoT의 총 시장 규모 데이터를 제공합니다.
- Juniper Research의 경쟁 리더보드 : 셀룰러 IoT 시장의 주요 벤더 15 개사의 능력과 능력을 평가하고, 시장 사이징과 각 벤더의 제공 서비스의 상세 분석을 실시했습니다.
SAMPLE VIEW
시장 데이터 및 예측 보고서
샘플
시장 동향 및 전략 보고서
시장 데이터 및 예측 보고서
이 설문조사에는 106,000개 이상의 데이터 포인트와 170개 이상의 테이블로 구성된 예측 데이터 세트에 대한 액세스가 포함됩니다.
이 설문조사에는 다음 측정 항목이 포함됩니다.
- 셀룰러 IoT 접속수
- 셀룰러 IoT 연결을 통한 수익
- 셀룰러 IoT에 의한 생성 데이터
- 셀룰러 IoT 모듈 출하 수
- 셀룰러 IoT 모듈에 대한 지출액
- 셀룰러 IoT의 총 시장 규모
Juniper Research의 대화형 예측(Excel)에는 다음과 같은 기능이 있습니다.
- 통계 분석 : 데이터 기간 동안 모든 지역과 국가에 대해 표시되는 특정 측정 항목을 검색할 수 있는 장점입니다.
- 국가별 데이터 도구 : 이 도구를 사용하면 예측 기간 동안 모든 지역과 국가 지표를 볼 수 있습니다.
- 국가별 비교 도구 : 특정 국가를 선택하고 비교할 수 있습니다. 이 도구에는 그래프를 내보내는 기능이 포함되어 있습니다.
- What-if 분석 : 세 가지 대화형 시나리오를 통해 사용자는 예측의 전제조건과 비교할 수 있습니다.
목차
시장 동향 및 전략
제1장 중요 포인트 및 전략적 제안
- 중요 포인트
- 주요 전략적 제안
제2장 시장 상황
- 셀룰러 IoT의 파괴적 서비스
- 통신 API
- NTN 및 위성 IoT
- 사설망
- 셀룰러 IoT용 AI 서비스
- CMP를 위한 자연 언어 인터페이스
- AI 데이터 분석
- AI추론
- AI 기반 멀티 RAT 선택
- eSIM과 iSIM
- SGP.32
- SGP.41/42
- 셀룰러 IoT용 양자 보안
제3장 셀룰러 IoT 비즈니스 모델 및 수익화의 미래 전략
- 셀룰러 IoT 비즈니스 모델과 수익화
- 수익이 아닌 연결, 기술이 아닌 연결성
- LPWA 서비스, 비즈니스 모델, 수익화
- 5G 비즈니스 모델 및 수익화
- Connectivity-as-a-Service
제4장 국가별 준비지수
- 국가별 준비 지수 : 서문
- 초점 시장
- 5G 인프라
- eSIM과 iSIM 도입
- 중국
- 미국
- 성장 시장
- 브라질
- 인도
- 포화 시장
- 신흥국 시장
경쟁 리더보드
제1장 경쟁 리더보드
제2장 벤더 프로파일
- AT&T
- China Mobile
- Cisco
- Deutsche Telekom
- emnify
- Eseye
- Huawei
- KORE Wireless
- Orange Business
- Tata Communications
- Telefonica Tech
- Telit Cinterion
- Verizon Business
- Vodafone Business
- Wireless Logic
- 평가 기법
- 제한과 해석
- 관련 조사
데이터 및 예측
제1장 서론 및 조사 방법
제2장 시장 요약 및 향후 시장 전망
- 셀룰러 IoT 접속수
- 셀룰러 IoT 연결을 통한 수익
- 셀룰러 IoT에 의한 생성 데이터
- 셀룰러 IoT 모듈 출하 수
- 셀룰러 IoT 모듈에 대한 지출액
제3장 4G IoT
- 4G IoT 접속수
- 4G IoT 연결로 수익
- 4G IoT에 의한 생성 데이터
- 4G IoT 모듈 출하수
- 4G IoT 모듈에 대한 지출액
제4장 5G IoT
- 5G IoT 접속수
- 5G IoT 연결로 수익
- 5G IoT에 의한 생성 데이터
- 5G IoT 모듈 출하 수
- 5G IoT 모듈에 대한 지출액
제5장 LPWA
- LPWA 접속수
- LPWA 연결로 인한 수익
- LPWA에 의한 생성 데이터
- LPWA 모듈 출하 수
- LPWA 모듈에 대한 지출액
'Cellular IoT: Latest GSMA eSIM Standard Critical to 6.5 billion Connections Globally by 2030'
| KEY STATISTICS | |
|---|---|
| Total number of cellular IoT connections in 2025: | 4.1bn |
| Total number of cellular IoT connections in 2030: | 6.5bn |
| Total cellular IoT connectivity revenue in 2030: | $31bn |
| Forecast period: | 2025-2030 |
Overview
Our "Cellular IoT" research suite provides operators, mobile virtual network operators (MVNOs), and connectivity service providers with extensive analysis and actionable insights into the evolving cellular IoT market. It contains data that enables stakeholders in the market to make informed decisions on their business strategies in the cellular IoT market; covering the development of key disruptive services in the cellular IoT market such as telecommunications Application Programming Interfaces (APIs), satellite or non-terrestrial networks (NTNs), quantum security, eSIMs and iSIMs, and private networks, as well as AI services in cellular IoT such as natural language interfaces, AI inferencing, and AI data analytics.
By reading this report, the audience will benefit from analysis and recommendations on business strategies for the monetisation of cellular IoT; looking at key network technologies such as 5G and Low-Power Wide-Area (LPWA), in addition to how operators and connectivity service providers can begin to expand their business models and offerings to position themselves as technology providers in the market. It also explores the development of business models such as connectivity-as-a-service, and how operators and connectivity service providers can benefit most from these models.
The report includes a Country Readiness Index, providing insight and analysis into which cellular IoT markets will experience the greatest growth over the next five years; allowing stakeholders to effectively understand the current and future status of more than 60 different cellular IoT markets.
The market forecast includes several different options that can be purchased separately, including access to data mapping and a forecast document, a strategy and trends document detailing critical trends in the market, and strategic recommendations for monetising and innovating services in the cellular IoT market.,
The research suite includes a Competitor Leaderboard, which can be purchased separately; containing analysis and market sizing for 15 leading cellular IoT vendors, who each provide platforms for managing cellular IoT connectivity.
Collectively, the suite provides a critical tool for understanding the cellular IoT market. Allowing operators, MVNOs, connectivity service providers, and other stakeholders in the market to optimise their future business strategies and product or service development; providing them with a competitive advantage over their rivals.
All report content is delivered in the English language.
Key Features
- Market Dynamics: Insight into key trends and opportunities in the cellular IoT market, such as the development of NTN connectivity, new AI services, and eSIMs. It also includes strategic analysis of how initiatives such as telecommunications APIs and the push for greater security within cellular IoT can be capitalised on by stakeholders in the market.
- Key Takeaways & Strategic Recommendations: In-depth analysis of key development opportunities and findings within the cellular IoT market, accompanied by strategic recommendations for operators, and other stakeholders in the market, seeking to increase their average revenue per connection or diversify their business models.
- Benchmark Industry Forecast: The suite provides five-year forecasts for the global cellular IoT market; providing data for the number of cellular IoT connections, connectivity revenue from cellular IoT, data generated by cellular IoT connections, number of cellular IoT modules shipped, total expenditure on cellular IoT modules, and total cellular IoT market value.
- Juniper Research Competitor Leaderboard: Key player capability and capacity assessment for 15 key vendors in the cellular IoT market, with market sizing and detailed analysis of each vendor's offering.
SAMPLE VIEW
Market Data & Forecasting Report

The numbers tell you what's happening, but our written report details why, alongside the methodologies.
SAMPLE VIEW
Market Trends & Strategies Report

A comprehensive analysis of the current market landscape, alongside strategic recommendations.
Market Data & Forecasting Report
The market-leading research for the "Cellular IoT" market includes access to the full set of forecast data; comprising more than 106,000 datapoints and 170 tables.
Metrics in the research suite include:
- Number of Cellular IoT Connections
- Connectivity Revenue from Cellular IoT
- Data Generated by Cellular IoT
- Number of Cellular IoT Modules Shipped
- Expenditure on Cellular IoT Modules
- Total Cellular IoT Market Value
Splits are provided for each of these metrics for 2G and 3G, 4G, 5G, and LPWA, with LPWA split into Narrowband Internet of Things (NB-IoT), and Long Term Evolution for Machines (LTE-M), and 5G split into Other 5G and 5G RedCap.
Juniper Research's Interactive Forecast Excel contains the following functionality:
- Statistics Analysis: Users benefit from the ability to search for specific metrics, displayed for all regions and countries across the data period. Graphs are easily modified and can be exported to the clipboard.
- Country Data Tool: This tool enables users to look at metrics for all regions and countries in the forecast period. Users can refine the metrics displayed via a search bar.
- Country Comparison Tool: Users can select and compare specific countries. The ability to export graphs is included in this tool.
- What-if Analysis: Here, users can compare forecast metrics against their own assumptions, via three interactive scenarios.
Market Trends & Strategies Report
This report thoroughly examines the global "Cellular IoT" market; assessing market trends, technological developments, and monetisable opportunities which are shaping the market presently and in the future. Alongside this analysis, the document provides a comprehensive evaluation of business strategies in the cellular IoT market; exploring how operators, MVNOs, and connectivity service providers can introduce new monetisation models and technologies into the cellular IoT market.
Competitor Leaderboard Report
The Competitor Leaderboard included in this report provides detailed evaluation and market positioning for 15 cellular IoT vendors. These companies are positioned as established leaders, leading challengers, or disruptors and challengers, based on a capacity, capability, and product assessment. This includes analysis of their key advantages in the market, future development plans, and key partnerships.
The cellular IoT Competitor Leaderboard includes the following key vendors:
|
|
|
Table of Contents
Market Trends & Strategies
1. Key Takeaways & Strategic Recommendations
- 1.1. Key Takeaways
- 1.2. Key Strategic Recommendations
2. Market Landscape
- 2.1. Introduction
- Figure 2.1: Total Number of Cellular IoT Connections, Split by China and Rest of the World (m), 2025-2030
- 2.2. Disruptive Services in Cellular IoT
- 2.2.1. Telecommunications APIs
- Figure 2.2: Total Operator Revenue from Telecommunications API calls ($m), Split by 8 Key Regions, 2024-2029
- 2.2.2. NTNs and Satellite IoT
- Figure 2.3: Total Satellite Revenue from NTNs (m), Split by 8 Key Regions, 2025-2030
- 2.2.3. Private Networks
- Table 2.4: Total Expenditure on Private Cellular Networks ($m), Split by Market Vertical, 2025-2030
- 2.2.4. AI Services for Cellular IoT
- i. Natural Language Interfaces for CMPs
- ii. AI Data Analytics
- iii. AI Inferencing
- iv. AI-based Multi RAT Selection
- 2.2.5. eSIMs and iSIMs
- Figure 2.5: Total Number of eSIMs and iSIMs in Cellular IoT Connections (m), 2023-2028
- i.SGP.32
- Figure 2.6: SGP.32 Architecture
- ii. SGP.41/42
- Figure 2.7: SGP41/42 Architecture Diagram
- 2.2.6. Quantum Security for Cellular IoT
- 2.2.1. Telecommunications APIs
3. Future Strategies for Cellular IoT Business Models and Monetisation
- 3.1. Cellular IoT Business Models and Monetisation
- 3.1.1. Revenue Not Connections and Technology Not Connectivity
- 3.1.2. LPWA Services, Business Models, and Monetisation
- Table 3.1: NB-IoT and LTE-M
- Table 3.2: Total Number of LPWA Connections (m), Split by 8 Key Regions, 2025-2030
- Figure 3.3: Total Number of LPWA Connections (m), Split by NB-IoT and LTE-M, 2025-2030
- 3.1.3. 5G Business Models and Monetisation
- Table 3.4: Total Number of 5G IoT Connections (m), Split by 8 Key Regions, 2025-2030
- i. Differentiated Connectivity and Network Slicing
- Figure 3.5: Types of Network Slice
- 3.2. Connectivity-as-a-Service
4. Country Readiness Index
- 4.1. Introduction to The Country Readiness Index
- Figure 4.1: Juniper Research Cellular IoT Market Country Readiness Index: Regional Definitions
- Table 4.2: Juniper Research Cellular IoT Market Country Readiness Index: Scoring Criteria
- Figure 4.3: Juniper Research Cellular IoT Market Country Readiness Index
- 4.2. Focus Markets
- i. 5G Infrastructure
- Figure 4.4: Total Cellular IoT Connectivity Revenue ($m), Split by Network Technology, 2025-2030
- ii. eSIM and iSIM Adoption
- 4.2.2. China
- Figure 4.5: Total Number of Cellular IoT Connections in China (m), Split by Network Technology, 2025-2030
- 4.2.3. The US
- Figure 4.6: Total Revenue from Cellular IoT Connections in the US ($m), 2025-2030
- Figure 4.7: Total Number of LTE-M and NB-IoT Connections in the US (m), 2025-2030
- i. 5G Infrastructure
- 4.3. Growth Markets
- Figure 4.8: Cellular IoT Market High-growth Countries
- 4.3.1. Brazil
- Figure 4.9: Total Revenue from Cellular IoT Connectivity in Brazil ($m), Split by Network Technology, 2025-2030
- 4.3.2. India
- Figure 4.10: Total Number of Cellular IoT Connections in India (m), Split by Network Technology, 2025-2030
- 4.4. Saturated Markets
- 4.5. Developing Markets
- Table 4.11: Juniper Research's Cellular IoT Market Country Readiness Index Heatmap: North America
- Table 4.12: Juniper Research's Cellular IoT Market Country Readiness Index Heatmap: Latin America
- Table 4.13: Juniper Research's Cellular IoT Market Country Readiness Index Heatmap: West Europe
- Table 4.14: Juniper Research's Cellular IoT Market Country Readiness Index Heatmap: Central & East Europe
- Table 4.15: Juniper Research's Cellular IoT Market Country Readiness Index Heatmap: Far East & China
- Table 4.16: Juniper Research's Cellular IoT Market Country Readiness Index Heatmap: Indian Subcontinent
- Table 4.17: Juniper Research's Cellular IoT Market Country Readiness Index Heatmap: Rest of Asia Pacific
- Table 4.18: Juniper Research's Cellular IoT Market Country Readiness Index Heatmap: Africa & Middle East
Competitor Leaderboard
1. Competitor Leaderboard
- 1.1. Why Read This Report
- Figure 1.1: Juniper Research's Cellular IoT Market Competitor Leaderboard: Vendors and Product Portfolios (1 of 2)
- Figure 1.1: Juniper Research's Cellular IoT Market Competitor Leaderboard: Vendors and Product Portfolios (2 of 2)
- Figure 1.2: Juniper Research's Cellular IoT Market Competitor Leaderboard: 15 Vendors
- Table 1.3: Juniper Research's Cellular IoT Market Competitor Leaderboard: 15 Vendors
- Table 1.4: Juniper Research's Cellular IoT Market Competitor Leaderboard Heatmap: 15 Vendors
2. Vendor Profiles
- 2.1 Vendor Profiles
- 2.1.1. AT&T
- i. Corporate Information
- Table 2.1: AT&T's Financial Information ($m), 2023-2024
- ii. Geographical Spread
- iii. Key Clients & Strategic Partnerships
- iv. High-level View of Offerings
- Figure 2.2: AT&T Control Center Features
- v. Juniper Research's View: Key Strengths & Strategic Development Opportunities
- i. Corporate Information
- 2.1.2. China Mobile
- i. Corporate Information
- Figure 2.3: China Mobile's Key Financial Metrics, 2023-2024
- ii. Geographical Spread
- iii. Key Clients & Strategic Partnerships
- iv. High-level View of Offerings
- v. Juniper Research's View: Key Strengths & Strategic Development Opportunities
- i. Corporate Information
- 2.1.3. Cisco
- i. Corporate Information
- ii. Geographical Spread
- iii. Key Clients & Strategic Partnerships
- iv. High-level View of Offerings
- Figure 2.4: Cisco Service Provider Partners
- v. Juniper Research's View: Key Strengths & Strategic Development Opportunities
- 2.1.4. Deutsche Telekom
- i. Corporate Information
- Table 2.5: Deutsche Telekom's Key Financial Metrics ($ billion), 2023-2024
- ii. Geographical Spread
- iii. Key Clients & Strategic Partnerships
- iv. High-level View of Offerings
- Figure 2.6: Deutsche Telekom IoT Connectivity Coverage
- Figure 2.7: Deutsche Telekom Platform Integrations
- v. Juniper Research's View: Key Strengths & Strategic Development Opportunities
- i. Corporate Information
- 2.1.5. emnify
- i. Corporate Information
- ii. Geographical Spread
- ii.Key Clients & Strategic Partnerships
- iv. High-level View of Offerings
- Figure 2.8: emnify's 5G Coverage
- v. Juniper Research's View: Key Strengths & Strategic Development Opportunities
- 2.1.6. Eseye
- i. Corporate Information
- ii. Geographical Spread
- iii. Key Clients & Strategic Partnerships
- iv. High-level View of Offerings
- Figure 2.9: SIM Switching Eseye
- Figure 2.10: Eseye's AnyNet Federation and Direct Operator Interconnects
- v. Juniper Research's View: Key Strengths & Strategic Development Opportunities
- 2.1.7. Huawei
- i. Corporate Information
- ii. Geographical Spread
- iii. Key Clients & Strategic Partnerships
- iv. High-level View of Offerings
- Figure 2.11: Huawei's IoT Connection Management Platform
- Figure 2.12: Huawei's IoT Device Management
- v. Juniper Research's View: Key Strengths & Strategic Development Opportunities
- 2.1.8. KORE Wireless
- i. Corporate Information
- ii. Geographical Spread
- iii. Key Clients & Strategic Partnerships
- iv. High-level View of Offerings
- Figure 2.13: KORE One Platform
- v. Juniper Research's View: Key Strengths & Strategic Development Opportunities
- 2.1.9. Orange Business
- i. Corporate Information
- ii. Geographical Spread
- Figure 2.14: Orange's Operations Map
- iii. Key Clients & Strategic Partnerships
- iv. High-level View of Offerings
- v. Juniper Research's View: Key Strengths & Strategic Development Opportunities
- 2.1.10. Tata Communications
- i. Corporate Information
- ii. Geographical Spread
- iii. Key Clients & Strategic Partnerships
- iv. High-level View of Offerings
- v. Juniper Research's View: Key Strengths & Strategic Development Opportunities
- 2.1.11. Telefonica Tech
- i. Corporate Information
- ii. Geographical Spread
- iii. Key Clients & Strategic Partnerships
- iv. High-level View of Offerings
- v. Juniper Research's View: Key Strengths & Strategic Development Opportunities
- 2.1.12. Telit Cinterion
- i. Corporate Information
- ii. Geographical Spread
- iii. Key Clients & Strategic Partnerships
- Figure 2.15: Telit Cinterion NExT(TM) eSIM Provisioning Portal
- iv. Juniper Research's View: Key Strengths & Strategic Development Opportunities
- 2.1.13. Verizon Business
- i. Corporate Information
- Table 2.16: Verizon's Key Financial Metrics, 2023-2024
- ii. Geographical Spread
- iii. Key Clients & Strategic Partnerships
- iv. High-level View of Offerings
- v. Juniper Research's View: Key Strengths & Strategic Development Opportunities
- i. Corporate Information
- 2.1.14. Vodafone Business
- i. Corporate Information
- ii. Geographical Spread
- iii. Key Clients & Strategic Partnerships
- iv. High-level View of Offerings
- Figure 2.17: Vodafone Business's LPWA Services Availability
- v. Juniper Research's View: Key Strengths & Strategic Development Opportunities
- 2.1.15. Wireless Logic
- i. Corporate Information
- ii. Geographical Spread
- iii. Key Clients & Strategic Partnerships
- iv. High-level View of Offerings
- v. Juniper Research's View: Key Strengths & Strategic Development Opportunities
- 2.1.1. AT&T
- 2.2. Juniper Research Leaderboard Assessment Methodology
- 2.3. Limitations & Interpretations
- Table 2.18: Juniper Research's Cellular IoT Market Competitor Leaderboard: 15 Vendors
- 2.4. Related Research
Data & Forecasting
1. Introduction and Methodology
- 1.1. Introduction
- Figure 1.1: Total Number of Cellular IoT Connections (m), Split by Network Technology, 2025-2030
- 1.2. Forecast Methodology
- Figure 1.2: Juniper Research Cellular IoT Market: Methodology Model
2. Market Summary and Future Market Outlook
- 2.1. Total Number of Cellular IoT Connections
- Figure & Table 2.1: Total Number of Cellular IoT Connections (m), Split by 8 Key Regions, 2025-2030
- 2.2. Total Connectivity Revenue from Cellular IoT
- Figure & Table 2.2: Total Connectivity Revenue from Cellular IoT ($m), Split by Key Regions, 2025-2030
- 2.3. Total Data Generated by Cellular IoT
- Figure & Table 2.3: Total Data Generated by Cellular IoT (PB), Split by 8 Key Regions, 2025-2030
- 2.4. Total Cellular IoT Modules Shipped
- Figure & Table 2.4: Total Cellular IoT Modules Shipped (m), Split by 8 Key Regions, 2025-2030
- 2.5. Total Expenditure on Cellular IoT Modules
- Figure & Table 2.5: Total Expenditure on Cellular IoT Modules ($m), Split by 8 Key Regions, 2025-2030
3. 4G IoT
- 3.1. Total Number of 4G IoT Connections
- Figure & Table 3.1: Total Number of 4G IoT Connections (m), Split by 8 Key Regions, 2025-2030
- 3.2. Total Connectivity Revenue from 4G IoT
- Figure & Table 3.2: Total Connectivity Revenue from 4G IoT ($m), Split by 8 Key Regions, 2025-2030
- Table 3.3: Proportion of Cellular IoT Connections that Are 2G & 3G, and 4G (%), 2023-2030
- 3.3. Total Data Generated by 4G IoT
- Figure & Table 3.4: Total Data Generated by 4G IoT (PB), Split by 8 Key Regions, 2025-2030
- 3.4. Total Number of 4G IoT Modules Shipped
- Figure & Table 3.5: Total Number of 4G IoT Modules Shipped (m), Split by 8 Key Regions, 2025-2030
- 3.5. Total Expenditure on 4G IoT Modules
- Figure & Table 3.6: Total Expenditure on 4G IoT Modules ($m), Split by 8 Key Regions, 2025-2030
- Table 3.7: Average Cost of a 4G IoT Module ($), Split by 8 Key Regions, 2025-2030
4. 5G IoT
- 4.1. Total Number of 5G IoT Connections
- Figure & Table 4.1: Total Number of 5G IOT connections (m) Split by 8 Key Regions, 2025-2030
- Table 4.2: Total Number of 5G IoT Connections (m), Split by 5G RedCap and Other 5G, 2025-2030
- 4.2. Total Connectivity Revenue from 5G IoT
- Figure & Table 4.3: Total Connectivity Revenue from 5G IoT ($m), Split by 8 Key Regions, 2025-2030
- Table 4.4: Total Connectivity Revenue from 5G IoT ($m), Split by 5G RedCap and Other 5G, 2025-2030
- 4.3. Total Data Generated by 5G IoT
- Figure & Table 4.5: Total Data Generated by 5G IoT (PB), Split by 8 Key Regions, 2025-2030
- Table 4.6: Total Data Generated by 5G IoT (PB), Split by 5G RedCap and Other 5G, 2025-2030
- 4.4. Total Number of 5G IoT Modules Shipped
- Figure & Table 4.7: Total Number of 5G IoT Modules Shipped (m), Split by 8 Key Regions, 2025-2030
- Table 4.8: Total Number of 5G IoT Modules Shipped (m), Split by RedCap and Other 5G, 2025-2030
- 4.5. Total Expenditure on 5G IoT Modules
- Figure & Table 4.9: Total Expenditure on 5G IoT Modules ($m), Split by 8 Key Regions, 2025-2030
- Table 4.10: Total Expenditure on 5G IoT Modules ($m), Split by RedCap and Other 5G, 2025-2030
5. LPWA
- 5.1. Total Number of LPWA Connections
- Figure & Table 5.1: Total Number of LPWA Connections (m), Split by 8 Key Regions, 2025-2030
- Figure 5.2: Total Number of LPWA Connections (m), Split by NB-IoT and LTE-M, 2025-2030
- 5.2. Total Connectivity Revenue from LPWA Connections
- Figure & Table 5.3: Total Connectivity Revenue from LPWA Connections ($m), Split by 8 Key Regions, 2025-2030
- Figure 5.4: Total Connectivity Revenue from LPWA Connections ($m), Split by NB-IoT and LTE-M, 2025-2030
- 5.3. Total Data Generated by LPWA Connections
- Figure & Table 5.5: Total Data Generated by LPWA Connections (PB), Split by 8 Key Regions, 2025-2030
- Table 5.6: Total Data Generated by LPWA Connections (PB), Split by NB-IoT and LTE-M, 2025-2030
- 5.4. Total Number of LPWA Modules Shipped
- Figure & Table 5.7: Total Number of LPWA Modules Shipped (m), Split by 8 Key Regions 2025-2030
- Table 5.8: Total Number of LPWA Modules Shipped (m), Split by NB-IoT and LTE-M, 2025-2030
- 5.5. Total Expenditure on LPWA Modules
- Figure & Table 5.9: Total Expenditure on LPWA Modules ($m), Split by 8 Key Regions, 2025-2030
- Table 5.10: Total Expenditure on LPWA Modules ($m), Split by NB-IoT and LTE-
