


|
시장보고서
상품코드
1790690
탄소발자국 관리 시장(-2030년) : 구성요소별(솔루션, 서비스), 전개 방식별(온프레미스, 클라우드), 조직 규모별(법인기업, 중견기업, 중소기업), 산업별, 지역별Carbon Footprint Management Market by Component (Solutions, Services), Deployment Mode (On-premises, Cloud), Organization Size (Corporate Enterprises, Mid-Tier Enterprises, Small Businesses), Vertical, and Region - Global Forecast to 2030 |
||||||
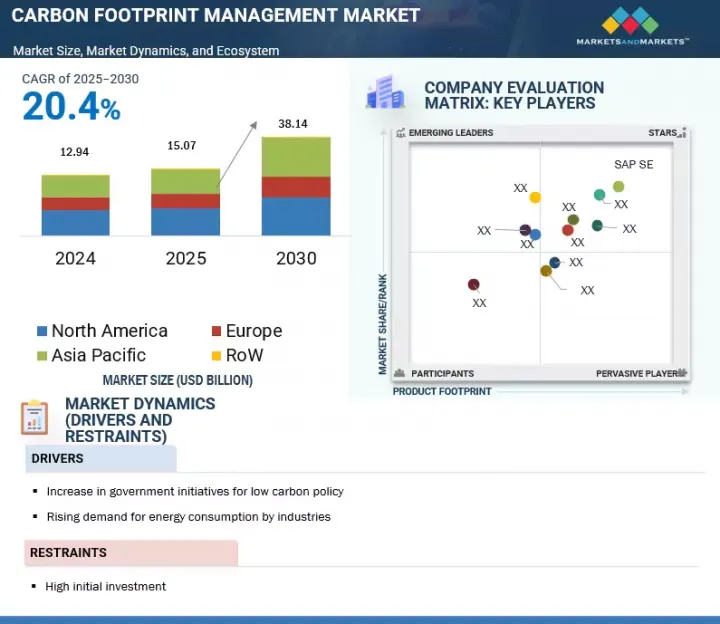
탄소발자국 관리 시장 규모는 2025년 150억 7,000만 달러에서 예측 기간 동안 CAGR 20.4%로 성장하여 2030년에는 381억 4,000만 달러에 달할 것으로 예측됩니다.
탄소 배출량 감축을 위한 정부 이니셔티브 증가, 산업 에너지 소비 증가, 지속가능성 보고에 대한 기업의 중요성 증가는 탄소발자국 관리 시장을 이끄는 주요 요인입니다.
| 조사 범위 | |
|---|---|
| 조사 대상 연도 | 2021-2030년 |
| 기준 연도 | 2024년 |
| 예측 기간 | 2025-2030년 |
| 검토 단위 | 금액(달러) |
| 부문별 | 구성요소, 전개 방식, 조직 규모, 산업, 지역별 |
| 대상 지역 | 아시아태평양, 북미, 유럽, 중동 및 아프리카, 남미 |
각국 정부는 엄격한 환경 규제를 시행하고 있으며, 이에 따라 산업계는 탄소 모니터링 솔루션을 도입하도록 촉구하고 있습니다. 한편, 다양한 분야의 에너지 수요 증가는 조직에 이용 효율 향상과 배출량 감소를 요구하고 있습니다. 또한, 기업들은 환경, 사회, 지배구조(ESG) 컴플라이언스를 더욱 중요시하고 있으며, 이는 탄소발자국 관리 솔루션의 도입을 더욱 가속화시키고 있습니다.

산업별로는 제조업 부문이 예측 기간 동안 가장 높은 CAGR을 나타낼 것으로 예측됩니다.
이는 친환경적이고 지속가능한 경제활동을 지원하기 위한 정부 및 업계의 각종 규제에 따른 것입니다. 많은 국가, 지역, 지자체에서 온실가스 감축을 위해 탄소세, 에너지세 등 관련 제도를 도입하고 있습니다. 2024년 현재 전 세계적으로 65개 이상의 탄소 가격 책정 이니셔티브(탄소세)가 시행 중이거나 예정되어 있으며, 이는 전 세계 배출량의 약 22%에 해당합니다. 또한, 많은 국가들이 자국 기업 및 산업 부문에 엄격한 세제 및 규제를 부과하여 탄소발자국을 줄이도록 장려하고 있으며, 이는 제조업 부문의 성장을 가속하고 있습니다.
전개별로 보면 클라우드 기술 부문이 2030년 가장 큰 시장 점유율을 차지할 것으로 예측됩니다.
클라우드 컴퓨팅 수요의 급증은 에너지 사용 최적화, 첨단 냉각 기술, 서버 가상화, 주요 공급업체들의 재생에너지에 대한 의존도 증가 등의 요인으로 인해 탄소발자국 관리에 큰 도움이 되고 있습니다. 이러한 변화를 통해 기업들은 디지털 업무 확대에 따른 탄소발자국을 크게 줄일 수 있습니다. 클라우드 도입은 IT 보안 강화, 24시간 지원, 높은 확장성, 업무 속도 향상 등 많은 이점을 제공합니다. 이러한 장점으로 인해 클라우드 기반 솔루션은 다양한 산업 분야에서 매우 매력적인 솔루션이 되고 있습니다. 또한, 수요에 따라 유연하게 자원을 증감할 수 있어 비용 최적화 및 효율성 향상을 실현합니다.
지역별로는 북미가 예측 기간 동안 시장을 장악할 것으로 예측됩니다.
북미는 탄소발자국 관리 시장을 선도하고 있으며, 예측 기간 동안에도 강력한 지위를 유지할 것으로 예측됩니다. 이러한 리더십은 보다 엄격한 환경 규제, 기업의 지속가능성 정책, 그린 테크놀러지에 대한 투자를 통해 기후 변화에 적극적으로 대응하는 자세에서 비롯된 것입니다. 또한, 급격한 경제 변화와 탄소 배출 증가에 대한 대중의 인식이 높아지면서 효과적인 탄소 관리 솔루션에 대한 수요도 증가하고 있습니다. 더 많은 기업과 정부가 기후 행동을 우선시함에 따라, 이 분야는 지속가능한 저탄소 미래로의 전환을 지원하기 위해 이 지역에서 계속 성장할 것으로 예측됩니다.
세계의 탄소발자국 관리 시장을 조사했으며, 시장 개요, 시장 성장에 영향을 미치는 각종 영향요인 분석, 기술 및 특허 동향, 법 및 규제 환경, 사례 분석, 시장 규모 추정 및 예측, 각종 부문별/지역별/주요 국가별 상세 분석, 경쟁 구도, 주요 기업 개요 등의 정보를 정리하여 전해드립니다. 정리했습니다.
목차
제1장 소개
제2장 조사 방법
제3장 주요 요약
제4장 주요 인사이트
제5장 시장 개요
- 시장 역학
- 성장 촉진요인
- 성장 억제요인
- 기회
- 과제
- 밸류체인 분석
- 생태계
- 사례 연구 분석
- 기술 분석
- 가격 분석
- 2025-2026년의 주요 회의와 이벤트
- 규제기관, 정부기관, 기타 조직
- 탄소발자국 관리에 관한 규제
- 탄소발자국 관리에 관한 기준
- 특허 분석
- Porter's Five Forces 분석
- 주요 이해관계자와 구입 기준
- 구입 기준
- 생성형 AI/AI가 탄소발자국 관리 시장에 미치는 영향
- 세계의 거시경제 전망
- 2025년 미국 관세의 영향 - 개요
제6장 탄소발자국 관리 시장 : 조직 규모별
- 대규모 기업
- 중규모 기업
- 소규모 기업
제7장 탄소발자국 관리 시장 : 산업별
- 제조
- 식품 및 음료
- 금속 및 광업
- 화학·재료
- 전자기기·소비재
- 자동차
- 의약품·헬스케어
- 기타
- 에너지·유틸리티
- 주택 및 상업 빌딩
- 운송·물류
- IT·통신
- 금융 서비스
- 정부
제8장 탄소발자국 관리 시장 : 구성요소별
- 솔루션
- 서비스
- 컨설팅
- 통합 및 배치
- 지원·유지관리
제9장 탄소발자국 관리 시장 : 전개 방식별
- 클라우드
- 온프레미스
제10장 탄소발자국 관리 시장 : 지역별
- 북미
- 유럽
- 아시아태평양
- 중동 및 아프리카
- 남미
제11장 경쟁 구도
- 주요 기업의 채용 전략
- 상위 5개사 시장 점유율 분석
- 상위 5개사 매출 분석
- 브랜드/제품 비교
- 기업 평가와 재무 지표
- 기업 평가 매트릭스 : 주요 기업
- 스타트업/중소기업 평가 쿼드런트
- 경쟁 시나리오
제12장 기업 개요
- 주요 기업
- SAP SE
- SALESFORCE, INC.
- ENGIE
- SCHNEIDER ELECTRIC
- IBM
- CARBON FOOTPRINT LTD.
- ISOMETRIX
- INTELEX
- TRINITY CONSULTANTS, INC.
- DAKOTA SOFTWARE CORPORATION
- ENABLON
- ENVIROSOFT
- ENVIANCE
- ACCUVIO
- ESP
- 기타 기업
- PROCESSMAP
- NATIVE
- ENERGYCAP, LLC.
- LOCUS TECHNOLOGIES
- ECOTRACK
- CARBON TRUST
제13장 부록
KSM 25.08.22The carbon footprint management market is estimated to be valued at USD 15.07 billion in 2025 and USD 38.14 billion by 2030, recording a CAGR of 20.4% during the forecast period. Increasing government initiatives to reduce carbon emissions, rising industrial energy consumption, and growing corporate emphasis on sustainability reporting are key factors driving the carbon footprint management market.
| Scope of the Report | |
|---|---|
| Years Considered for the Study | 2021-2030 |
| Base Year | 2024 |
| Forecast Period | 2025-2030 |
| Units Considered | Value (USD Million/USD Billion) |
| Segments | By Component, By Deployment Mode, By Organization Size, By Vertical, and Region |
| Regions covered | Asia Pacific, North America, Europe, the Middle East & Africa, and South America |
Governments worldwide implement strict environmental rules, prompting industries to adopt carbon monitoring solutions. Meanwhile, higher energy demands across different sectors force organizations to improve their usage and reduce emissions. Additionally, businesses are putting more emphasis on environmental, social, and governance (ESG) compliance, further accelerating the adoption of carbon footprint management solutions.
"By vertical, the manufacturing segment is expected to record the highest CAGR in the carbon footprint management market during the forecast period."
The manufacturing industry, by vertical, is expected to grow at the highest CAGR from 2025 to 2030, owing to various government and industry regulations to support green and sustainable economic activities. Several national, regional, and local governments have enacted carbon taxes and related measures, such as energy taxes, to reduce greenhouse gas emissions. As of 2024, over 65 carbon pricing initiatives-carbon taxes-are in place or scheduled globally, covering about 22% of world emissions. Additionally, to reduce their carbon footprint, many nations impose strict tax rules and regulations on their business and industrial sectors, contributing to the segmental growth.
"Based on deployment mode, the cloud technology segment is projected to hold the largest market share in 2030."
The cloud technology segment is expected to hold the largest share of the carbon footprint management market in 2030. The surge in cloud computing demand is a major boon for carbon footprint management, due to optimized energy use, advanced cooling, server virtualization, and increasing reliance on renewable energy by major providers. This shift enables companies to significantly cut their carbon footprint as they scale digital operations. Cloud deployment offers numerous benefits, including enhanced IT security, around-the-clock support, greater scalability, and increased operational speed. These advantages make cloud-based solutions highly attractive to organizations across various sectors. It provides flexibility by allowing businesses to scale their resources up or down based on demand, which optimizes costs and improves efficiency.
"North America is expected to dominate the carbon footprint management market between 2025 and 2030."
North America led the carbon footprint management market and is expected to maintain its strong position during the forecast period. This leadership stems from the region's proactive approach to tackling climate change through stricter environmental regulations, corporate sustainability initiatives, and investments in green technologies. Additionally, rapid economic shifts and a growing public awareness of the increasing carbon emissions augment the demand for effective carbon management solutions. As more businesses and governments prioritize climate action, the region is likely to see continued growth in this sector, supporting its transition toward a more sustainable and low-carbon future.
In-depth interviews have been conducted with various key industry participants, subject-matter experts, C-level executives of key market players, and industry consultants, among other experts, to obtain and verify critical qualitative and quantitative information and to assess future market prospects. The distribution of primary interviews is as follows:
By Company Type: Tier 1 - 40%, Tier 2 - 35%, and Tier 3 - 25%
By Designation: C-Level - 35%, Directors - 25%, and Others - 40%
By Region: Asia Pacific - 60%, North America - 10%, Europe - 15%, and RoW - 15%
Others include sales managers, engineers, and regional managers.
Note: Tier 1 Company-Revenue > USD 5 billion, Tier 2 Company-Revenue between USD 50 million and USD 5 billion, and Tier 3 Company-Revenue < USD 50 million
The global carbon footprint management market is dominated by a few major players with an extensive regional presence and many local players. Players in the carbon footprint management market include SAP SE (Germany), Salesforce, Inc. (US), ENGIE (France), Schneider Electric (France), IBM (US), Carbon Footprint Ltd. (UK), IsoMetrix (Australia), Intelex Technologies (Canada), Trinity Consultants, Inc. (US), Dakota Software Corporation (US), Enablon (France), Envirosift (UK), Enviance (US), Accuvio (Ireland), ESP (UK), Ideagen (UK), Native (US), EnergyCAP, LLC. (US), Locus Technologies (US), EcoTrack (US), and The Carbon Trust (UK).
Research Coverage:
The report defines, describes, and forecasts the carbon footprint management market by component, deployment mode, organization size, vertical, and region. It also offers a detailed qualitative and quantitative analysis of the market. The report provides a comprehensive review of the major market drivers, restraints, opportunities, and challenges. It also covers various important aspects of the market, including the analysis of the competitive landscape, market dynamics, market estimates in terms of value and volume, and future trends in the carbon footprint management market.
Key Benefits of Buying the Report
- Analysis of key drivers (Increasing government initiatives to reduce carbon emissions, Rising demand for energy consumption by industries, COP27 implementation to limit global warming), restraints (High upfront costs), opportunities (shift toward cloud computing and paperless economy), and challenges (comprehensive measuring, monitoring, and reporting scope) influencing the growth of the carbon footprint management market.
- Product Development/Innovation: Product development and innovation in the carbon footprint management market increasingly rely on AI-powered analytics, IoT-enabled real-time monitoring, and blockchain for transparent carbon tracking. Companies launch platforms that automate emissions measurement, improve predictive capabilities, and connect with ESG frameworks. This allows for more precise, scalable, and practical industry carbon reduction strategies.
- Market Development: Google Cloud and SAP announced the expansion of their relationship, unveiling new integrations between Google Workspace and SAP's flagship cloud ERP, SAP S/4HANA Cloud. These native integrations are expected to enable customers to connect core SAP software designed for running all mission-critical processes in the cloud with the collaborative capabilities of Google Docs and Google Sheets to innovate how work gets done across the enterprise.
- Market Diversification: SAP entered an agreement to acquire Signavio, a leader in enterprise business process intelligence and process management. This acquisition aimed to help companies rapidly understand, improve, transform, and manage their business processes at scale and was integrated into SAP's Business Process Intelligence portfolio. Signavio's solutions can support risk management and compliance efforts and provide greater visibility into third-party-related processes.
- Competitive Assessment: In-depth assessment of market shares, growth strategies, and service offerings of leading players, such as SAP SE (Germany), Salesforce, Inc. (US), ENGIE (France), Schneider Electric (France), IBM (US), and Carbon Footprint Ltd. (UK), is conducted.
TABLE OF CONTENTS
1 INTRODUCTION
- 1.1 STUDY OBJECTIVES
- 1.2 MARKET DEFINITION
- 1.3 STUDY SCOPE
- 1.3.1 MARKETS SEGMENTATION AND REGIONAL SCOPE
- 1.3.2 INCLUSIONS AND EXCLUSIONS
- 1.3.3 YEARS CONSIDERED
- 1.4 CURRENCY CONSIDERED
- 1.5 LIMITATIONS
- 1.6 STAKEHOLDERS
- 1.7 SUMMARY OF CHANGES
2 RESEARCH METHODOLOGY
- 2.1 RESEARCH DATA
- 2.2 MARKET BREAKDOWN AND DATA TRIANGULATION
- 2.2.1 SECONDARY DATA
- 2.2.1.1 Key data from secondary sources
- 2.2.2 PRIMARY DATA
- 2.2.2.1 Breakdown of primaries
- 2.2.2.2 Key data from primary sources
- 2.2.1 SECONDARY DATA
- 2.3 MARKET SIZE ESTIMATION
- 2.3.1 BOTTOM-UP APPROACH
- 2.3.2 TOP-DOWN APPROACH
- 2.3.3 DEMAND-SIDE ANALYSIS
- 2.3.3.1 Regional analysis
- 2.3.3.2 Country analysis
- 2.3.3.3 Demand-side assumptions
- 2.3.3.4 Demand-side calculations
- 2.3.4 SUPPLY-SIDE ANALYSIS
- 2.3.4.1 Supply-side calculations
- 2.3.4.2 Supply-side assumptions
- 2.3.5 FORECAST
3 EXECUTIVE SUMMARY
4 PREMIUM INSIGHTS
- 4.1 ATTRACTIVE OPPORTUNITIES FOR KEY PLAYERS IN CARBON FOOTPRINT MANAGEMENT MARKET
- 4.2 CARBON FOOTPRINT MANAGEMENT MARKET, BY REGION
- 4.3 NORTH AMERICA: CARBON FOOTPRINT MANAGEMENT MARKET, BY DEPLOYMENT MODE AND COUNTRY, 2024
- 4.4 CARBON FOOTPRINT MANAGEMENT MARKET, BY COMPONENT
- 4.5 CARBON FOOTPRINT MANAGEMENT MARKET, BY SERVICE
- 4.6 CARBON FOOTPRINT MANAGEMENT MARKET, BY DEPLOYMENT MODE
- 4.7 CARBON FOOTPRINT MANAGEMENT MARKET, BY ORGANIZATION SIZE
- 4.8 CARBON FOOTPRINT MANAGEMENT MARKET, BY VERTICAL
- 4.9 CARBON FOOTPRINT MANAGEMENT MARKET, BY MANUFACTURING INDUSTRY
5 MARKET OVERVIEW
- 5.1 INTRODUCTION
- 5.2 MARKET DYNAMICS
- 5.2.1 DRIVERS
- 5.2.1.1 Increasing government initiatives to reduce carbon emissions
- 5.2.1.2 Rising demand for energy consumption by industries
- 5.2.1.3 COP27 implementation to limit global warming
- 5.2.2 RESTRAINTS
- 5.2.2.1 High initial investment
- 5.2.3 OPPORTUNITIES
- 5.2.3.1 Shift toward cloud computing and paperless economy
- 5.2.4 CHALLENGES
- 5.2.4.1 Challenges in comprehensively measuring, monitoring, and reporting Scope 3 emissions
- 5.2.1 DRIVERS
- 5.3 VALUE CHAIN ANALYSIS
- 5.3.1 CARBON FOOTPRINT MANAGEMENT SOFTWARE VENDORS
- 5.3.2 SYSTEM INTEGRATORS AND SERVICE PROVIDERS
- 5.3.3 END USERS
- 5.3.4 POST-SALE SERVICES
- 5.4 ECOSYSTEM
- 5.5 CASE STUDY ANALYSIS
- 5.5.1 SASFIN BANK LTD USES ISOMETRIX SOFTWARE TO MITIGATE RISK
- 5.5.2 BEN & JERRY'S OFFSET PROVIDES SEED FUNDING FOR MORE SUSTAINABLE AGRICULTURE
- 5.6 TECHNOLOGY ANALYSIS
- 5.6.1 BLOCKCHAIN-BASED CARBON FOOTPRINT MANAGEMENT DEVELOPMENT
- 5.7 PRICING ANALYSIS
- 5.7.1 AVERAGE SELLING PRICE OF CARBON FOOTPRINT SOFTWARE SUBSCRIPTIONS, BY COMPANY
- 5.8 KEY CONFERENCES & EVENTS, 2025-2026
- 5.9 REGULATORY BODIES, GOVERNMENT AGENCIES, AND OTHER ORGANIZATIONS
- 5.10 REGULATIONS RELATED TO CARBON FOOTPRINT MANAGEMENT
- 5.11 STANDARDS RELATED TO CARBON FOOTPRINT MANAGEMENT
- 5.12 PATENT ANALYSIS
- 5.13 PORTER'S FIVE FORCES ANALYSIS
- 5.13.1 THREAT OF SUBSTITUTES
- 5.13.2 BARGAINING POWER OF SUPPLIERS
- 5.13.3 BARGAINING POWER OF BUYERS
- 5.13.4 THREAT OF NEW ENTRANTS
- 5.13.5 INTENSITY OF COMPETITIVE RIVALRY
- 5.14 KEY STAKEHOLDERS AND BUYING CRITERIA
- 5.14.1 KEY STAKEHOLDERS IN BUYING PROCESS
- 5.15 BUYING CRITERIA
- 5.16 IMPACT OF GEN AI/AI ON CARBON FOOTPRINT MANAGEMENT MARKET
- 5.16.1 ADOPTION OF GEN AI/AI IN CARBON FOOTPRINT MANAGEMENT MARKET
- 5.16.2 IMPACT OF GEN AI/AI, BY VERTICAL
- 5.16.3 IMPACT OF GEN AI/AI ON CARBON FOOTPRINT MANAGEMENT MARKET, BY REGION
- 5.17 GLOBAL MACROECONOMIC OUTLOOK
- 5.17.1 INTRODUCTION
- 5.17.2 GDP TRENDS AND FORECAST
- 5.17.3 IMPACT OF INFLATION ON CARBON FOOTPRINT MANAGEMENT MARKET
- 5.18 IMPACT OF 2025 US TARIFF - OVERVIEW
- 5.18.1 INTRODUCTION
- 5.18.2 KEY TARIFF RATES
- 5.18.3 IMPACT ON REGION
6 CARBON FOOTPRINT MANAGEMENT MARKET, BY ORGANIZATION SIZE
- 6.1 INTRODUCTION
- 6.2 CORPORATES/ENTERPRISES
- 6.2.1 RISING PRESSURE TO ADOPT SUSTAINABLE SOLUTIONS TO DRIVE MARKET
- 6.3 MID-TIER ENTERPRISES
- 6.3.1 STAKEHOLDER SUPPORT TO GOVERN ADOPTION TO BOOST MARKET
- 6.4 SMALL BUSINESSES
- 6.4.1 LACK OF AWARENESS AMONG SMALL BUSINESSES TO LIMIT GROWTH
7 CARBON FOOTPRINT MANAGEMENT MARKET, BY VERTICAL
- 7.1 INTRODUCTION
- 7.2 MANUFACTURING
- 7.2.1 RISKS RELATED TO NON-COMPLIANCE TO INCREASE IMPLEMENTATION
- 7.2.2 FOOD & BEVERAGES
- 7.2.2.1 Elimination of waste and inefficiency in production, distribution, and consumption - key drivers
- 7.2.3 METALS & MINING
- 7.2.3.1 Significant role in reducing global carbon footprint to drive segment
- 7.2.4 CHEMICAL & MATERIALS
- 7.2.4.1 Importance of Scope 3 emission reporting to fuel adoption
- 7.2.5 ELECTRONICS & CONSUMER GOODS
- 7.2.5.1 Solutions to help set near-term and long-term carbon emission targets
- 7.2.6 AUTOMOTIVE
- 7.2.6.1 Rising demand due to pressure from investors and government
- 7.2.7 PHARMACEUTICAL & HEALTHCARE
- 7.2.7.1 Automation to increase adoption
- 7.2.8 OTHERS
- 7.3 ENERGY & UTILITIES
- 7.3.1 RISING DEMAND FOR ENERGY TO LEAD TO INCREASING EMISSIONS
- 7.4 RESIDENTIAL & COMMERCIAL BUILDINGS
- 7.4.1 BENEFITS OF SIMULATION IN BUILDING ENERGY EFFICIENCY TO DRIVE MARKET
- 7.5 TRANSPORTATION & LOGISTICS
- 7.5.1 IMPROVED EFFICIENCY AND REDUCED COMPLEXITY TO DRIVE DEMAND
- 7.6 IT & TELECOM
- 7.6.1 SHIFT TO GREEN INFRASTRUCTURE AND SUPPLY CHAIN DECARBONIZATION TO DRIVE MARKET
- 7.7 FINANCIAL SERVICES
- 7.7.1 HIGH EMPHASIS ON LOWERING CARBON EMISSIONS TO BOOST MARKET
- 7.8 GOVERNMENT
- 7.8.1 HIGHER CONTRIBUTION TOWARD CARBON REDUCTION OBJECTIVES
8 CARBON FOOTPRINT MANAGEMENT MARKET, BY COMPONENT
- 8.1 INTRODUCTION
- 8.2 SOLUTIONS
- 8.2.1 INCREASING FOCUS ON EMISSION REDUCTION PLANS TO FUEL SEGMENT
- 8.3 SERVICES
- 8.3.1 NEED FOR HIGH EXPERTISE AND KNOWLEDGE ABOUT CARBON FOOTPRINT MANAGEMENT
- 8.3.2 CONSULTING
- 8.3.3 INTEGRATION & DEPLOYMENT
- 8.3.4 SUPPORT & MAINTENANCE
9 CARBON FOOTPRINT MANAGEMENT MARKET, BY DEPLOYMENT MODE
- 9.1 INTRODUCTION
- 9.2 CLOUD
- 9.2.1 EASE OF EXECUTION AND INCREASED DATA SECURITY
- 9.3 ON-PREMISES
- 9.3.1 LOWER ADOPTION RATES DUE TO INCREASING AUTOMATION
10 CARBON FOOTPRINT MANAGEMENT MARKET, BY REGION
- 10.1 INTRODUCTION
- 10.2 NORTH AMERICA
- 10.2.1 BY COMPONENT
- 10.2.2 BY SERVICE
- 10.2.3 BY DEPLOYMENT MODE
- 10.2.4 BY ORGANIZATION SIZE
- 10.2.5 BY VERTICAL
- 10.2.6 BY MANUFACTURING INDUSTRY
- 10.2.7 BY COUNTRY
- 10.2.7.1 US
- 10.2.7.1.1 Regulations on ESG disclosure and NDC targets to drive market
- 10.2.7.2 Canada
- 10.2.7.2.1 Sector-wise emission reduction strategy to boost demand
- 10.2.7.3 Mexico
- 10.2.7.3.1 Move toward energy-efficient and low-carbon footprint sustainable buildings and cities to boost market
- 10.2.7.1 US
- 10.3 EUROPE
- 10.3.1 BY COMPONENT
- 10.3.2 BY SERVICE
- 10.3.3 BY DEPLOYMENT MODE
- 10.3.4 BY ORGANIZATION SIZE
- 10.3.5 BY VERTICAL
- 10.3.6 BY MANUFACTURING INDUSTRY
- 10.3.7 BY COUNTRY
- 10.3.7.1 Germany
- 10.3.7.1.1 Federal carbon and GHG neutrality act to boost deployment
- 10.3.7.2 France
- 10.3.7.2.1 Initiatives to support decarbonization of emission-intensive sectors to boost market
- 10.3.7.3 UK
- 10.3.7.3.1 Focus on reducing emissions from power, transport, and building sectors to propel market
- 10.3.7.4 Rest of Europe
- 10.3.7.1 Germany
- 10.4 ASIA PACIFIC
- 10.4.1 BY COMPONENT
- 10.4.2 BY SERVICES
- 10.4.3 BY DEPLOYMENT MODE
- 10.4.4 BY ORGANIZATION SIZE
- 10.4.5 BY VERTICAL
- 10.4.6 BY MANUFACTURING INDUSTRY
- 10.4.7 BY COUNTRY
- 10.4.7.1 China
- 10.4.7.1.1 High returns associated with development and production of low-carbon technologies to drive market
- 10.4.7.2 India
- 10.4.7.2.1 Goals to reduce carbon emissions by 1 billion tons by 2030 to fuel market growth
- 10.4.7.3 Japan
- 10.4.7.3.1 Active participation by companies to achieve carbon neutrality goals to propel market
- 10.4.7.4 Singapore
- 10.4.7.4.1 Active participation in multinational emission control efforts to drive market
- 10.4.7.5 Australia
- 10.4.7.5.1 National framework on greenhouse gases and energy reporting to boost market growth
- 10.4.7.6 Rest of Asia Pacific
- 10.4.7.1 China
- 10.5 MIDDLE EAST & AFRICA
- 10.5.1 BY COMPONENT
- 10.5.2 BY SERVICE
- 10.5.3 BY DEPLOYMENT MODE
- 10.5.4 BY ORGANIZATION SIZE
- 10.5.5 BY VERTICAL
- 10.5.6 BY MANUFACTURING INDUSTRY
- 10.5.7 BY COUNTRY
- 10.5.7.1 Saudi Arabia
- 10.5.7.1.1 Launch of government initiatives to tackle emissions to propel market
- 10.5.7.2 UAE
- 10.5.7.2.1 Initiatives to improve quality of environment to boost market growth
- 10.5.7.3 Rest of Middle East & Africa
- 10.5.7.1 Saudi Arabia
- 10.6 SOUTH AMERICA
- 10.6.1 BY COMPONENT
- 10.6.2 BY SERVICE
- 10.6.3 BY DEPLOYMENT MODE
- 10.6.4 BY ORGANIZATION SIZE
- 10.6.5 BY VERTICAL
- 10.6.6 BY MANUFACTURING INDUSTRY
- 10.6.7 BY COUNTRY
- 10.6.7.1 Brazil
- 10.6.7.1.1 Focus on CO2 emission reduction to meet climate neutrality goals to drive demand
- 10.6.7.2 Rest of South America
- 10.6.7.1 Brazil
11 COMPETITIVE LANDSCAPE
- 11.1 STRATEGIES ADOPTED BY KEY PLAYERS
- 11.2 MARKET SHARE ANALYSIS OF TOP FIVE PLAYERS
- 11.3 REVENUE ANALYSIS OF TOP FIVE PLAYERS
- 11.4 BRAND/PRODUCT COMPARISON
- 11.5 COMPANY VALUATION AND FINANCIAL METRICS
- 11.6 COMPANY EVALUATION MATRIX: KEY PLAYERS, 2024
- 11.6.1 STARS
- 11.6.2 PERVASIVE PLAYERS
- 11.6.3 EMERGING LEADERS
- 11.6.4 PARTICIPANTS
- 11.6.5 COMPANY FOOTPRINT: KEY PLAYERS, 2024
- 11.6.5.1 Company footprint
- 11.6.5.2 Region footprint
- 11.6.5.3 Component footprint
- 11.6.5.4 Deployment mode footprint
- 11.6.5.5 Vertical footprint
- 11.7 STARTUP/SME EVALUATION QUADRANT, 2024
- 11.7.1 PROGRESSIVE COMPANIES
- 11.7.2 RESPONSIVE COMPANIES
- 11.7.3 DYNAMIC COMPANIES
- 11.7.4 STARTING BLOCKS
- 11.7.5 COMPETITIVE BENCHMARKING: STARTUPS/SMES, 2024
- 11.7.5.1 Detailed list of key startups/SMEs
- 11.7.5.2 Competitive benchmarking of key startups/SMEs
- 11.8 COMPETITIVE SCENARIO
- 11.8.1 PRODUCT LAUNCHES
- 11.8.2 DEALS
- 11.8.3 EXPANSIONS
12 COMPANY PROFILES
- 12.1 KEY PLAYERS
- 12.1.1 SAP SE
- 12.1.1.1 Business overview
- 12.1.1.2 Products/Solutions/Services offered
- 12.1.1.3 Recent developments
- 12.1.1.3.1 Deals
- 12.1.1.4 MnM view
- 12.1.1.4.1 Right to win
- 12.1.1.4.2 Strategic choices
- 12.1.1.4.3 Weaknesses and competitive threats
- 12.1.2 SALESFORCE, INC.
- 12.1.2.1 Business overview
- 12.1.2.2 Products/Solutions/Services offered
- 12.1.2.3 MnM view
- 12.1.2.3.1 Right to win
- 12.1.2.3.2 Strategic choices
- 12.1.2.3.3 Weaknesses and competitive threats
- 12.1.3 ENGIE
- 12.1.3.1 Business overview
- 12.1.3.2 Products/Solutions/Services offered
- 12.1.3.3 MnM view
- 12.1.3.3.1 Right to win
- 12.1.3.3.2 Strategic choices
- 12.1.3.3.3 Weaknesses and competitive threats
- 12.1.4 SCHNEIDER ELECTRIC
- 12.1.4.1 Business overview
- 12.1.4.2 Products/Solutions/Services offered
- 12.1.4.3 Recent developments
- 12.1.4.3.1 Deals
- 12.1.4.4 MnM view
- 12.1.4.4.1 Right to win
- 12.1.4.4.2 Strategic choices
- 12.1.4.4.3 Weaknesses and competitive threats
- 12.1.5 IBM
- 12.1.5.1 Business overview
- 12.1.5.2 Products/Solutions/Services offered
- 12.1.5.3 Recent developments
- 12.1.5.3.1 Product launches
- 12.1.5.4 MnM view
- 12.1.5.4.1 Right to win
- 12.1.5.4.2 Strategic choices
- 12.1.5.4.3 Weaknesses and competitive threats
- 12.1.6 CARBON FOOTPRINT LTD.
- 12.1.6.1 Business overview
- 12.1.6.2 Products/Solutions/Services offered
- 12.1.7 ISOMETRIX
- 12.1.7.1 Business overview
- 12.1.7.2 Products/Solutions/Services offered
- 12.1.7.3 Recent developments
- 12.1.7.3.1 Product launches
- 12.1.7.3.2 Deals
- 12.1.8 INTELEX
- 12.1.8.1 Business overview
- 12.1.8.2 Products/Solutions/Services offered
- 12.1.8.3 Recent developments
- 12.1.8.3.1 Deals
- 12.1.8.3.2 Expansions
- 12.1.9 TRINITY CONSULTANTS, INC.
- 12.1.9.1 Business overview
- 12.1.9.2 Products/Solutions/Services offered
- 12.1.9.3 Recent developments
- 12.1.9.3.1 Deals
- 12.1.10 DAKOTA SOFTWARE CORPORATION
- 12.1.10.1 Business overview
- 12.1.10.2 Products/Solutions/Services offered
- 12.1.10.3 Recent developments
- 12.1.10.3.1 Deals
- 12.1.11 ENABLON
- 12.1.11.1 Business overview
- 12.1.11.2 Products/Solutions/Services offered
- 12.1.11.3 Recent developments
- 12.1.11.3.1 Deals
- 12.1.12 ENVIROSOFT
- 12.1.12.1 Business overview
- 12.1.12.2 Products/Solutions/Services offered
- 12.1.13 ENVIANCE
- 12.1.13.1 Business overview
- 12.1.13.2 Products/Solutions/Services offered
- 12.1.13.3 Recent developments
- 12.1.13.3.1 Product launches
- 12.1.13.3.2 Deals
- 12.1.14 ACCUVIO
- 12.1.14.1 Business overview
- 12.1.14.2 Products/Solutions/Services offered
- 12.1.14.3 Recent developments
- 12.1.14.3.1 Deals
- 12.1.15 ESP
- 12.1.15.1 Business overview
- 12.1.15.2 Products/Solutions/Services offered
- 12.1.1 SAP SE
- 12.2 OTHER PLAYERS
- 12.2.1 PROCESSMAP
- 12.2.2 NATIVE
- 12.2.3 ENERGYCAP, LLC.
- 12.2.4 LOCUS TECHNOLOGIES
- 12.2.5 ECOTRACK
- 12.2.6 CARBON TRUST
13 APPENDIX
- 13.1 INSIGHTS FROM INDUSTRY EXPERTS
- 13.2 DISCUSSION GUIDE
- 13.3 KNOWLEDGESTORE: MARKETSANDMARKETS' SUBSCRIPTION PORTAL
- 13.4 CUSTOMIZATION OPTIONS
- 13.5 RELATED REPORTS
- 13.6 AUTHOR DETAILS
