|
시장보고서
상품코드
1810325
가상 프로덕션 시장 : 제공 제품별, 유형별, 최종 사용자별, 지역별 예측(-2030년)Virtual Production Market by Hardware, Software, Rental Services, Pre-production, Production, Post-production, Movies, Television Series, Commercial Advertisements, Online Videos, Events, Theatres, Music Concerts - Global Forecast to 2030 |
||||||
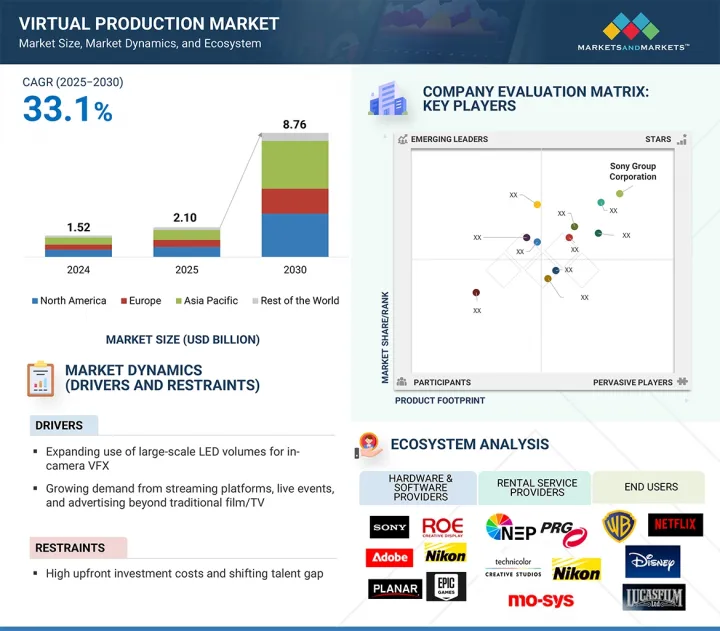
세계의 가상 프로덕션 시장 규모는 2025년 21억 달러에서 2030년 87억 6,000만 달러에 달할 것으로 예측되며, 예측 기간 중 CAGR은 33.1%로 성장할 것으로 예측됩니다.
| 조사 범위 | |
|---|---|
| 조사 대상 연도 | 2021-2030년 |
| 기준 연도 | 2024년 |
| 예측 기간 | 2025-2030년 |
| 검토 단위 | 금액(10억 달러) |
| 부문별 | 제공 제품별, 유형별, 최종 사용자별, 지역별 |
| 대상 지역 | 북미, 유럽, 아시아태평양 및 기타 지역 |
가상 프로덕션 시장은 인카메라 시각 효과(ICVFX)를 지원하고 촬영 현장의 효율을 향상시키는 대형 LED 볼륨의 사용 증가로 급성장하고 있습니다. 스트리밍 플랫폼 수요가 증가함에 따라 라이브 이벤트, 광고, 뮤직 비디오에서의 용도가 확대되고 있으며, 종래의 영화나 텔레비전 이외에도 그 저변이 확대되고 있습니다. 또한 AI를 활용한 실시간 렌더링의 진보는 창의적인 워크플로우에 변화를 가져오고 감독과 프로듀서에게 촬영 시 유연성 및 신속한 의사결정을 제공합니다. 이러한 요인들이 결합되어 세계에서 가상 프로덕션의 도입이 가속화되고 있습니다. 동시에 기업의 스토리텔링, 교육, 가상 트레이닝 등 몰입형이고 저렴한 컨텐츠 제작이 중요해지고 있는 새로운 분야에도 큰 기회가 퍼지고 있습니다. 또한 클라우드 기반 워크플로우의 사용이 증가함에 따라 원격지에서의 협업이 지원되며 비용을 절감하고 세계 인력에 대한 액세스를 넓히는 분산형 제작 모델이 가능합니다.

예측 기간 동안 가상 프로덕션 시장에서는 프리 프로덕션 부문이 가장 빠르게 성장할 것으로 예측됩니다. 이러한 성장의 원동력은 컨텐츠 제작에 있어 고급 시각화 및 계획 도구의 활용 증가입니다. 가상 프로덕션을 통해 디렉터, 프로듀서, 크리에이티브 팀은 실시간 3D 엔진, 가상 카메라 및 디지털 자산을 사용하여 복잡한 장면을 정확하게 사전 시각화할 수 있습니다. 이를 통해 광고 소재의 확실성을 높이고 지리적으로 분산된 팀 간의 협업을 촉진하고 촬영 시작 전에 잠재적인 문제를 해결하여 제작 주기를 단축할 수 있습니다. 영화, 에피소드 시리즈 및 광고 방송에서 고품질의 비주얼 스토리텔링에 대한 수요는 이해관계자가 창의적인 유연성을 유지하면서 비용 절감을 목표로 하는 채택을 뒷받침하고 있습니다. 또한 클라우드 기반 프리 프로덕션 워크플로우와 자산 생성 및 장면 계획을 위한 AI 툴의 성장으로 인해 이러한 기술은 선도적인 스튜디오와 소규모 프로덕션 모두에서 더 쉽게 사용할 수 있습니다. 스트리밍 플랫폼이 보다 신속한 컨텐츠 납기와 더 높은 비주얼 퀄리티를 요구하고 있기 때문에 프리 프로덕션 단계는 가상 프로덕션 기술을 적용하기 위한 중요한 단계가 되고 있습니다. 이러한 요인들로부터, 프리 프로덕션 분야는 고성장의 기회이며, 스튜디오는 경쟁 구도가 격화하는 미디어 환경에서 창의성, 효율성, 비용 절감의 균형을 맞출 수 있습니다.
TV 시리즈는 예측 기간 동안 가상 프로덕션 시장의 최종 사용자 분야에서 두 번째로 큰 점유율을 차지할 것으로 예측됩니다. 세계 스트리밍 플랫폼의 상승으로 에피소드 컨텐츠에 대한 수요가 크게 증가하고 있으며, 스튜디오는 영화와 같은 품질을 유지하면서 제작 일정을 단축해야 합니다. 가상 프로덕션 기술은 텔레비전 방송국이 기존의 촬영과 같은 물류나 자금 측면에서 어려움 없이 몰입감 있는 환경, 역동적인 세트, 실시간 시각 효과를 생성하는 데 도움이 됩니다. LED 볼륨, 프리비주얼라이제이션, 가상 애셋은 로케한을 반복하거나 물리적 세트를 구축할 필요성을 줄여줍니다. 게다가 Netflix, Disney, Amazon Prime과 같은 플랫폼이 가입자를 겨루는 경쟁 구도 속에서 높은 제작 가치를 가진 비주얼 풍부한 시리즈에 대한 투자가 증가하고 있습니다. 가상 프로덕션은 또한 창의적인 유연성을 제공하며 디렉터는 에피소드 간의 다운타임을 줄이면서 시각적 스토리텔링을 시행착오하고 정교하게 만들 수 있습니다. 고품질의 에피소드 컨텐츠를 효율적으로 제작할 수 있기 때문에 TV 시리즈는 채용의 중요한 추진력으로 자리매김하고 있습니다. 스트리밍 시청자가 세계적으로 늘어나는 가운데 TV 시리즈는 가상 제작 기술의 주요 이용 사례로 계속 급속히 확대될 가능성이 높습니다.
북미는 이 지역의 강력한 엔터테인먼트 산업, 첨단 기술 인프라, 최고 스튜디오의 집중으로 2025년에는 가상 프로덕션 시장에서 가장 큰 점유율을 차지할 것으로 예측됩니다. 할리우드와 미국의 주요 프로덕션 센터는 일찍부터 가상 프로덕션을 도입하고 있으며, '만달로리안' 및 '배트맨'과 같은 화제의 프로젝트는 LED 볼륨, 실시간 렌더링, 하이브리드 워크플로우의 이점을 입증하고 있습니다. 또한 Epic Games, NVIDIA, Planar 등 실시간 엔진, 그래픽 처리 및 디스플레이 솔루션의 혁신을 촉진하는 주요 기술 기업의 존재도 이 지역의 장점이 되었습니다. 게다가 스트리밍 서비스와 미디어 컨그로머리트에 의한 많은 투자가 고품질의 몰입감 있는 컨텐츠에 대한 수요를 높이고 있습니다. 특정 주에서는 정부의 우대 조치와 세액 공제가 추가 도입을 뒷받침하고 있으며, 제작사는 가상 프로덕션을 일반 워크플로우에 통합할 수 있습니다. 캐나다도 중요성이 커지고 있으며, 밴쿠버와 토론토는 영화와 TV 컨텐츠 모두의 허브 역할을 합니다. 확립된 인프라, 숙련된 노동력, 지속적인 투자의 조합으로 북미는 가상 프로덕션 시장의 주요 지역이 되어 도입과 성장 혁신에 있어 다른 지역의 기준이 되고 있습니다.
본 보고서에서는 세계의 가상 프로덕션 시장에 대해 조사했으며, 제공 제품별, 유형별, 최종 사용자별, 지역별 동향, 시장 진출기업 프로파일 등을 정리했습니다.
목차
제1장 서론
제2장 조사 방법
제3장 주요 요약
제4장 중요 인사이트
제5장 시장 개요
- 서문
- 시장 역학
- 공급망 분석
- 생태계 분석
- 가격 분석
- 고객의 비즈니스에 영향을 미치는 동향 및 혼란
- 기술 분석
- Porter's Five Forces 분석
- 주요 이해관계자 및 구매 기준
- 사례 연구 분석
- 무역 분석
- 특허 분석
- 주된 회의 및 이벤트(2025-2026년)
- 관세 및 규제 분석
- AI 및 생성형 AI가 가상 프로덕션 시장에 미치는 영향
- 미국 관세가 가상 프로덕션 시장에 미치는 영향(2025년)
제6장 가상 프로덕션 시장 : 제공 제품별
- 서문
- 하드웨어
- 소프트웨어
- 렌탈 서비스
제7장 가상 프로덕션 시장 : 유형별
- 서문
- 프리 프로덕션
- 프로덕션
- 포스트 프로덕션
제8장 가상 프로덕션 시장 : 최종 사용자별
- 서문
- 영화
- TV 시리즈
- 상업 광고
- 온라인 비디오
- 기타
제9장 가상 프로덕션 시장 : 지역별
- 서문
- 북미
- 북미의 거시 경제 전망
- 미국
- 캐나다
- 멕시코
- 유럽
- 유럽의 거시 경제 전망
- 영국
- 독일
- 프랑스
- 기타
- 아시아태평양
- 아시아태평양의 거시 경제 전망
- 중국
- 일본
- 한국
- 인도
- 기타
- 기타 지역
- 남미
- 중동 및 아프리카
제10장 경쟁 구도
- 서문
- 시장 평가 프레임워크
- 시장 점유율 분석(2024년)
- 수익 분석(2020-2024년)
- 기업 평가 매트릭스 : 주요 진입기업(2024년)
- 경쟁 시나리오
제11장 기업 프로파일
- 주요 진출기업
- SONY CORPORATION
- NEP GROUP, INC.
- NIKON CORPORATION
- ADOBE
- PRG
- ROE VISUAL
- AUTODESK INC.
- NVIDIA CORPORATION
- AOTO ELECTRONICS CO., LTD.
- EPIC GAMES
- 기타 기업
- ARRI GMBH
- TECHNIOLOR GROUP
- HTC CORPORATION
- VICON MOTION SYSTEMS LTD.
- SIDEFX
- MO-SYS ENGINEERING LTD.
- PERFORCE
- DNEG
- TILTLABS
- PLANAR SYSTEMS, INC.
- VIRSABI
- DIMENSIONS
- FUSE
- RECODE XR STUDIO
- VU TECHNOLOGIES
- 80SIX GROUP LTD.
- BORIS FX
- INSTA360
- 360RIZE
- WETA FX
제12장 부록
AJY 25.09.19The global virtual production market is estimated to be valued at USD 8.76 billion by 2030, up from USD 2.10 billion in 2025, at a CAGR of 33.1% during the forecast period.
| Scope of the Report | |
|---|---|
| Years Considered for the Study | 2021-2030 |
| Base Year | 2024 |
| Forecast Period | 2025-2030 |
| Units Considered | Value (USD Billion) |
| Segments | By Offering, Type, End User, and Region |
| Regions covered | North America, Europe, APAC, RoW |
The virtual production market is growing rapidly, driven by the increasing use of large-scale LED volumes that support in-camera visual effects (ICVFX) and improve on-set filmmaking efficiency. The rising demand from streaming platforms, along with growing applications in live events, advertising, and music videos, is expanding its reach beyond traditional film and TV. Additionally, advances in AI-powered real-time rendering are changing creative workflows, providing directors and producers with more flexibility and quicker decision-making during shoots. These factors are collectively speeding up the adoption of virtual production worldwide. Simultaneously, there are strong opportunities in new areas like corporate storytelling, education, and virtual training, where immersive and affordable content creation is becoming more important. The increasing use of cloud-based workflows is also supporting remote collaboration, enabling decentralized production models that cut costs and widen access to talent worldwide.
"The pre-production segment is expected to register the fastest growth in the type segment of the market during the forecast period."
The pre-production segment is expected to grow the fastest in the virtual production market during the forecast period. This growth is driven by the increased use of advanced visualization and planning tools in content creation. Virtual production enables directors, producers, and creative teams to pre-visualize complex scenes accurately with real-time 3D engines, virtual cameras, and digital assets. This improves creative certainty, boosts collaboration among geographically dispersed teams, and shortens production cycles by addressing potential issues before filming starts. The demand for high-quality visual storytelling in films, episodic series, and commercials supports adoption, as stakeholders aim to lower costs while maintaining creative flexibility. Additionally, the growth of cloud-based pre-production workflows and AI tools for asset creation and scene planning makes these technologies more accessible for both large studios and smaller production companies. With streaming platforms demanding faster content turnaround and higher visual quality, the pre-production phase becomes a vital stage for applying virtual production technologies. These factors make the pre-production segment a high-growth opportunity, allowing studios to balance creativity, efficiency, and cost savings in an increasingly competitive media landscape environment.
"Television series is expected to account for the second largest segment of the end-user segment of the market during the forecast period."
Television series are expected to make up the second-largest share of the virtual production market's end-user segment during the forecast period. The rise of global streaming platforms has greatly increased demand for episodic content, prompting studios to speed up production timelines while maintaining cinematic quality. Virtual production technologies help television studios create immersive environments, dynamic sets, and real-time visual effects without the logistical and financial challenges of traditional location shoots. This is especially helpful for series with recurring settings or long story arcs, where LED volumes, pre-visualization, and virtual assets decrease the need for repeated location scouting and physical set building. Additionally, in the competitive streaming landscape-where platforms like Netflix, Disney+, and Amazon Prime vie for subscribers-increased investments are being made in visually rich series with high production value. Virtual production also offers creative flexibility, allowing directors to experiment and refine visual storytelling while reducing downtime between episodes. The ability to efficiently produce high-quality episodic content positions television series as a key driver for adoption. As streaming viewership continues to grow worldwide, television series are likely to remain a major and rapidly expanding use case for virtual production technologies.
"North America is expected to account for the largest market share in 2025."
North America is projected to hold the largest share of the virtual production market in 2025, thanks to the region's strong entertainment industry, advanced technological infrastructure, and concentration of top studios. Hollywood and major production centers in the US have been early users of virtual production, with high-profile projects like The Mandalorian and The Batman demonstrating the benefits of LED volumes, real-time rendering, and hybrid workflows. The region also benefits from the presence of leading technology companies, including Epic Games, NVIDIA, and Planar, which foster innovation in real-time engines, graphics processing, and display solutions. Additionally, heavy investment by streaming services and media conglomerates is increasing demand for high-quality, immersive content. Government incentives and tax credits in certain states further encourage adoption, allowing production companies to incorporate virtual production into regular workflows. Canada is also gaining importance, with Vancouver and Toronto acting as hubs for both film and TV content. The combination of established infrastructure, skilled workforce, and ongoing investment makes North America the leading region in the virtual production market, setting standards for other areas in adoption and growth innovation.
The break-up of the profile of primary participants in the virtual production market-
- By Company Type: Tier 1 - 45%, Tier 2 - 35%, Tier 3 - 30%
- By Designation Type: C Level - 32%, Director Level - 40%, Others - 28%
- By Region Type: Europe - 15%, North America - 40%, Asia Pacific - 37%, Rest of the World - 8%
Note: Other designations include sales, marketing, and product managers.
The three tiers of the companies are based on their total revenues as of 2024: Tier 1: >USD 1 billion, Tier 2: USD 500 million-1 billion, and Tier 3: USD 500 million
The major players in the virtual production market with a significant global presence include Sony Group Corporation (Japan), NEP Group, Inc. (US), Nikon Corporation (Japan), Adobe (US), PRG (US), and others.
Research Coverage
The report segments the virtual production market and forecasts its size based on offering, type, end user, and region. It also provides a comprehensive review of drivers, restraints, opportunities, and challenges affecting market growth. The report covers both qualitative and quantitative aspects market.
Reasons to buy the report:
The report will assist market leaders and new entrants by providing approximate revenue figures for the overall virtual production market and its related segments. It will help stakeholders understand the competitive landscape and gain insights to strengthen their market position and develop effective go-to-market strategies. Additionally, the report offers stakeholders a pulse on the market and information on key drivers, restraints, opportunities, and other relevant factors challenges.
The report provides insights into the following pointers:
- Analysis of key drivers (expanding use of large-scale LED volumes for in-camera VFX, growing demand from streaming platforms, live events, and advertising beyond traditional film and television, rising adoption of AI-driven real-time rendering.), restraints (high upfront investment costs, and shortage of skilled professionals), opportunities (expansion into corporate storytelling, education, and virtual training, rising adoption of cloud-based virtual production workflows enabling remote collaboration), and challenges (LED wall limitations in color accuracy and brightness, particularly for outdoor scene simulation, continue to impact production quality, interoperability issues between hardware, software, and rendering engines)
- Product Development/Innovation: Detailed insights on upcoming technologies, research & development activities, and new product launches in the virtual production market.
- Market Development: Comprehensive information about lucrative markets - the report analyses the virtual production market across varied regions.
- Market Diversification: Exhaustive information about new products, untapped geographies, recent developments, and investments in the virtual production market.
- Competitive Assessment: In-depth assessment of market shares, growth strategies, and product and service offerings of leading players, including Sony Group Corporation (Japan), NEP Group, Inc. (US), Nikon Corporation (Japan), Adobe (US), and PRG (US).
TABLE OF CONTENTS
1 INTRODUCTION
- 1.1 STUDY OBJECTIVES
- 1.2 MARKET DEFINITION
- 1.3 STUDY SCOPE
- 1.3.1 MARKET SEGMENTATION & REGIONAL SCOPE
- 1.3.2 INCLUSIONS & EXCLUSIONS
- 1.3.3 YEARS CONSIDERED
- 1.3.4 CURRENCY CONSIDERED
- 1.3.5 UNIT CONSIDERED
- 1.4 STAKEHOLDERS
- 1.5 SUMMARY OF CHANGES
2 RESEARCH METHODOLOGY
- 2.1 RESEARCH DATA
- 2.1.1 SECONDARY AND PRIMARY RESEARCH
- 2.1.2 SECONDARY DATA
- 2.1.2.1 List of key secondary sources
- 2.1.2.2 Key data from secondary sources
- 2.1.3 PRIMARY DATA
- 2.1.3.1 Breakdown of primaries
- 2.1.3.2 List of key primary interview participants
- 2.1.3.3 Key data from primary sources
- 2.1.3.4 Key industry insights
- 2.2 FACTOR ANALYSIS
- 2.2.1 SUPPLY-SIDE ANALYSIS
- 2.2.2 DEMAND-SIDE ANALYSIS
- 2.3 MARKET SIZE ESTIMATION
- 2.3.1 BOTTOM-UP APPROACH
- 2.3.2 TOP-DOWN APPROACH
- 2.3.3 GROWTH PROJECTIONS AND FORECAST ASSUMPTIONS
- 2.4 DATA TRIANGULATION
- 2.5 STUDY ASSUMPTIONS
- 2.6 RESEARCH LIMITATIONS
- 2.7 RISK ANALYSIS
3 EXECUTIVE SUMMARY
4 PREMIUM INSIGHTS
- 4.1 ATTRACTIVE GROWTH OPPORTUNITIES FOR MARKET PLAYERS
- 4.2 VIRTUAL PRODUCTION MARKET, BY OFFERING
- 4.3 VIRTUAL PRODUCTION MARKET, BY TYPE
- 4.4 VIRTUAL PRODUCTION MARKET, BY COUNTRY
- 4.5 VIRTUAL PRODUCTION MARKET, BY REGION
5 MARKET OVERVIEW
- 5.1 INTRODUCTION
- 5.2 MARKET DYNAMICS
- 5.2.1 DRIVERS
- 5.2.1.1 Expanding use of large-scale LED volumes for in-camera VFX
- 5.2.1.2 Growing demand from streaming platforms, live events, and advertising beyond traditional film/TV
- 5.2.1.3 Rising adoption of AI-driven real-time rendering
- 5.2.2 RESTRAINTS
- 5.2.2.1 High upfront investment costs and shifting talent gap
- 5.2.2.2 Limited pool of professionals skilled in advanced technologies
- 5.2.3 OPPORTUNITIES
- 5.2.3.1 Expansion into corporate storytelling, education, and virtual training
- 5.2.3.2 Adoption of cloud-based virtual production workflows for remote collaborations
- 5.2.4 CHALLENGES
- 5.2.4.1 Limitations in LED wall for outdoor scene simulation
- 5.2.4.2 Interoperability issues and lack of standardized protocols
- 5.2.1 DRIVERS
- 5.3 SUPPLY CHAIN ANALYSIS
- 5.4 ECOSYSTEM ANALYSIS
- 5.4.1 ROLE IN ECOSYSTEM
- 5.5 PRICING ANALYSIS
- 5.5.1 AVERAGE SELLING PRICE TREND OF HARDWARE, BY KEY PLAYER, 2021-2024
- 5.5.2 AVERAGE SELLING PRICE TREND OF HARDWARE, BY REGION, 2021-2024
- 5.6 TRENDS & DISRUPTIONS IMPACTING CUSTOMERS' BUSINESSES
- 5.6.1 REVENUE SHIFT AND NEW REVENUE POCKETS FOR MARKET PLAYERS
- 5.7 TECHNOLOGY ANALYSIS
- 5.7.1 KEY TECHNOLOGIES
- 5.7.1.1 Real-time rendering
- 5.7.1.2 LED displays
- 5.7.2 COMPLEMENTARY TECHNOLOGIES
- 5.7.2.1 Camera tracking
- 5.7.2.2 Motion capture
- 5.7.3 ADJACENT TECHNOLOGIES
- 5.7.3.1 Cloud rendering & remote collaboration
- 5.7.3.2 Artificial intelligence & machine learning
- 5.7.1 KEY TECHNOLOGIES
- 5.8 PORTER'S FIVE FORCES ANALYSIS
- 5.8.1 THREAT OF NEW ENTRANTS
- 5.8.2 THREAT OF SUBSTITUTES
- 5.8.3 BARGAINING POWER OF SUPPLIERS
- 5.8.4 BARGAINING POWER OF BUYERS
- 5.8.5 INTENSITY OF COMPETITIVE RIVALRY
- 5.9 KEY STAKEHOLDERS & BUYING CRITERIA
- 5.9.1 KEY STAKEHOLDERS IN BUYING PROCESS
- 5.9.2 KEY BUYING CRITERIA
- 5.10 CASE STUDY ANALYSIS
- 5.10.1 SUCCESSFUL IMPLEMENTATION OF MASSIVE LED VIRTUAL PRODUCTION BY ABSEN & VERSATILE
- 5.10.2 EFFECTIVE USE OF VIRTUAL PRODUCTION FOR STREAMING BMW BERLIN MARATHON
- 5.10.3 TRANSFORMATION OF LOCATION-BASED SHOOT TO VIRTUAL PRODUCTION STUDIO SHOOT
- 5.11 TRADE ANALYSIS
- 5.11.1 IMPORT DATA FOR HS CODE 900710, 2020-2024
- 5.11.2 EXPORT DATA FOR HS CODE 900710, 2020-2024
- 5.12 PATENT ANALYSIS
- 5.12.1 LIST OF MAJOR PATENTS
- 5.13 KEY CONFERENCES & EVENTS, 2025-2026
- 5.14 TARIFF & REGULATORY ANALYSIS
- 5.14.1 REGULATORY BODIES, GOVERNMENT AGENCIES, AND OTHER ORGANIZATIONS
- 5.14.2 TARIFFS, REGULATIONS, AND STANDARDS
- 5.14.2.1 Tariffs
- 5.14.2.2 Regulations
- 5.14.2.3 Standards
- 5.15 IMPACT OF AI/GEN AI ON VIRTUAL PRODUCTION MARKET
- 5.16 IMPACT OF 2025 US TARIFF ON VIRTUAL PRODUCTION MARKET
- 5.16.1 INTRODUCTION
- 5.16.2 KEY TARIFF RATES
- 5.16.3 PRICE IMPACT ANALYSIS
- 5.16.4 IMPACT ON COUNTRY/REGION
- 5.16.4.1 North America
- 5.16.4.1.1 US
- 5.16.4.2 Europe
- 5.16.4.3 Asia Pacific
- 5.16.4.1 North America
- 5.16.5 IMPACT ON END-USE INDUSTRIES
6 VIRTUAL PRODUCTION MARKET, BY OFFERING
- 6.1 INTRODUCTION
- 6.2 HARDWARE
- 6.2.1 ACCELERATING CONTENT INNOVATION THROUGH ADVANCED LED AND CAMERA ECOSYSTEMS TO AUGMENT MARKET GROWTH
- 6.3 SOFTWARE
- 6.3.1 POPULARITY OF SEAMLESS CGI INTEGRATION THROUGH INTELLIGENT SOFTWARE SOLUTIONS TO PROPEL MARKET GROWTH
- 6.4 RENTAL SERVICES
- 6.4.1 RENTAL SERVICES TO MAXIMIZE CAPITAL EFFICIENCY WITH ON-DEMAND VIRTUAL PRODUCTION ECOSYSTEMS
7 VIRTUAL PRODUCTION MARKET, BY TYPE
- 7.1 INTRODUCTION
- 7.2 PRE-PRODUCTION
- 7.2.1 BETTER TRANSFORMATION WITH PREDICTIVE VISUALIZATION TO DRIVE MARKET
- 7.3 PRODUCTION
- 7.3.1 INCREASED ACCESSIBILITY DURING PRODUCTION TO DRIVE WORKFLOW INTEGRATION AND CREATIVE PRECISION
- 7.4 POST-PRODUCTION
- 7.4.1 ACCELERATING CONTENT THROUGH REAL-TIME VIRTUAL POST-PRODUCTION WORKFLOWS TO AID GROWTH
8 VIRTUAL PRODUCTION MARKET, BY END USER
- 8.1 INTRODUCTION
- 8.2 MOVIES
- 8.2.1 INCREASED ADOPTION OF REAL-TIME VFX INTEGRATION FOR FILM PRODUCTION TO BOOST MARKET GROWTH
- 8.3 TELEVISION SERIES
- 8.3.1 TELEVISION SERIES TO ENABLE EFFICIENT AND HIGH-QUALITY PRODUCTION THROUGH VIRTUAL SETS
- 8.4 COMMERCIAL ADVERTISEMENTS
- 8.4.1 COMMERCIAL ADVERTISEMENTS TO USE VIRTUAL PRODUCTION TECHNOLOGIES FOR CREATIVE RESULTS AT LOWER BUDGETS
- 8.5 ONLINE VIDEOS
- 8.5.1 POPULARITY OF ON-DEMAND AND VISUALLY APPEALING CONTENT ACROSS OTT AND SOCIAL MEDIA PLATFORMS TO DRIVE MARKET
- 8.6 OTHER END USERS
9 VIRTUAL PRODUCTION MARKET, BY REGION
- 9.1 INTRODUCTION
- 9.2 NORTH AMERICA
- 9.2.1 MACROECONOMIC OUTLOOK FOR NORTH AMERICA
- 9.2.2 US
- 9.2.2.1 US to dominate North American virtual production market during forecast period
- 9.2.3 CANADA
- 9.2.3.1 Consistent demand for larger virtual production studios to spur market growth
- 9.2.4 MEXICO
- 9.2.4.1 Growing popularity of Mexican film and the television industry to boost market
- 9.3 EUROPE
- 9.3.1 MACROECONOMIC OUTLOOK FOR EUROPE
- 9.3.2 UK
- 9.3.2.1 Increased spending on film and high-end television production to propel market growth
- 9.3.3 GERMANY
- 9.3.3.1 Steady growth in German film industry with investments in advanced studio equipment to augment market growth
- 9.3.4 FRANCE
- 9.3.4.1 High investments in French cinema and increased film production to aid market growth
- 9.3.5 REST OF EUROPE
- 9.4 ASIA PACIFIC
- 9.4.1 MACROECONOMIC OUTLOOK FOR ASIA PACIFIC
- 9.4.2 CHINA
- 9.4.2.1 Extensive investments in advanced studio infrastructure and immersive production workflows to drive market
- 9.4.3 JAPAN
- 9.4.3.1 Presence of several top-tier virtual production stages to boost market growth
- 9.4.4 SOUTH KOREA
- 9.4.4.1 South Korea to accelerate focus on virtual production through advanced studios and strategic partnerships
- 9.4.5 INDIA
- 9.4.5.1 Increasing collaborations for new virtual production studios to boost market growth
- 9.4.6 REST OF ASIA PACIFIC
- 9.5 REST OF THE WORLD
- 9.5.1 SOUTH AMERICA
- 9.5.1.1 Expanding film industry and increasing demand for smart stages to boost adoption of virtual production
- 9.5.2 MIDDLE EAST & AFRICA
- 9.5.2.1 Technological innovation, strategic investments, and high demand for immersive content to drive market
- 9.5.1 SOUTH AMERICA
10 COMPETITIVE LANDSCAPE
- 10.1 INTRODUCTION
- 10.2 MARKET EVALUATION FRAMEWORK
- 10.2.1 PRODUCT PORTFOLIO
- 10.2.2 REGIONAL FOCUS
- 10.2.3 MANUFACTURING FOOTPRINT
- 10.2.4 ORGANIC/INORGANIC STRATEGIES
- 10.3 MARKET SHARE ANALYSIS, 2024
- 10.4 REVENUE ANALYSIS, 2020-2024
- 10.5 COMPANY EVALUATION MATRIX: KEY PLAYERS, 2024
- 10.5.1 STARS
- 10.5.2 EMERGING LEADERS
- 10.5.3 PERVASIVE PLAYERS
- 10.5.4 PARTICIPANTS
- 10.5.5 COMPANY FOOTPRINT: KEY PLAYERS, 2024
- 10.5.5.1 Company footprint
- 10.5.5.2 Region footprint
- 10.5.5.3 Offering footprint
- 10.5.5.4 End-user footprint
- 10.6 COMPETITIVE SCENARIO
- 10.6.1 PRODUCT LAUNCHES
- 10.6.2 DEALS
11 COMPANY PROFILES
- 11.1 KEY PLAYERS
- 11.1.1 SONY CORPORATION
- 11.1.1.1 Business overview
- 11.1.1.2 Products/Solutions/Services offered
- 11.1.1.3 Recent developments
- 11.1.1.3.1 Product launches
- 11.1.1.3.2 Deals
- 11.1.1.4 MnM view
- 11.1.1.4.1 Right to win
- 11.1.1.4.2 Strategic choices
- 11.1.1.4.3 Weaknesses & competitive threats
- 11.1.2 NEP GROUP, INC.
- 11.1.2.1 Business overview
- 11.1.2.2 Products/Solutions/Services offered
- 11.1.2.3 Recent developments
- 11.1.2.3.1 Product launches
- 11.1.2.3.2 Deals
- 11.1.2.4 MnM view
- 11.1.2.4.1 Right to win
- 11.1.2.4.2 Strategic choices
- 11.1.2.4.3 Weaknesses & competitive threats
- 11.1.3 NIKON CORPORATION
- 11.1.3.1 Business overview
- 11.1.3.2 Products/Solutions/Services offered
- 11.1.3.3 Recent developments
- 11.1.3.3.1 Product launches
- 11.1.3.3.2 Deals
- 11.1.3.4 MnM view
- 11.1.3.4.1 Right to win
- 11.1.3.4.2 Strategic choices
- 11.1.3.4.3 Weaknesses & competitive threats
- 11.1.4 ADOBE
- 11.1.4.1 Business overview
- 11.1.4.2 Products/Solutions/Services offered
- 11.1.4.3 Recent developments
- 11.1.4.3.1 Product launches
- 11.1.4.3.2 Deals
- 11.1.4.4 MnM view
- 11.1.4.4.1 Right to win
- 11.1.4.4.2 Strategic choices
- 11.1.4.4.3 Weaknesses & competitive threats
- 11.1.5 PRG
- 11.1.5.1 Business overview
- 11.1.5.2 Products/Solutions/Services offered
- 11.1.5.3 Recent developments
- 11.1.5.3.1 Product launches
- 11.1.5.3.2 Deals
- 11.1.5.4 MnM view
- 11.1.5.4.1 Right to win
- 11.1.5.4.2 Strategic choices
- 11.1.5.4.3 Weaknesses & competitive threats
- 11.1.6 ROE VISUAL
- 11.1.6.1 Business overview
- 11.1.6.2 Products/Solutions/Services offered
- 11.1.6.3 Recent developments
- 11.1.6.3.1 Product launches
- 11.1.6.3.2 Deals
- 11.1.7 AUTODESK INC.
- 11.1.7.1 Business overview
- 11.1.7.2 Products/Solutions/Services offered
- 11.1.7.3 Recent developments
- 11.1.7.3.1 Product launches
- 11.1.7.3.2 Deals
- 11.1.8 NVIDIA CORPORATION
- 11.1.8.1 Business overview
- 11.1.8.2 Products/Solutions/Services offered
- 11.1.8.3 Recent developments
- 11.1.8.3.1 Product launches and updates
- 11.1.8.3.2 Deals
- 11.1.9 AOTO ELECTRONICS CO., LTD.
- 11.1.9.1 Business overview
- 11.1.9.2 Products/Solutions/Services offered
- 11.1.9.3 Recent developments
- 11.1.9.3.1 Product launches
- 11.1.9.3.2 Deals
- 11.1.10 EPIC GAMES
- 11.1.10.1 Business overview
- 11.1.10.2 Products/Solutions/Services offered
- 11.1.10.3 Recent developments
- 11.1.10.3.1 Product launches and updates
- 11.1.10.3.2 Deals
- 11.1.1 SONY CORPORATION
- 11.2 OTHER PLAYERS
- 11.2.1 ARRI GMBH
- 11.2.2 TECHNIOLOR GROUP
- 11.2.3 HTC CORPORATION
- 11.2.4 VICON MOTION SYSTEMS LTD.
- 11.2.5 SIDEFX
- 11.2.6 MO-SYS ENGINEERING LTD.
- 11.2.7 PERFORCE
- 11.2.8 DNEG
- 11.2.9 TILTLABS
- 11.2.10 PLANAR SYSTEMS, INC.
- 11.2.11 VIRSABI
- 11.2.12 DIMENSIONS
- 11.2.13 FUSE
- 11.2.14 RECODE XR STUDIO
- 11.2.15 VU TECHNOLOGIES
- 11.2.16 80SIX GROUP LTD.
- 11.2.17 BORIS FX
- 11.2.18 INSTA360
- 11.2.19 360RIZE
- 11.2.20 WETA FX
12 APPENDIX
- 12.1 DISCUSSION GUIDE
- 12.2 KNOWLEDGESTORE: MARKETSANDMARKETS' SUBSCRIPTION PORTAL
- 12.3 CUSTOMIZATION OPTIONS
- 12.4 RELATED REPORTS
- 12.5 AUTHOR DETAILS