|
시장보고서
상품코드
1819106
트리아진 시장 예측(-2030년) : 유형(수용성, 유용성, 기상), 제품(MEA 트리아진, MMA 트리아진), 최종사용자 산업(원유, 천연가스, 지열 에너지, 산업 프로세스), 지역별Triazine Market by Type (Water Soluble, Oil Soluble, and Gas Phase), Product (MEA Triazine and MMA Triazine), End-use Industry (Crude Oil, Natural Gas, Geothermal Energy, and Industrial Processes), and Region - Global Forecast to 2030 |
||||||
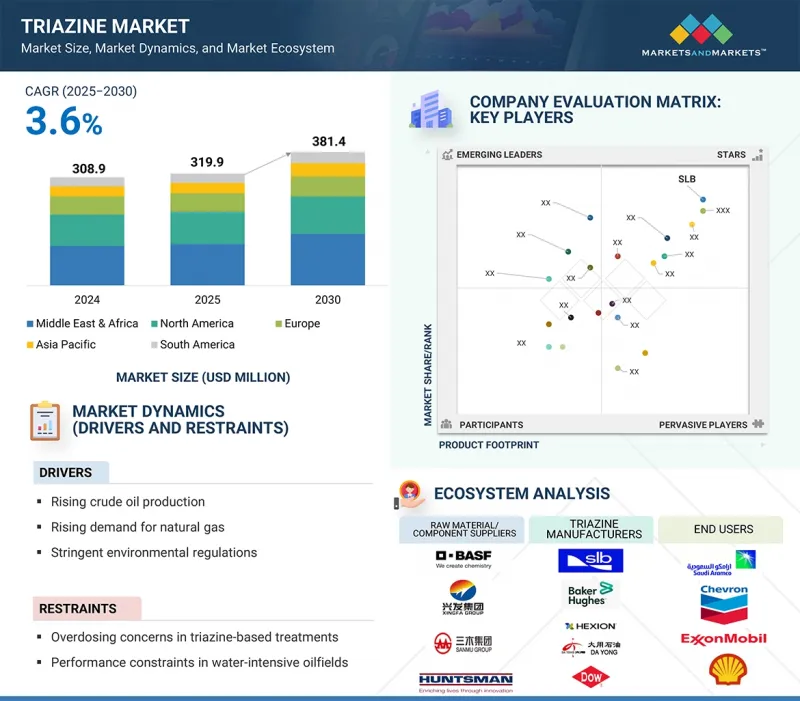
트리아진 시장 규모는 2025년 3억 1,990만 달러에서 예측 기간 중 CAGR 3.6%로 추이하며, 2030년에는 3억 8,140만 달러에 달할 것으로 예측됩니다.
| 조사 범위 | |
|---|---|
| 조사 대상연도 | 2023-2030년 |
| 기준연도 | 2024년 |
| 예측 기간 | 2025-2030년 |
| 단위 | 금액(달러)·킬로톤 |
| 부문 | 제품 유형, 최종사용자 산업, 지역 |
| 대상 지역 | 북미, 아시아태평양, 유럽, 중동 및 아프리카, 남미 |
효율적이고 신뢰할 수 있으며 다용도로 사용할 수 있는 H2S 스 캐빈저에 의존하는 산업이 늘어남에 따라 트리아진에 대한 수요는 꾸준히 증가할 것으로 예측됩니다. 석유 및 가스, 지열 에너지, 폐수 처리, 화학, 농업 분야에서 트리아진 화합물은 엄격한 안전, 환경 및 운영 기준을 충족시키면서 높은 성능을 발휘합니다. 미국 환경보호청(EPA), 유럽화학물질청(ECHA), 각 지역 환경당국 등 규제기관은 화학물질 관리, 배출, 환경영향에 대한 규제를 더욱 강화하고 있습니다. 각 제조업체들은 고순도, 환경 적합성, 특수 등급의 트리아진 제품을 제공함으로써 지속가능하고 안전한 산업 활동을 촉진하고 있습니다.

"제품별로는 MEA 트리아진이 2024년 가장 큰 점유율을 차지할 것입니다."
MEA 트리아진은 석유 및 가스 분야에서 H2S 스 캐빈저로 널리 사용되며, 2024년 주요 부문이 되었습니다. 이러한 장점은 MEA 트리아진의 비용 효율성, 황 화합물 제거 효과, 다양한 산업 용도에 대한 적응성을 통해 지원됩니다. 탄화수소 흐름의 안전성 향상과 부식 억제에 기여하는 이 화합물의 기능은 에너지 생산에 있으며, 적절한 선택으로 자리매김했습니다. 또한 수처리, 제약, 퍼스널케어 산업에서의 사용 증가로 시장 점유율이 크게 확대되었습니다. 엄격한 환경 기준 준수, 신흥 국가에서 수요 증가도 동화합물의 강력한 시장 실적을 지원하고 있습니다. 산업계가 안전, 환경 규제 준수, 비용 효율성을 점점 더 중요시하는 가운데, MEA 트리아진은 앞으로도 우위를 유지할 것으로 예측됩니다.
"최종사용자 산업별로는 원유 부문이 2024년 가장 큰 점유율을 차지할 것입니다."
이는 석유 및 가스 산업의 업스트림 및 미드스트림 공정에서 안전 확보, 설비 보호, 엄격한 환경 규제 준수에 트리아진 H2S 스 캐빈저가 광범위하게 사용되고 있는 것이 주요 요인입니다. 트리아진 화학제품은 정유소 흐름과 원유 및 천연가스에서 황화수소를 효과적으로 제거하여 부식 및 독성 가스 관련 위험을 방지합니다. 중동 및 아프리카의 주요 산유국인 사우디아라비아, UAE, 카타르에서는 대규모 업스트림 공정 및 정유 프로젝트가 진행되면서 수요가 크게 확대되었습니다. 2024년에는 사우디아라비아가 하루 922만 배럴(bpd), 최대 947만 bpd, UAE가 293만 bpd, 카타르가 174만 6,000bpd를 생산할 것으로 예상(출처: 미국 EIA). Saudi Aramco와 UAE의 Ministry of Energy and Infrastructure와 같은 규제기관은 스켄빈저의 효율적인 활용을 적극 지원하고 있습니다. 전 세계 원유 생산 및 가공 증가는 석유 산업에서 트리아진의 중요성을 더욱 높이고 있습니다.
"지역별로는 중동 및 아프리카가 2024년 시장을 독점한다."
이 지역은 석유 및 가스 사업 확장, 정유, 천연가스 처리, 폐수 관리 등의 산업 수요 증가로 인해 2024년 트리아진 시장을 주도할 것으로 예측됩니다. 사우디아라비아, UAE, 카타르, 남아프리카공화국 등 주요 거점들은 풍부한 원자재, 비용 효율적인 생산, 산업 성장을 가속하는 정부 지원을 활용했습니다. 업스트림 및 하류 석유 및 가스 사업의 성장과 대규모 인프라 투자를 위해서는 효율적인 가스 처리 화학제품이 필수적이며, 이는 시장 성장을 지원했습니다. 탄화수소 처리의 환경 규제와 안전 기준의 시행으로 고성능 트리아진계 H2S 스 캐빈저의 개발이 가속화되었습니다. 또한 유명한 화학업체들의 투자, 트리아진 합성 및 응용 기술 혁신, 효율성과 성능 향상을 위한 전략적 파트너십도 시장 확대에 기여했습니다. 에너지 집약적 산업과 자원 기반 화학 제조를 중시하는 이 지역의 태도는 세계 트리아진 시장에서의 우위를 확고히 했습니다.
세계의 트리아진 시장을 조사했으며, 시장 개요, 시장 성장에 대한 각종 영향요인의 분석, 기술·특허의 동향, 법규제 환경, 사례 연구, 시장 규모 추이·예측, 각종 구분·지역/주요 국가별 상세 분석, 경쟁 구도, 주요 기업의 개요 등을 정리하여 전해드립니다.
목차
제1장 서론
제2장 조사 방법
제3장 개요
제4장 주요 인사이트
제5장 시장 개요
- 시장 역학
- 촉진요인
- 억제요인
- 기회
- 과제
제6장 업계 동향
- 고객 사업에 영향을 미치는 동향/혼란
- 에코시스템 분석
- 밸류체인 분석
- 관세와 규제 상황
- 가격 분석
- 무역 분석
- 기술 분석
- 특허 분석
- 주요 컨퍼런스와 이벤트
- 사례 연구 분석
- 투자와 자금조달 시나리오
- 생성형 AI/AI가 트리아진 시장에 미치는 영향
- Porter's Five Forces 분석
- 주요 이해관계자와 구입 기준
- 거시경제 분석
- 2025년 미국 관세의 영향 트리아진 시장
제7장 트리아진 시장 : 유형별
- 수용성
- 유용성
- 기상
제8장 트리아진 시장 : 제품별
- MEA 트리아진
- MMA 트리아진
- 기타
제9장 트리아진 시장 : 최종사용자 산업별
- 원유
- 천연가스
- 지열 에너지
- 산업 프로세스
- 기타
제10장 트리아진 시장 : 지역별
- 중동 및 아프리카
- GCC 국가
- 남아프리카공화국
- 기타
- 북미
- 미국
- 캐나다
- 멕시코
- 유럽
- 독일
- 영국
- 프랑스
- 이탈리아
- 네덜란드
- 노르웨이
- 러시아
- 기타
- 아시아태평양
- 중국
- 인도
- 카자흐스탄
- 인도네시아
- 말레이시아
- 기타
- 남미
- 브라질
- 아르헨티나
- 베네수엘라
- 기타
제11장 경쟁 구도
- 개요
- 주요 기업의 전략
- 시장 점유율 분석
- 매출 분석
- 기업 평가와 재무 지표
- 제품/브랜드 비교
- 기업 평가 매트릭스 : 주요 기업
- 기업 평가 매트릭스 : 스타트업/중소기업
- 경쟁 시나리오
제12장 기업 개요
- 주요 기업
- SLB
- DOW
- BAKER HUGHES COMPANY
- HALLIBURTON
- CLARIANT
- ECOLAB INC
- LUBRIZOL
- DONGYING DAYONG PETROLEUM ADDITIVE CO., LTD.
- HEXION INC.
- SAUDI MULTICHEM COMPANY
- 기타 기업
- FOREMARK PERFORMANCE CHEMICALS
- DUBICHEM
- SINOTRUST CHEMICAL CO. LTD.
- Q2TECHNOLOGIES
- VENUS ETHOXYETHERS PVT. LTD.
- VINK CHEMICALS GMBH & CO. KG
- INTERNATIONAL CHEMICAL GROUP(ICG)
- TASFYEH GROUP INC.
- PURECHEM SERVICES
- SINTEZ OKA GROUP OF COMPANIES
- BERRYMAN CHEMICAL
- NOVAMEN INC.
- SUMMIT INTERNATIONAL
- IMPERIAL OILFIELD CHEMICALS PVT. LTD.
- MUBY CHEMICALS
제13장 인접 시장과 관련 시장
제14장 부록
KSA 25.10.01The triazine market is expected to reach USD 381.4 million by 2030 from USD 319.9 million in 2025, at a CAGR of 3.6% during the forecast period.
| Scope of the Report | |
|---|---|
| Years Considered for the Study | 2023-2030 |
| Base Year | 2024 |
| Forecast Period | 2025-2030 |
| Units Considered | Value (USD Million) and Volume (Kiloton) |
| Segments | Type, Product, End-use Industry, and Region |
| Regions covered | North America, Asia Pacific, Europe, the Middle East & Africa, and South America |
The demand for triazine is expected to grow steadily as multiple industries increasingly rely on efficient, reliable, and versatile H2S scavengers. In oil & gas, geothermal energy, wastewater treatment, chemical, and agricultural applications, triazine compounds meet strict safety, environmental, and operational standards while delivering high performance. Regulatory bodies, such as the US Environmental Protection Agency (EPA), European Chemicals Agency (ECHA), and regional environmental authorities, are implementing more stringent regulations for chemical management, emissions, and ecological consequences. Manufacturers are providing high-purity, ecologically compatible, and specialty-grade triazine products that promote sustainable and safe industrial operations.
Recent developments in the triazine sector have led to more advanced formulations, improved dosing methods, and enhanced access to process simulation tools. These innovations enable greater efficiency in hydrogen sulfide (H2S) scavenging, which reduces both the amount of chemicals needed and the environmental impact. Technologies such as real-time vent gas monitoring, along with simulation tools based on Visual Basic, allow operators to measure H2S levels in the vent and predict how triazine scavengers will perform in the process. This helps ensure effective scavenging and minimizes environmental risks. Additionally, the use of automated injection systems combined with predictive analyses further improves efficiency while ensuring compliance with operational standards.
"MEA triazine accounted for the largest share in the triazine market in 2024."
MEA triazine became the predominant segment in the worldwide triazine market in 2024, due to its extensive use as a hydrogen sulfide (H2S) scavenger in the oil & gas sector. This dominance is supported by MEA triazine's cost-efficiency, efficacy in eliminating sulfur compounds, and adaptability across diverse industrial applications. The compound's function in improving safety and inhibiting corrosion in hydrocarbon streams has established it as a suitable option in energy production. Moreover, the rising use of MEA triazine in water treatment, pharmaceuticals, and personal care industries has significantly enhanced its market share. The compound's compliance with rigorous environmental requirements and its increasing demand in emerging economies have bolstered its strong market performance. As industries increasingly emphasize safety, environmental compliance, and cost efficiency, MEA triazine is positioned to sustain its dominance in the triazine market in the coming years.
"Crude oil segment accounted for the largest share of the triazine market in 2024."
In 2024, the crude oil industry captured the largest share of the triazine market. This is primarily due to the broad applications of triazine H2S scavengers in ensuring safety, protecting equipment, and complying with stringent environmental regulations in the oil and gas industry's upstream and midstream processes. Triazine chemicals are highly effective in removing hydrogen sulfide from refinery streams, as well as from crude oil and natural gas, which helps prevent corrosion and the dangers associated with toxic gases. Key oil-producing nations in the Middle East & Africa, such as Saudi Arabia, the UAE, and Qatar, have significantly boosted demand through extensive upstream operations and refinery projects. In 2024, Saudi Arabia produced an average of 9.22 million barrels per day (bpd), reaching a peak of 9.47 million bpd. Meanwhile, the UAE and Qatar produced 2.93 million bpd and 1.746 million bpd, respectively (Source: US EIA). Regulatory agencies like Saudi Aramco and the UAE Ministry of Energy and Infrastructure actively support the efficient use of scavengers. The increase in crude oil production and processing worldwide continues to enhance the critical role of triazine in the petroleum industry.
"Middle East & Africa dominated the regional market for triazine in 2024."
The Middle East and Africa (MEA) region led the triazine market in 2024 because of quick industrial growth and strong oil and gas operations, together with rising industrial needs from petroleum refining, natural gas processing, and wastewater management. Major hubs such as Saudi Arabia, together with the UAE and Qatar, and South Africa, gained advantages from abundant raw materials, along with cost-effective production and government support for industrial growth. The growth of upstream and downstream oil and gas operations, along with major infrastructure investments, required efficient gas treatment chemicals for operations. The implementation of environmental compliance and safety regulations in hydrocarbon processing operations has contributed to the more rapid development of high-performance triazine-based H2S scavengers. Market expansion was further bolstered by investments from prominent chemical manufacturers, technological innovations in triazine synthesis and applications, and strategic partnerships aimed at improving efficiency and product performance. The region's emphasis on energy-intensive sectors and resource-based chemical manufacturing solidified its supremacy in the global triazine market.
In the process of determining and verifying the market size for several segments and subsegments identified through secondary research, extensive primary interviews were conducted. A breakdown of the profiles of the primary interviewees is as follows:
By Company Type: Tier 1: 25%, Tier 2: 42%, and Tier 3: 33%
By Designation: C-level Executives: 20%, Directors: 30%, and Other Designations: 50%
By Region: North America: 20%, Europe: 10%, Asia Pacific: 40%, South America: 10%, and the Middle East & Africa: 20%
Companies Covered: SLB (US), Dow (US), Baker Hughes Company (US), Halliburton (US), Clariant (Switzerland), Ecolab Inc. (US), Lubrizol (US), Dongying Dayong Petroleum Additive Co., Ltd. (China), Hexion Inc. (US), and Saudi Multichem Company (Saudi Arabia) are covered in the report.
The study includes an in-depth competitive analysis of these key players in the triazine market, with their company profiles, recent developments, and key market strategies.
Research Coverage
This research report categorizes the triazine market based on type (water soluble, oil soluble, and gas phase), product (MEA triazine, MMA triazine, and other products), end-use industry (crude oil, natural gas, geothermal energy, industrial processes, and other end-use industries), and Region (Asia Pacific, North America, Europe, South America, and the Middle East & Africa). The report's scope covers detailed information regarding the drivers, restraints, challenges, and opportunities influencing the growth of the triazine market. A detailed analysis of the key industry players has been done to provide insights into their business overview, products offered, and key strategies, such as partnerships, collaborations, mergers, acquisitions, and expansions, associated with the triazine market. This report covers a competitive analysis of upcoming startups in the triazine market ecosystem.
Reasons to Buy the Report
The report will offer the market leaders/new entrants with information on the closest approximations of the revenue numbers for the overall triazine market and the subsegments. This report will help stakeholders understand the competitive landscape, gain more insights into positioning their businesses better, and plan suitable go-to-market strategies. The report will help stakeholders understand the pulse of the market and provide them with information on key market drivers, restraints, challenges, and opportunities.
The report provides insights into the following points:
- Analysis of key drivers (rising crude oil production, rising demand for the natural gas industry, and stringent environmental regulations), restraints (overdosing concerns in triazine-based treatments and performance constraints in water-intensive oilfield), opportunities (rising oil & gas exploration activities, integration of smart monitoring and dosing technologies, and expanding role in biogas and wastewater treatment), and challenges (operational complexity in high-pressure and high-salinity conditions and rising competition from alternative H2S scavengers).
- Product Development/Innovation: Detailed insights into upcoming technologies, research & development activities, and product & service launches in the triazine market.
- Market Development: Comprehensive information about profitable markets - the report analyzes the triazine market across varied regions.
- Market Diversification: Exhaustive information about new products & services, untapped geographies, recent developments, and investments in the triazine market.
- Competitive Assessment: In-depth assessment of market shares, growth strategies, and service offerings of leading players such as SLB (US), Dow (US), Baker Hughes Company (US), Halliburton (US), Clariant (Switzerland), Ecolab Inc. (US), Lubrizol (US), Dongying Dayong Petroleum Additive Co., Ltd. (China), Hexion Inc. (US), and Saudi Multichem Company (Saudi Arabia).
TABLE OF CONTENTS
1 INTRODUCTION
- 1.1 STUDY OBJECTIVES
- 1.2 MARKET DEFINITION
- 1.3 STUDY SCOPE
- 1.3.1 MARKETS COVERED AND REGIONAL SCOPE
- 1.3.2 INCLUSIONS AND EXCLUSIONS OF STUDY
- 1.3.3 YEARS CONSIDERED
- 1.3.4 CURRENCY CONSIDERED
- 1.3.5 UNITS CONSIDERED
- 1.4 LIMITATIONS
- 1.5 STAKEHOLDERS
2 RESEARCH METHODOLOGY
- 2.1 RESEARCH DATA
- 2.1.1 SECONDARY DATA
- 2.1.1.1 Key data from secondary sources
- 2.1.2 PRIMARY DATA
- 2.1.2.1 Key data from primary sources
- 2.1.2.2 Key industry insights
- 2.1.1 SECONDARY DATA
- 2.2 MARKET SIZE ESTIMATION
- 2.3 BASE NUMBER CALCULATION
- 2.3.1 DEMAND-SIDE APPROACH
- 2.3.2 SUPPLY-SIDE APPROACH
- 2.4 MARKET FORECAST APPROACH
- 2.4.1 SUPPLY SIDE
- 2.4.2 DEMAND SIDE
- 2.5 DATA TRIANGULATION
- 2.6 FACTOR ANALYSIS
- 2.7 RESEARCH ASSUMPTIONS
- 2.8 RESEARCH LIMITATIONS AND RISK ASSESSMENT
3 EXECUTIVE SUMMARY
4 PREMIUM INSIGHTS
- 4.1 ATTRACTIVE OPPORTUNITIES FOR PLAYERS IN TRIAZINE MARKET
- 4.2 MIDDLE EAST & AFRICA: TRIAZINE MARKET, BY PRODUCT AND COUNTRY
- 4.3 TRIAZINE MARKET, BY TYPE
- 4.4 TRIAZINE MARKET, BY PRODUCT
- 4.5 TRIAZINE MARKET, BY END-USE INDUSTRY
- 4.6 TRIAZINE MARKET, BY COUNTRY
5 MARKET OVERVIEW
- 5.1 INTRODUCTION
- 5.2 MARKET DYNAMICS
- 5.2.1 DRIVERS
- 5.2.1.1 Rising crude oil production
- 5.2.1.2 Rising demand for natural gas
- 5.2.1.3 Stringent environmental regulations
- 5.2.2 RESTRAINTS
- 5.2.2.1 Overdosing concerns in triazine-based treatments
- 5.2.2.2 Performance constraints in water-intensive oilfields
- 5.2.3 OPPORTUNITIES
- 5.2.3.1 Rising oil & gas exploration activities
- 5.2.3.2 Integration of smart monitoring and dosing technologies
- 5.2.3.3 Expanding role in biogas and wastewater treatment
- 5.2.4 CHALLENGES
- 5.2.4.1 Operational complexity in high-pressure and high-salinity conditions
- 5.2.4.2 Rising competition from alternative H2S scavengers
- 5.2.1 DRIVERS
6 INDUSTRY TRENDS
- 6.1 TRENDS/DISRUPTIONS IMPACTING CUSTOMER'S BUSINESS
- 6.2 ECOSYSTEM ANALYSIS
- 6.3 VALUE CHAIN ANALYSIS
- 6.4 TARIFF AND REGULATORY LANDSCAPE
- 6.4.1 TARIFF ANALYSIS (HS CODE: 293369)
- 6.4.2 REGULATORY BODIES, GOVERNMENT AGENCIES, AND OTHER ORGANIZATIONS
- 6.4.3 KEY REGULATIONS
- 6.4.3.1 Toxic Substances Control Act (TSCA)
- 6.4.3.2 REACH Regulation (EC 1907/2006)
- 6.4.3.3 CLP Regulation (EC 1272/2008)
- 6.4.3.4 GSO ISO 11114-1:2012
- 6.4.3.5 China MEE Order No. 12
- 6.5 PRICING ANALYSIS
- 6.5.1.1 Average selling price of triazine, by product
- 6.5.1.2 Average selling price of triazine, by region
- 6.6 TRADE ANALYSIS
- 6.6.1 EXPORT SCENARIO (HS CODE 293369)
- 6.6.2 IMPORT SCENARIO (HS CODE 293369)
- 6.7 TECHNOLOGY ANALYSIS
- 6.7.1 KEY TECHNOLOGIES
- 6.7.1.1 Fourier transform infrared spectroscopy
- 6.7.1.2 Raman spectroscopy for MEA-triazine concentration analysis
- 6.7.1.3 Visual basic-based simulation
- 6.7.1.4 Claus process
- 6.7.2 COMPLEMENTARY TECHNOLOGIES
- 6.7.2.1 Encapsulation and controlled release technologies
- 6.7.2.2 Green chemistry and bio-based alternatives in triazine production
- 6.7.3 ADJACENT TECHNOLOGIES
- 6.7.3.1 Real-time vent gas monitoring
- 6.7.1 KEY TECHNOLOGIES
- 6.8 PATENT ANALYSIS
- 6.8.1 INTRODUCTION
- 6.8.2 METHODOLOGY
- 6.8.3 PATENT ANALYSIS, 2015-2024
- 6.9 KEY CONFERENCES AND EVENTS
- 6.10 CASE STUDY ANALYSIS
- 6.10.1 USE OF COMPUTATIONAL TOXICOLOGY MODELS TO PREDICT TOXICOLOGICAL POINTS OF DEPARTURE FOR TRIAZINE HERBICIDES
- 6.10.2 NATURAL GAS PROCESSING PLANT - H2S OPTIMIZATION PROGRAM
- 6.10.3 IMPROVING MEA-TRIAZINE SCAVENGER PERFORMANCE THROUGH ACCURATE TESTING
- 6.10.4 TRIAZINE HERBICIDES AND OVARIAN EPITHELIAL NEOPLASMS
- 6.11 INVESTMENT AND FUNDING SCENARIO
- 6.12 IMPACT OF GEN AI/AI ON TRIAZINE MARKET
- 6.13 PORTER'S FIVE FORCES ANALYSIS
- 6.13.1 THREAT OF NEW ENTRANTS
- 6.13.2 THREAT OF SUBSTITUTES
- 6.13.3 BARGAINING POWER OF SUPPLIERS
- 6.13.4 BARGAINING POWER OF BUYERS
- 6.13.5 INTENSITY OF COMPETITIVE RIVALRY
- 6.14 KEY STAKEHOLDERS AND BUYING CRITERIA
- 6.14.1 KEY STAKEHOLDERS IN BUYING PROCESS
- 6.14.2 BUYING CRITERIA
- 6.15 MACROECONOMIC ANALYSIS
- 6.15.1 INTRODUCTION
- 6.15.2 GDP TRENDS AND FORECASTS
- 6.16 IMPACT OF 2025 US TARIFF -TRIAZINE MARKET
- 6.16.1 INTRODUCTION
- 6.16.2 KEY TARIFF RATES
- 6.16.3 PRICE IMPACT ANALYSIS
- 6.16.4 IMPACT ON COUNTRY/REGION
- 6.16.4.1 US
- 6.16.4.2 China
- 6.16.4.3 India
- 6.16.5 IMPACT ON END-USE INDUSTRIES
7 TRIAZINE MARKET, BY TYPE
- 7.1 INTRODUCTION
- 7.2 WATER SOLUBLE
- 7.2.1 INCREASING INDUSTRIAL AND OFFSHORE APPLICATIONS TO FUEL DEMAND
- 7.3 OIL SOLUBLE
- 7.3.1 RISING CRUDE OIL PRODUCTION AND GAS DEMAND TO FUEL MARKET
- 7.4 GAS PHASE
- 7.4.1 ENHANCED SAFETY AND INFRASTRUCTURE PROTECTION TO FUEL DEMAND
8 TRIAZINE MARKET, BY PRODUCT
- 8.1 INTRODUCTION
- 8.2 MEA TRIAZINE
- 8.2.1 REDUCTION IN OPERATIONAL COSTS TO DRIVE MARKET
- 8.3 MMA TRIAZINE
- 8.3.1 RAPID REACTIVITY AND BROAD INDUSTRIAL APPLICABILITY TO PROPEL ADOPTION
- 8.4 OTHER PRODUCTS
9 TRIAZINE MARKET, BY END-USE INDUSTRY
- 9.1 INTRODUCTION
- 9.2 CRUDE OIL
- 9.2.1 GROWING CRUDE OIL OPERATIONS TO FUEL USAGE
- 9.3 NATURAL GAS
- 9.3.1 INCREASING GLOBAL GAS SUPPLY TO DRIVE DEMAND
- 9.4 GEOTHERMAL ENERGY
- 9.4.1 TECHNOLOGICAL ADVANCEMENTS TO SUPPORT ADOPTION
- 9.5 INDUSTRIAL PROCESSES
- 9.5.1 EXPANDING INDUSTRIAL APPLICATIONS TO DRIVE DEMAND
- 9.6 OTHER END-USE INDUSTRIES
10 TRIAZINE MARKET, BY REGION
- 10.1 INTRODUCTION
- 10.2 MIDDLE EAST & AFRICA
- 10.2.1 GCC COUNTRIES
- 10.2.1.1 Saudi Arabia
- 10.2.1.1.1 Hydrocarbon expansion to fuel market growth
- 10.2.1.2 UAE
- 10.2.1.2.1 Upstream expansion and sour gas projects to drive demand
- 10.2.1.3 Qatar
- 10.2.1.3.1 LNG expansion projects to propel market
- 10.2.1.4 Rest of GCC Countries
- 10.2.1.1 Saudi Arabia
- 10.2.2 SOUTH AFRICA
- 10.2.2.1 Exploration investments and gas field developments to propel market
- 10.2.3 REST OF MIDDLE EAST & AFRICA
- 10.2.1 GCC COUNTRIES
- 10.3 NORTH AMERICA
- 10.3.1 US
- 10.3.1.1 High production activity and stringent regulations to drive demand
- 10.3.2 CANADA
- 10.3.2.1 Heavy crude exports to drive demand
- 10.3.3 MEXICO
- 10.3.3.1 Rising offshore crude oil production to drive market
- 10.3.1 US
- 10.4 EUROPE
- 10.4.1 GERMANY
- 10.4.1.1 Growing reliance on sour hydrocarbon imports to drive market
- 10.4.2 UK
- 10.4.2.1 Offshore expansion and regulatory pressure to drive demand
- 10.4.3 FRANCE
- 10.4.3.1 Stringent regulations and expanding energy infrastructure to fuel demand
- 10.4.4 ITALY
- 10.4.4.1 Growing crude exports to drive demand
- 10.4.5 NETHERLANDS
- 10.4.5.1 Expanding refining activity to drive market
- 10.4.6 NORWAY
- 10.4.6.1 Rise in natural gas production to support market growth
- 10.4.7 RUSSIA
- 10.4.7.1 Sustained hydrocarbon output and expanding exports to fuel demand
- 10.4.8 REST OF EUROPE
- 10.4.1 GERMANY
- 10.5 ASIA PACIFIC
- 10.5.1 CHINA
- 10.5.1.1 Production expansion and regulatory push to propel demand
- 10.5.2 INDIA
- 10.5.2.1 Expanding domestic exploration and offshore developments to boost demand
- 10.5.3 KAZAKHSTAN
- 10.5.3.1 Expanding oil & gas production to drive demand
- 10.5.4 INDONESIA
- 10.5.4.1 Upstream investments, high-sulfur output, and regulatory standards to boost demand
- 10.5.5 MALAYSIA
- 10.5.5.1 Upstream expansion and offshore projects to propel demand
- 10.5.6 REST OF ASIA PACIFIC
- 10.5.1 CHINA
- 10.6 SOUTH AMERICA
- 10.6.1 BRAZIL
- 10.6.1.1 Offshore expansion and rising production to boost demand
- 10.6.2 ARGENTINA
- 10.6.2.1 Surging production and exports to propel triazine adoption
- 10.6.3 VENEZUELA
- 10.6.3.1 Reinvestments by market players in oil production to propel demand
- 10.6.4 REST OF SOUTH AMERICA
- 10.6.1 BRAZIL
11 COMPETITIVE LANDSCAPE
- 11.1 OVERVIEW
- 11.2 KEY PLAYER STRATEGIES
- 11.3 MARKET SHARE ANALYSIS
- 11.4 REVENUE ANALYSIS
- 11.5 COMPANY VALUATION AND FINANCIAL METRICS
- 11.6 PRODUCT/BRAND COMPARISON
- 11.7 COMPANY EVALUATION MATRIX: KEY PLAYERS, 2024
- 11.7.1 STARS
- 11.7.2 EMERGING LEADERS
- 11.7.3 PERVASIVE PLAYERS
- 11.7.4 PARTICIPANTS
- 11.7.5 COMPANY FOOTPRINT: KEY PLAYERS, 2024
- 11.7.5.1 Company footprint
- 11.7.5.2 Regional footprint
- 11.7.5.3 Type footprint
- 11.7.5.4 Product footprint
- 11.7.5.5 End-use industry footprint
- 11.8 COMPANY EVALUATION MATRIX: STARTUPS/SMES, 2024
- 11.8.1 PROGRESSIVE COMPANIES
- 11.8.2 RESPONSIVE COMPANIES
- 11.8.3 DYNAMIC COMPANIES
- 11.8.4 STARTING BLOCKS
- 11.8.5 COMPETITIVE BENCHMARKING: STARTUPS/SMES, 2024
- 11.8.5.1 Detailed list of key startups/SMEs
- 11.8.5.2 Competitive benchmarking of key startups/SMEs
- 11.9 COMPETITIVE SCENARIO
- 11.9.1 DEALS
- 11.9.2 EXPANSIONS
12 COMPANY PROFILES
- 12.1 KEY PLAYERS
- 12.1.1 SLB
- 12.1.1.1 Business overview
- 12.1.1.2 Products offered
- 12.1.1.3 Recent developments
- 12.1.1.3.1 Deals
- 12.1.1.3.2 Expansions
- 12.1.1.4 MnM view
- 12.1.1.4.1 Key strengths
- 12.1.1.4.2 Strategic choices
- 12.1.1.4.3 Weaknesses & competitive threats
- 12.1.2 DOW
- 12.1.2.1 Business overview
- 12.1.2.2 Products offered
- 12.1.2.3 Recent developments
- 12.1.2.3.1 Deals
- 12.1.2.4 MnM view
- 12.1.2.4.1 Key strengths
- 12.1.2.4.2 Strategic choices
- 12.1.2.4.3 Weaknesses & competitive threats
- 12.1.3 BAKER HUGHES COMPANY
- 12.1.3.1 Business overview
- 12.1.3.2 Products offered
- 12.1.3.3 Recent developments
- 12.1.3.3.1 Deals
- 12.1.3.3.2 Expansions
- 12.1.3.4 MnM view
- 12.1.3.4.1 Key strengths
- 12.1.3.4.2 Strategic choices
- 12.1.3.4.3 Weaknesses & competitive threats
- 12.1.4 HALLIBURTON
- 12.1.4.1 Business overview
- 12.1.4.2 Products offered
- 12.1.4.3 Recent developments
- 12.1.4.3.1 Deals
- 12.1.4.3.2 Expansions
- 12.1.4.4 MnM view
- 12.1.4.4.1 Key strengths
- 12.1.4.4.2 Strategic choices
- 12.1.4.4.3 Weaknesses & competitive threats
- 12.1.5 CLARIANT
- 12.1.5.1 Business overview
- 12.1.5.2 Products offered
- 12.1.5.3 Recent developments
- 12.1.5.3.1 Deals
- 12.1.5.3.2 Expansions
- 12.1.5.4 MnM view
- 12.1.5.4.1 Key strengths
- 12.1.5.4.2 Strategic choices
- 12.1.5.4.3 Weaknesses & competitive threats
- 12.1.6 ECOLAB INC
- 12.1.6.1 Business overview
- 12.1.6.2 Products offered
- 12.1.6.3 MnM view
- 12.1.7 LUBRIZOL
- 12.1.7.1 Business overview
- 12.1.7.2 Products offered
- 12.1.7.3 Recent developments
- 12.1.7.3.1 Expansions
- 12.1.7.4 MnM view
- 12.1.8 DONGYING DAYONG PETROLEUM ADDITIVE CO., LTD.
- 12.1.8.1 Business overview
- 12.1.8.2 Products offered
- 12.1.8.3 MnM view
- 12.1.9 HEXION INC.
- 12.1.9.1 Business overview
- 12.1.9.2 Products offered
- 12.1.9.3 Recent developments
- 12.1.9.3.1 Expansions
- 12.1.9.4 MnM view
- 12.1.10 SAUDI MULTICHEM COMPANY
- 12.1.10.1 Business overview
- 12.1.10.2 Products offered
- 12.1.10.3 Recent developments
- 12.1.10.3.1 Expansions
- 12.1.10.4 MnM view
- 12.1.1 SLB
- 12.2 OTHER PLAYERS
- 12.2.1 FOREMARK PERFORMANCE CHEMICALS
- 12.2.2 DUBICHEM
- 12.2.3 SINOTRUST CHEMICAL CO. LTD.
- 12.2.4 Q2TECHNOLOGIES
- 12.2.5 VENUS ETHOXYETHERS PVT. LTD.
- 12.2.6 VINK CHEMICALS GMBH & CO. KG
- 12.2.7 INTERNATIONAL CHEMICAL GROUP (ICG)
- 12.2.8 TASFYEH GROUP INC.
- 12.2.9 PURECHEM SERVICES
- 12.2.10 SINTEZ OKA GROUP OF COMPANIES
- 12.2.11 BERRYMAN CHEMICAL
- 12.2.12 NOVAMEN INC.
- 12.2.13 SUMMIT INTERNATIONAL
- 12.2.14 IMPERIAL OILFIELD CHEMICALS PVT. LTD.
- 12.2.15 MUBY CHEMICALS
13 ADJACENT & RELATED MARKET
- 13.1 INTRODUCTION
- 13.2 LIMITATIONS
- 13.2.1 HYDROGEN SULFIDE SCAVENGERS MARKET
- 13.2.1.1 Market definition
- 13.2.1.2 Hydrogen sulfide scavengers market, by type
- 13.2.1.3 Hydrogen sulfide scavengers market, by chemistry
- 13.2.1.4 Hydrogen sulfide scavengers market, by end use
- 13.2.1.5 Hydrogen sulfide scavengers market, by region
- 13.2.1 HYDROGEN SULFIDE SCAVENGERS MARKET
14 APPENDIX
- 14.1 DISCUSSION GUIDE
- 14.2 KNOWLEDGESTORE: MARKETSANDMARKETS' SUBSCRIPTION PORTAL
- 14.3 CUSTOMIZATION OPTIONS
- 14.4 RELATED REPORTS
- 14.5 AUTHOR DETAILS
