|
시장보고서
상품코드
1961001
동물용 영상 진단 시장 예측(-2031년) : 오퍼링별, 모달리티별, 딜리버리 모드별, 용도별, 동물 유형별, 최종사용자별, 지역별Veterinary Imaging Market by Product (CT, MRI, Imaging Systems, Imaging Reagents, Imaging Software, Accessories), Animal Type (Small, Large), Application (Oncology, Dentistry), Modality (Portable, Stationary), End User, Region - Global Forecast to 2031 |
||||||
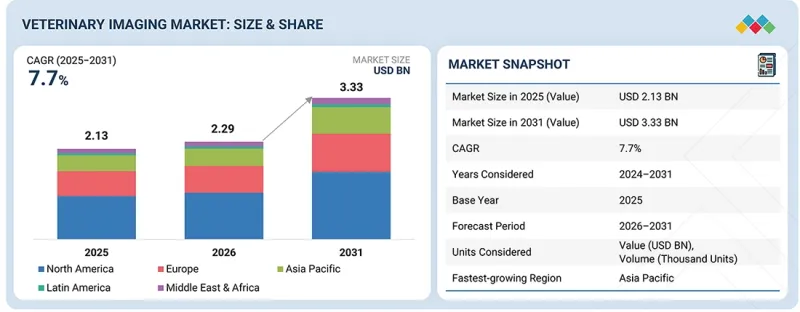
동물용 영상 진단 시장 규모는 2026년 22억 9,900만 달러에서 2031년까지 33억 3,200만 달러에 달할 것으로 예측되고 있으며, 예측 기간 중 CAGR 7.7%로 성장합니다.
이러한 성장은 동물용 진단, 임상적 의사결정, 동물 의료의 미래를 형성하는 몇 가지 주요 요인에 의해 주도되고 있습니다.
| 조사 범위 | |
|---|---|
| 조사 대상 기간 | 2024-2031년 |
| 기준연도 | 2025년 |
| 예측 기간 | 2026-2031년 |
| 대상 단위 | 금액(10억 달러) |
| 부문 | 오퍼링별, 모달리티별, 딜리버리 모드별, 용도별, 동물 유형별, 최종사용자별, 지역별 |
| 대상 지역 | 북미, 유럽, 아시아태평양, 라틴아메리카, 중동 및 아프리카 |
이러한 성장의 주요 요인은 반려동물의 보급률 증가와 질병의 조기 발견 및 치료를 지원하는 첨단 진단 툴에 대한 수요 증가에 기인합니다. 반려동물 사육 수와 동물의료비 증가에 따라 동물병원에서는 진단의 정확성을 높이고 적시에 임상적 개입을 가능하게 하기 위해 초음파 검사, 디지털 엑스레이 촬영, 컴퓨터 단층촬영(CT), 자기공명영상법(MRI) 등의 영상 진단장비를 도입하고 있습니다.
또한 동물의 정형외과 질환, 암, 치과 질환, 만성질환의 부담이 증가함에 따라 고해상도 영상 진단 솔루션에 대한 수요가 증가하고 있습니다. 수의사들이 보다 정밀하고 비용 효율적이며 확장 가능한 진단 툴을 찾는 가운데, 콘빔 CT, 투시 촬영, 저자기장 MRI와 같은 고급 모달리티가 주목받고 있습니다. PACS 및 원격 방사선 진단 플랫폼을 포함한 디지털 워크플로우로의 전환은 이미지 저장의 개선, 원격 진단의 실현, 전자 건강 기록과의 통합을 통해 시장 확대를 가속화하고 있습니다.
AI를 활용한 영상분석, 휴대용 영상 진단기기, 클라우드 기반 소프트웨어 등의 기술 혁신이 시장의 성장을 촉진하고 있습니다. 이러한 발전으로 진단 효율성, 접근성, 사용 편의성이 향상되어 대형 병원부터 소규모 독립 진료소까지 다양한 수의 의료 현장에서 첨단 영상 진단 솔루션의 실용성이 확대되고 있습니다.
전반적으로 반려동물 의료비 증가, 영상기술의 발전, 정확하고 빠른 진단에 대한 중요성 증가가 동물용 영상 진단 시장의 강력한 성장을 촉진하고 있습니다.
제품 세분화 내에서 동물용 영상 진단 시장은 영상 진단 기기, 영상 진단 시약, 동물용 영상 진단 소프트웨어로 구성되어 있습니다. 이 중 동물용 영상 진단 소프트웨어는 2025년 가장 빠르게 성장한 카테고리였습니다. 이 부문의 성장은 자동 질병 감지를 위한 AI 기반 분석, 원격 진료와 원활한 협업을 가능하게 하는 클라우드 기반 플랫폼, 진단을 명확히 하고 수술 계획을 강화하는 고급 3D 시각화 툴에 의해 주도되고 있습니다. 반려동물 보호자, 보험사, 수의사 등 반려동물 관련 종사자들의 보다 신속하고 정확한 진단 정보에 대한 수요 증가로 인해 통합 영상 진단 생태계 도입이 가속화되고 있습니다. 수의 의료현장에서 워크플로우 효율성, 진단 정확도, 치료 성과 향상을 위해 노력하는 가운데, 원격 방사선 진단 접근, 자동 영상 분석, 실시간 환자 모니터링을 제공하는 솔루션이 큰 주목을 받고 있습니다.
2025년에는 전 세계 반려동물 수 증가, 반려동물 보험의 보급 확대, 저침습적이고 정확한 진단 절차에 대한 수요 증가를 배경으로 소동물이 가장 큰 시장 점유율을 차지할 것으로 예측됩니다. 소형 휴대용 초음파 장비는 진단 영상에 대한 접근성을 확대하는 한편, AI 기반 툴은 진단 정확도와 워크플로우 효율성을 향상시키고 있습니다.
클라우드 기반의 원격 방사선 진단 플랫폼과 영상 공유 툴을 통해 수의사는 전문의와 협업이 가능해져 의료서비스가 충분하지 않은 지역이나 원격지에서도 첨단 진단을 쉽게 이용할 수 있게 되었습니다. 또한 저선량 CT 및 MRI 솔루션의 발전으로 방사선 피폭량이 감소하여 동물의 안전과 복지에 대한 관심이 높아지는 추세에 발맞추어, 동물의 안전과 복지에 대한 관심이 높아지고 있습니다. 모바일 영상 진단 서비스, AI 기반 플랫폼, 클라우드 기반 데이터 관리 시스템을 제공하는 기업은 정확하고 편리하며 반려동물 친화적인 영상 진단 솔루션에 대한 수요 증가를 활용할 수 있는 좋은 위치에 있습니다.
예측 기간 중 아시아태평양은 가장 빠른 속도로 성장할 것으로 예측됩니다. 이러한 성장을 이끄는 주요 요인으로는 반려동물 사육률 증가, 가처분 소득 증가, 수의학 인프라 확충, 첨단 수의학 기술에 대한 지역 및 세계 기업의 투자 확대 등이 있습니다.
또한 이 지역에서는 동물 건강에 대한 인식이 높아지고, 반려동물 보험의 적용 범위가 확대되며, 전문 동물병원 및 진료소가 급속히 증가하고 있습니다. 이러한 요인들이 복합적으로 작용하여 아시아태평양 국가들에서 첨단 영상 진단 시스템에 대한 강력한 수요를 촉진할 것으로 예측됩니다.
이 보고서는 다음 사항에 대한 인사이트을 제공
- 주요 촉진요인(반려동물 인구 증가, 질병 부담 증가, 예방/조기 진단 수요, 비침습적/고정밀/신속한 진단법 수요, 진단/임상 의사결정 지원에서 AI/ML의 급격한 증가), 억제요인(동물용 영상 진단 장비의 고비용, 반려동물 진료비 증가 추세), 기회(미개발 신흥 시장), 과제(동물병원 현장의 높은 자본 및 예산 제약, 숙련되고 훈련된 수의영상 기술자 부족)(수의학 현장의 높은 자본 비용과 예산 제약, 숙련된 수의 방사선사 및 훈련된 영상 기술자 부족) 분석
- 제품 개발 및 혁신 : 동물용 영상 진단 시장의 향후 기술 동향 및 제품 출시에 대한 심층 분석
- 시장 개발: 수익성 높은 신흥 시장에 대한 종합적인 정보. 이 보고서에서는 지역별 다양한 유형의 동물용 영상 진단 제품 시장을 분석합니다.
- 시장 다각화 : 바이오칩 시장의 제품, 미개발 지역, 최근 동향, 투자에 관한 종합적인 정보
- 경쟁사 평가: 동물용 영상 진단 시장내 주요 기업 시장 점유율, 전략, 제품, 유통망, 제조능력에 대한 상세 평가
자주 묻는 질문
목차
제1장 서론
제2장 개요
제3장 주요 인사이트
제4장 시장 개요
제5장 업계 동향
제6장 규제 상황과 지속가능성 구상
제7장 기술의 진보, AI에 의한 영향, 특허, 혁신, 향후 응용
제8장 고객 상황과 구매 행동
제9장 동물용 영상 진단 시장, 제공별
제10장 동물용 영상 진단 기기 시장(모달리티별)
제11장 동물용 영상 진단 처리 소프트웨어 시장(딜리버리 모드별)
제12장 동물용 영상 진단 시장(용도별)
제13장 동물용 영상 진단 시장(동물 유형별)
제14장 동물용 영상 진단 시장(최종사용자별)
제15장 동물용 영상 진단 시장(지역별)
제16장 경쟁 구도
제17장 기업 개요
제18장 조사 방법
제19장 부록
KSA 26.03.20The veterinary imaging market is projected to reach USD 3.332 billion by 2031, up from USD 2.299 billion in 2026, growing at a CAGR of 7.7% over the forecast period. This growth is driven by several key factors shaping the future of veterinary diagnostics, clinical decision-making, and animal healthcare.
| Scope of the Report | |
|---|---|
| Years Considered for the Study | 2024-2031 |
| Base Year | 2025 |
| Forecast Period | 2026-2031 |
| Units Considered | Value (USD billion) |
| Segments | By Product, Modality, Delivery Mode, Application, Animal Type, End User, Region |
| Regions covered | North America, Europe, APAC, Latin America, Middle East & Africa |

A major driver of this growth is the rising prevalence of companion animals and demand for advanced diagnostic tools that support early disease detection and treatment. As pet ownership and spending on animal health rise, veterinary clinics and hospitals are adopting imaging modalities such as ultrasound, digital radiography, computed tomography (CT), and magnetic resonance imaging (MRI) to improve diagnostic accuracy and enable timely clinical interventions.
Additionally, the rising burden of orthopedic disorders, cancer, dental conditions, and chronic diseases in animals is increasing demand for high-resolution imaging solutions. Advanced modalities, including cone-beam CT, fluoroscopy, and low-field MRI, are gaining traction as veterinarians seek more precise, cost-effective, and scalable diagnostic tools. The shift toward digital workflows, including PACS and teleradiology platforms, is accelerating market expansion by improving image storage, enabling remote diagnostics, and integrating with electronic health records.
Technological innovations, including AI-enabled image analysis, portable imaging devices, and cloud-based software, are further driving market growth. These advances enhance diagnostic efficiency, accessibility, and usability, making advanced imaging solutions more practical across diverse veterinary settings, from large hospitals to small independent clinics.
Overall, rising pet healthcare spending, advances in imaging technologies, and a growing emphasis on accurate, early diagnosis are driving strong growth in the veterinary imaging market.
"The veterinary imaging software segment is expected to record the fastest growth by product type during the forecast period."
Within product segmentation, the veterinary imaging market comprises imaging instruments, imaging reagents, and veterinary imaging software. Among these, veterinary imaging software was the fastest-growing category in 2025. Growth in this segment is driven by AI-enabled analytics for automated disease detection, cloud-based platforms for remote consultations and seamless collaboration, and advanced 3D visualization tools that enhance diagnostic clarity and surgical planning. Rising demand from pet owners, insurance providers, and veterinary clinicians for faster, more accurate diagnostic insights continues to accelerate adoption of integrated imaging ecosystems. Solutions offering tele-radiology access, automated image analysis, and real-time patient monitoring are gaining strong traction as veterinary practices seek to improve workflow efficiency, diagnostic accuracy, and treatment outcomes.
The small animals segment represents the largest share of the veterinary imaging market by animal type.
In 2025, small animals accounted for the largest share of the market, driven by the rising global pet population, growing adoption of pet insurance, and increasing demand for minimally invasive, accurate diagnostic procedures. Compact, portable ultrasound devices have broadened access to diagnostic imaging, while AI-powered tools are improving diagnostic precision and workflow efficiency.
Cloud-based teleradiology platforms and remote image-sharing tools also enable veterinarians to connect with specialists, making advanced diagnostics more accessible in underserved or remote areas. Furthermore, advances in low-dose CT and MRI solutions are reducing radiation exposure, aligning with the growing emphasis on animal safety and welfare. Companies offering mobile imaging services, AI-enabled platforms, and cloud-based data management systems are well-positioned to capitalize on this expanding demand for accurate, convenient, and pet-friendly imaging solutions.
"Asia Pacific is expected to witness the fastest growth during the forecast period."
During the forecast period, the Asia Pacific region is expected to grow at the fastest pace. Key factors fuelling this growth include rising ownership of companion animals, increasing disposable income, expanding veterinary care infrastructure, and growing investment by regional and global players in advanced veterinary technologies.
The region is also seeing growing awareness of animal health, expanded insurance coverage for pets, and rapid growth in veterinary specialty hospitals and clinics. Collectively, these factors are expected to drive strong demand for advanced imaging systems across countries in the Asia Pacific region.
Breakdown of supply-side primary interviews:
- By Company Type: Tier 1 (45%), Tier 2 (20%), and Tier 3 (35%)
- By Designation: C-level Executives (35%), Directors (25%), and Other Designations (40%)
- By Region: North America (40%), Europe (25%), Asia Pacific (20%), Latin America (10%), Middle East & Africa (5%)
Breakdown of demand-side primary interviews:
- By End User: Veterinary Hospitals And Clinics (45%), Veterinary Diagnostic Imaging Centers (30%), Academic & Research Institutions (20%), and Other End Users (5%)
By Designation: Laboratory Managers / Heads (47%), Clinical Diagnostics Managers (22%), Genomics / Research Scientists (15%), and Others (16%)
- By Region: North America (25%), Europe (24%), Asia Pacific (25%), Latin America (11%), Middle East & Africa (15%)
Research Coverage
The market study covers the veterinary imaging market across multiple segments. It aims to estimate the market size and growth potential by product, animal type, modality, delivery mode, application, end user, and region. The study also includes an in-depth competitive analysis of the key players in the market, along with their company profiles, key observations on their products and business offerings, recent developments, and key market strategies.
Reasons to Buy the Report
The report can help established companies and newer or smaller firms understand market trends, enabling them to capture a larger share of the market. Firms that acquire the report can implement one or more of the five strategies outlined below.
This report provides insights into the following points:
- Analysis of key drivers (growth in companion animal population, higher disease burden, preventive/early diagnostics, demand for non-invasive, accurate, rapid diagnostics, surge of AI/ML in diagnostics & clinical decision support), restraints (high cost of veterinary imaging instruments, rising rate of pet care costs), opportunities (untapped emerging markets), and challenges (high capital cost and budget limitations in veterinary practices, shortage of skilled veterinary radiologists and trained imaging technicians)
- Product Development/Innovation: Detailed insights on upcoming technologies and product launches in veterinary imaging market
- Market Development: Comprehensive information about lucrative emerging markets; the report analyzes the markets for various types of veterinary imaging products across regions.
- Market Diversification: Exhaustive information about products, untapped regions, recent developments, and investments in the biochips market
- Competitive Assessment: In-depth assessment of market share, strategies, products, distribution networks, and manufacturing capabilities of the leading players in the veterinary imaging market
TABLE OF CONTENTS
1 INTRODUCTION
- 1.1 STUDY OBJECTIVES
- 1.2 MARKET DEFINITION
- 1.3 MARKET SCOPE
- 1.3.1 MARKET SEGMENTATION AND REGIONS COVERED
- 1.3.2 INCLUSIONS AND EXCLUSIONS
- 1.3.3 YEARS CONSIDERED
- 1.3.4 CURRENCY CONSIDERED
- 1.3.5 UNITS CONSIDERED
- 1.4 STAKEHOLDERS
- 1.5 SUMMARY OF CHANGES
2 EXECUTIVE SUMMARY
- 2.1 MARKET HIGHLIGHTS AND KEY INSIGHTS
- 2.2 KEY MARKET PARTICIPANTS: MAPPING OF STRATEGIC DEVELOPMENTS
- 2.3 DISRUPTIVE TRENDS IN VETERINARY IMAGING MARKET
- 2.4 HIGH-GROWTH SEGMENTS
- 2.5 REGIONAL SNAPSHOT: MARKET SIZE, GROWTH RATE, AND FORECAST
3 PREMIUM INSIGHTS
- 3.1 VETERINARY IMAGING MARKET OVERVIEW
- 3.2 ASIA PACIFIC: VETERINARY IMAGING MARKET, BY OFFERING & COUNTRY (2025)
- 3.3 VETERINARY IMAGING MARKET: REGIONAL MIX
- 3.4 VETERINARY IMAGING MARKET: GEOGRAPHIC GROWTH OPPORTUNITIES
- 3.5 VETERINARY IMAGING MARKET: DEVELOPED MARKETS VS. EMERGING ECONOMIES
4 MARKET OVERVIEW
- 4.1 INTRODUCTION
- 4.2 MARKET DYNAMICS
- 4.2.1 DRIVERS
- 4.2.1.1 Growth in companion animal population
- 4.2.1.2 Higher disease burden, preventive/early diagnostics, and demand for non-invasive, accurate, rapid diagnostics
- 4.2.1.3 Surge of AI/ML in diagnostics & clinical decision support
- 4.2.1.4 Growth in animal health spending
- 4.2.2 RESTRAINTS
- 4.2.2.1 High cost of veterinary imaging instruments
- 4.2.2.2 Rising cost of pet care
- 4.2.3 OPPORTUNITIES
- 4.2.3.1 Growth potential of emerging economies
- 4.2.4 CHALLENGES
- 4.2.4.1 High capital cost and budget limitations in veterinary practices
- 4.2.4.2 Shortage of skilled veterinary radiologists and trained imaging technicians
- 4.2.1 DRIVERS
- 4.3 UNMET NEEDS & WHITE SPACES
- 4.3.1 UNMET NEEDS IN VETERINARY CONTRACT MANUFACTURING & RESEARCH MARKET
- 4.3.2 WHITE SPACE OPPORTUNITIES
- 4.4 INTERCONNECTED MARKETS & CROSS-SECTOR OPPORTUNITIES
- 4.4.1 INTERCONNECTED MARKETS
- 4.4.2 CROSS-SECTOR OPPORTUNITIES
- 4.5 STRATEGIC MOVES BY TIER-1/2/3 PLAYERS
- 4.5.1 UNMET NEEDS IN VETERINARY CONTRACT MANUFACTURING & RESEARCH MARKET
5 INDUSTRY TRENDS
- 5.1 PORTER'S FIVE FORCES ANALYSIS
- 5.1.1 THREAT OF SUBSTITUTES
- 5.1.2 THREAT OF NEW ENTRANTS
- 5.1.3 BARGAINING POWER OF SUPPLIERS
- 5.1.4 BARGAINING POWER OF BUYERS
- 5.1.5 INTENSITY OF COMPETITIVE RIVALRY
- 5.2 MACROECONOMIC INDICATORS
- 5.2.1 INTRODUCTION
- 5.2.2 GDP TRENDS & FORECAST
- 5.2.3 TRENDS IN GLOBAL HEALTHCARE INDUSTRY
- 5.2.4 TRENDS IN GLOBAL ANIMAL HEALTH INDUSTRY
- 5.3 VALUE CHAIN ANALYSIS
- 5.4 ECOSYSTEM ANALYSIS
- 5.5 PRICING ANALYSIS
- 5.5.1 AVERAGE SELLING PRICE TREND, BY KEY PLAYER, 2023-2025
- 5.5.2 AVERAGE SELLING PRICE TREND, BY REGION, 2023-2025
- 5.5.2.1 Radiography systems/instruments
- 5.5.2.2 Veterinary contrast reagents
- 5.5.2.3 Veterinary imaging software
- 5.5.2.4 Ultrasound probes (veterinary imaging accessories)
- 5.6 TRADE ANALYSIS
- 5.6.1 TRADE DATA FOR HS CODE 9018
- 5.6.1.1 Import data for HS Code 9018
- 5.6.1.2 Export data for HS Code 9018
- 5.6.2 TRADE DATA FOR HS CODE 9022
- 5.6.2.1 Import data for HS Code 9022
- 5.6.2.2 Export data for HS Code 9022
- 5.6.1 TRADE DATA FOR HS CODE 9018
- 5.7 KEY CONFERENCES & EVENTS, 2025-2026
- 5.8 TRENDS/DISRUPTIONS IMPACTING CUSTOMERS' BUSINESSES
- 5.9 INVESTMENT & FUNDING SCENARIO
- 5.10 SUCCESS STORIES & REAL-WORLD APPLICATIONS
- 5.10.1 CASE STUDY 1: IMPROVING DIAGNOSTIC CAPABILITY & MRI ACCESSIBILITY USING HALLMARQ 1.5T SMALL-ANIMAL MRI
- 5.10.2 CASE STUDY 2: AI-ASSISTED RADIOGRAPH INTERPRETATION TO IMPROVE URGENT-CARE DIAGNOSTICS
- 5.10.3 CASE STUDY 3: PORTABLE ULTRASOUND FOR EXOTIC SPECIES AT DENVER ZOO (E.I. MEDICAL IMAGING)
- 5.11 IMPACT OF 2025 US TARIFFS-VETERINARY IMAGING MARKET
- 5.11.1 INTRODUCTION
- 5.11.2 KEY TARIFF RATES
- 5.11.3 PRICE IMPACT ANALYSIS
- 5.11.4 IMPACT ON COUNTRIES/REGIONS
- 5.11.4.1 NORTH AMERICA
- 5.11.4.2 ASIA PACIFIC
- 5.11.4.3 EUROPE
- 5.11.4.4 LATIN AMERICA
- 5.11.5 IMPACT ON END-USE INDUSTRIES
- 5.11.5.1 Veterinary hospitals & clinics
- 5.11.5.2 Veterinary diagnostic imaging centers
- 5.11.5.3 Veterinary research institutes & universities
6 REGULATORY LANDSCAPE & SUSTAINABILITY INITIATIVES
- 6.1 REGIONAL REGULATIONS & COMPLIANCE
- 6.1.1 REGULATORY BODIES, GOVERNMENT AGENCIES, AND OTHER ORGANIZATIONS
- 6.1.2 REGULATORY ANALYSIS, BY COUNTRY/REGION
- 6.1.2.1 US
- 6.1.2.2 Europe
- 6.1.3 INDUSTRY STANDARDS
- 6.1.4 CERTIFICATIONS, LABELLING, AND ECO-STANDARDS
- 6.2 SUSTAINABILITY INITIATIVES
- 6.2.1 ENERGY-EFFICIENT IMAGING SYSTEMS & LOW-DOSE TECHNOLOGIES
- 6.2.2 DIGITAL WORKFLOW TRANSFORMATION & PAPERLESS IMAGING ECOSYSTEMS
- 6.2.3 SUSTAINABILITY IMPACT & REGULATORY POLICY INITIATIVES
7 TECHNOLOGICAL ADVANCEMENTS, AI-DRIVEN IMPACT, PATENTS, INNOVATIONS, AND FUTURE APPLICATIONS
- 7.1 KEY EMERGING TECHNOLOGIES
- 7.1.1 AI/DEEP LEARNING VETERINARY IMAGE INTERPRETATION
- 7.1.2 HANDHELD/PORTABLE ULTRASOUND FOR VETERINARY USE
- 7.2 COMPLEMENTARY TECHNOLOGIES
- 7.2.1 ZERO-HELIUM MRI COOLING/ECO-FRIENDLY MAGNET TECHNOLOGY
- 7.2.2 CLOUD & TELE-IMAGING: REMOTE RADIOLOGY FOR VETERINARY CLINICS
- 7.3 ADJACENT TECHNOLOGIES
- 7.3.1 THERMAL IMAGING (INFRARED THERMOGRAPHY) FOR VETERINARY USE
- 7.3.2 CONTRAST-ENHANCED ULTRASOUND (CEUS) IN VETERINARY IMAGING
- 7.4 TECHNOLOGY/PRODUCT ROADMAP
- 7.4.1 NEAR-TERM (2025-2027)
- 7.4.2 MID-TERM (2028-2030)
- 7.4.3 LONG-TERM (2030+)
- 7.5 PATENT ANALYSIS
- 7.5.1 PATENT PUBLICATION TRENDS
- 7.5.2 JURISDICTION & TOP APPLICANT ANALYSIS
- 7.6 FUTURE APPLICATIONS
- 7.6.1 AI-AUGMENTED MULTIMODAL IMAGING & ADVANCED DIAGNOSTIC PLATFORMS
- 7.6.2 CLOUD PACS, TELE-IMAGING, & RADIOLOGY AS A SERVICE
- 7.6.3 INTELLIGENT, ROBOTICS-ASSISTED IMAGING & AUTOMATED ACQUISITION SYSTEMS
- 7.6.4 GENERATIVE AI FOR TRAINING, SYNTHETIC DATA, IMAGE ENHANCEMENT, & DECISION SUPPORT
- 7.6.5 IOT-DRIVEN UPTIME OPTIMIZATION & PREDICTIVE MAINTENANCE
- 7.6.6 PORTABLE & POINT-OF-CARE IMAGING
- 7.7 IMPACT OF AI/GENERATIVE AI ON VETERINARY IMAGING MARKET
- 7.7.1 MARKET POTENTIAL
- 7.7.1.1 Automated radiology reporting and clinical documentation at scale
- 7.7.1.2 Acceleration of imaging utilization and clinical throughput enabled by GenAI-assisted decision support
- 7.7.1.3 Development of multispecies and cross-application imaging intelligence
- 7.7.2 TOP AI USE CASES
- 7.7.3 KEY COMPANIES IMPLEMENTING AI IN VETERINARY IMAGING MARKET
- 7.7.4 BEST PRACTICES FOLLOWED BY MANUFACTURERS/OEMS IN VETERINARY IMAGING MARKET
- 7.7.5 INTERCONNECTED ECOSYSTEMS AND IMPACT ON MARKET PLAYERS
- 7.7.6 CLIENTS' READINESS TO ADOPT GENERATIVE AI
- 7.7.1 MARKET POTENTIAL
- 7.8 SUCCESS STORIES & REAL-WORLD APPLICATIONS
- 7.8.1 IMPROVING DIAGNOSTIC CAPABILITY & MRI ACCESSIBILITY USING HALLMARQ 1.5T SMALL-ANIMAL MRI
- 7.8.2 AI-ASSISTED RADIOGRAPH INTERPRETATION TO IMPROVE URGENT-CARE DIAGNOSTICS
- 7.8.3 PORTABLE ULTRASOUND FOR EXOTIC SPECIES AT DENVER ZOO (E.I. MEDICAL IMAGING)
8 CUSTOMER LANDSCAPE & BUYER BEHAVIOR
- 8.1 DECISION-MAKING PROCESS
- 8.2 KEY STAKEHOLDERS IN BUYING PROCESS AND THEIR EVALUATION CRITERIA
- 8.2.1 KEY STAKEHOLDERS IN BUYING PROCESS
- 8.2.2 BUYING CRITERIA
- 8.3 ADOPTION BARRIERS & INTERNAL CHALLENGES
- 8.4 UNMET NEEDS OF VARIOUS END-USE INDUSTRIES
- 8.5 MARKET PROFITABILITY
9 VETERINARY IMAGING MARKET, BY OFFERING
- 9.1 INTRODUCTION
- 9.2 INSTRUMENTS
- 9.2.1 RADIOGRAPHY IMAGING SYSTEMS
- 9.2.1.1 Volume analysis of radiography imaging systems, 2024-2031 (thousand units)
- 9.2.1.2 Computed radiography systems
- 9.2.1.2.1 Ability to reduce storage costs to propel market
- 9.2.1.3 Direct radiography systems
- 9.2.1.3.1 Rising demand for high-quality images with low turnaround time to drive market
- 9.2.1.4 Film-based radiography systems
- 9.2.1.4.1 High risk of radiation exposure and limited storage to restrain market
- 9.2.1.5 Fluoroscopy
- 9.2.1.5.1 Increasing adoption of minimally invasive and interventional veterinary procedures is accelerating demand for fluoroscopy systems
- 9.2.2 ULTRASOUND IMAGING SYSTEMS
- 9.2.2.1 Volume analysis of ultrasound imaging systems, 2024-2031 (thousand units)
- 9.2.2.2 2D ultrasound imaging systems
- 9.2.2.2.1 Rising adoption of POC non-invasive soft-tissue imaging to propel use of 2D ultrasound
- 9.2.2.3 3D/4D ultrasound imaging systems
- 9.2.2.3.1 Ability to provide data for birth management & behavioral learning to support market growth
- 9.2.2.4 Doppler ultrasound imaging systems
- 9.2.2.4.1 Increasing need for advanced veterinary cardiac and vascular assessment to support adoption of Doppler ultrasound
- 9.2.3 CT IMAGING SYSTEMS
- 9.2.3.1 Volume analysis of CT imaging systems, 2024-2031 (Thousand units)
- 9.2.3.2 Multi-slice CT imaging systems
- 9.2.3.2.1 Rising case complexity and demand for fast, whole-body 3D diagnostics propel adoption of multi-slice CT systems
- 9.2.3.3 Cone-beam CT imaging systems
- 9.2.3.3.1 Demand for high-resolution dentoalveolar and standing equine 3D imaging to drive uptake of CBCT
- 9.2.4 VIDEO ENDOSCOPY IMAGING SYSTEMS
- 9.2.4.1 Volume analysis of video endoscopy imaging systems, 2024-2031 (Thousand units)
- 9.2.4.2 Flexible endoscopy imaging systems
- 9.2.4.2.1 Growing demand for minimally invasive internal diagnostics and therapeutic interventions drives adoption
- 9.2.4.3 Rigid endoscopy imaging systems
- 9.2.4.3.1 Growing adoption of minimally invasive surgical techniques propels use of rigid endoscopes in veterinary imaging and surgery
- 9.2.5 MRI SYSTEMS
- 9.2.5.1 Volume analysis of MRI systems, 2024-2031 (thousand units)
- 9.2.5.2 Low-field MRI Systems
- 9.2.5.2.1 Lower cost of ownership, easier installation, and dedicated veterinary MRI platforms to support low-field MRI adoption
- 9.2.5.3 High-field MRI systems
- 9.2.5.3.1 Increasing demand for advanced neurologic, oncologic, and musculoskeletal diagnostics drives expansion of high-field MRI
- 9.2.6 NUCLEAR IMAGING SYSTEMS
- 9.2.6.1 Demand for functional diagnostics and hybrid PET/CT to support expansion of nuclear imaging systems in veterinary centers
- 9.2.6.2 Volume analysis of nuclear imaging systems, 2024-2031 (Thousand units)
- 9.2.7 OTHER IMAGING SYSTEMS
- 9.2.1 RADIOGRAPHY IMAGING SYSTEMS
- 9.3 REAGENTS
- 9.3.1 X-RAY & CT CONTRAST REAGENTS
- 9.3.1.1 Rising uptake in neurology applications to boost demand
- 9.3.1.2 Volume analysis of X-ray and CT contrast reagents, by region, 2024-2031 (Thousand units)
- 9.3.2 MRI CONTRAST REAGENTS
- 9.3.2.1 Higher efficacy and lower toxicity benefits to propel market
- 9.3.2.2 Volume analysis of MRI contrast reagents, by region, 2024-2031 (Thousand units)
- 9.3.3 ULTRASOUND CONTRAST REAGENTS
- 9.3.3.1 Ability to enhance therapeutic efficacy in cardiology applications to drive market
- 9.3.3.2 Volume analysis of ultrasound contrast reagents, by region, 2024-2031 (Thousand units)
- 9.3.4 NUCLEAR IMAGING CONTRAST REAGENTS
- 9.3.4.1 Rising adoption of functional imaging for oncology and endocrine disorders drives nuclear imaging reagent demand
- 9.3.4.2 Volume analysis of nuclear imaging contrast reagents, by region, 2024-2031 (thousand units)
- 9.3.1 X-RAY & CT CONTRAST REAGENTS
- 9.4 SOFTWARE & SERVICES
- 9.4.1 PACS/RIS
- 9.4.1.1 Rapid digital imaging adoption and multi-site veterinary networks drive demand for centralized image and workflow management
- 9.4.2 TELERADIOLOGY PLATFORMS & REPORTING SERVICES
- 9.4.2.1 Shortage of board-certified veterinary radiologists and need for 24/7 expert interpretation, accelerating teleradiology adoption
- 9.4.3 AI/ADVANCED IMAGE ANALYSIS
- 9.4.3.1 Rising imaging workload and demand for faster, consistent diagnostics fueling AI-assisted image interpretation
- 9.4.1 PACS/RIS
- 9.5 ACCESSORIES & CONSUMABLES
- 9.5.1 X-RAY/DR ACCESSORIES & CONSUMABLES
- 9.5.1.1 High daily radiography volumes and ongoing shift to digital X-ray driving recurring accessory and replacement demand
- 9.5.2 ULTRASOUND ACCESSORIES & CONSUMABLES
- 9.5.2.1 First-line, high-frequency ultrasound usage across companion and large animals, sustaining repeat probe and consumable demand
- 9.5.3 CT ACCESSORIES & CONSUMABLES
- 9.5.3.1 Rising use of contrast-enhanced and advanced CT procedures in referral centers to drive adoption of injectors and procedure-related consumables
- 9.5.4 OTHER ACCESSORIES & CONSUMABLES
- 9.5.1 X-RAY/DR ACCESSORIES & CONSUMABLES
10 VETERINARY IMAGING INSTRUMENTS MARKET, BY MODALITY
- 10.1 INTRODUCTION
- 10.2 STATIONARY INSTRUMENTS
- 10.2.1 GROWING EMPHASIS ON PREVENTIVE CARE AND EARLY DISEASE DETECTION TO DRIVE MARKET
- 10.3 PORTABLE INSTRUMENTS
- 10.3.1 GROWING DEMAND FOR POINT-OF-CARE DIAGNOSTICS TO PROPEL MARKET
11 VETERINARY IMAGING SOFTWARE MARKET, BY DELIVERY MODE
- 11.1 INTRODUCTION
- 11.2 ON-PREMISE/HYBRID
- 11.2.1 LOW-LATENCY LOCAL ACCESS TO LARGE IMAGING STUDIES AND REGULATORY/DATA-SOVEREIGNTY CONCERNS DRIVE DEMAND
- 11.3 WEB/CLOUD-BASED
- 11.3.1 TELE-RADIOLOGY DEMAND AND MULTI-CLINIC CONNECTIVITY TO ACCELERATE ADOPTION
12 VETERINARY IMAGING MARKET, BY APPLICATION
- 12.1 INTRODUCTION
- 12.2 ORTHOPEDICS
- 12.2.1 HIGH CLINICAL VOLUME OF FRACTURES AND LAMENESS AND DEMAND FOR ANESTHESIA-FREE STANDING IMAGING TO PROPEL MARKET GROWTH
- 12.3 OBSTETRICS & GYNECOLOGY
- 12.3.1 INCREASING FOCUS ON FERTILITY MANAGEMENT TO DRIVE GROWTH OF REPRODUCTIVE VETERINARY IMAGING
- 12.4 ONCOLOGY
- 12.4.1 INCREASING PREVALENCE OF CANCER IN COMPANION ANIMALS TO DRIVE MARKET
- 12.5 CARDIOLOGY
- 12.5.1 GROWTH IN AGING PET POPULATION AND OBESITY TO PROPEL MARKET
- 12.6 NEUROLOGY
- 12.6.1 INCREASING INCIDENCE OF MENINGITIS AND TUMORS TO SUPPORT MARKET GROWTH
- 12.7 DENTISTRY
- 12.7.1 INCREASING PREVALENCE OF DENTAL DISORDERS IN ANIMALS TO FUEL MARKET
- 12.8 RESPIRATORY & THORACIC IMAGING
- 12.8.1 RISING PREVALENCE OF RESPIRATORY DISORDERS AND DEMAND FOR ADVANCED THORACIC DIAGNOSTICS ARE ACCELERATING ADOPTION OF MULTIMODAL VETERINARY IMAGING
- 12.9 GASTROENTEROLOGY
- 12.9.1 GROWING DEMAND FOR MINIMALLY INVASIVE GI DIAGNOSIS AND ADVANCED CROSS-SECTIONAL IMAGING DRIVES ADOPTION
- 12.10 OTHER APPLICATIONS
13 VETERINARY IMAGING MARKET, BY ANIMAL TYPE
- 13.1 INTRODUCTION
- 13.2 SMALL ANIMALS
- 13.2.1 DOGS
- 13.2.1.1 High disease prevalence and greater use of CT/MRI with canine-specific protocols drive strong growth in canine imaging
- 13.2.2 CATS
- 13.2.2.1 Rising ownership, chronic disease burden, and better feline-specific imaging tools boost demand for feline imaging
- 13.2.3 OTHER SMALL ANIMALS
- 13.2.1 DOGS
- 13.3 LARGE ANIMALS
- 13.3.1 EQUINE
- 13.3.1.1 Rising demand for advanced musculoskeletal diagnostics and expansion of standing CT/MRI technologies to accelerate growth in equine medical imaging
- 13.3.2 BOVINE
- 13.3.2.1 Rising milk production and demand for dairy products to propel market growth
- 13.3.3 SWINE
- 13.3.3.1 Need for efficient reproductive management, rapid herd disease detection, and portable imaging tools to support market growth
- 13.3.4 OTHER LARGE ANIMALS
- 13.3.1 EQUINE
14 VETERINARY IMAGING MARKET, BY END USER
- 14.1 INTRODUCTION
- 14.2 VETERINARY HOSPITALS & CLINICS
- 14.2.1 RISING PET OWNERSHIP AND GROWING DIAGNOSTIC AWARENESS DRIVING DEMAND FOR VETERINARY IMAGING
- 14.3 VETERINARY DIAGNOSTIC IMAGING CENTERS
- 14.3.1 LIMITED IN-HOUSE ACCESS TO ADVANCED IMAGING AND RISING REFERRAL COMPLEXITY TO DRIVE GROWTH
- 14.4 ACADEMIC & RESEARCH INSTITUTES
- 14.4.1 INCREASING COLLABORATIONS AND RESEARCH FUNDING SUPPORT UTILIZATION OF ADVANCED VETERINARY IMAGING SYSTEMS
15 VETERINARY IMAGING MARKET, BY REGION
- 15.1 INTRODUCTION
- 15.1.1 GLOBAL VOLUME ANALYSIS OF INSTRUMENTS & REAGENTS, 2024-2031 (THOUSAND UNITS)
- 15.2 NORTH AMERICA
- 15.2.1 MACROECONOMIC OUTLOOK FOR NORTH AMERICA
- 15.2.2 NORTH AMERICA: VOLUME ANALYSIS OF INSTRUMENTS & REAGENTS, 2024-2031 (THOUSAND UNITS)
- 15.2.3 US
- 15.2.3.1 Rising pet population to drive demand for veterinary equipment
- 15.2.4 CANADA
- 15.2.4.1 Rising pet adoption and diagnostic demand to support veterinary imaging growth
- 15.3 EUROPE
- 15.3.1 MACROECONOMIC OUTLOOK FOR EUROPE
- 15.3.2 EUROPE: VOLUME ANALYSIS OF INSTRUMENTS & REAGENTS, 2024-2031 (THOUSAND UNITS)
- 15.3.3 GERMANY
- 15.3.3.1 Germany to dominate the European market
- 15.3.4 UK
- 15.3.4.1 Increasing pet ownership and diagnostic intensity to drive veterinary imaging market growth
- 15.3.5 FRANCE
- 15.3.5.1 Rising cases of zoonotic diseases to drive veterinary imaging demand
- 15.3.6 ITALY
- 15.3.6.1 Expanding livestock population and rising awareness to support market growth
- 15.3.7 SPAIN
- 15.3.7.1 Increasing animal healthcare expenditure to drive market growth
- 15.3.8 NETHERLANDS
- 15.3.8.1 Increasing animal healthcare expenditure to support veterinary imaging market growth
- 15.3.9 BELGIUM
- 15.3.9.1 High livestock density to sustain veterinary imaging demand
- 15.3.10 LUXEMBOURG
- 15.3.10.1 High per-capita animal healthcare spending and strong regulatory oversight to support veterinary imaging adoption
- 15.3.11 REST OF EUROPE
- 15.4 ASIA PACIFIC
- 15.4.1 MACROECONOMIC OUTLOOK FOR ASIA PACIFIC
- 15.4.2 ASIA PACIFIC: VOLUME ANALYSIS OF INSTRUMENTS & REAGENTS, 2024-2031 (THOUSAND UNITS)
- 15.4.3 CHINA
- 15.4.3.1 China to dominate the APAC veterinary imaging market
- 15.4.4 JAPAN
- 15.4.4.1 Rising demand for imported breeds and advanced diagnostics to drive the veterinary imaging market
- 15.4.5 INDIA
- 15.4.5.1 Rising livestock population and growing diagnostic awareness to boost veterinary imaging market growth
- 15.4.6 AUSTRALIA
- 15.4.6.1 Rising livestock animal population and increasing pet ownership to support veterinary imaging market growth
- 15.4.7 SOUTH KOREA
- 15.4.7.1 Increasing demand for preventive care and an aging pet population to drive veterinary imaging market growth
- 15.4.8 THAILAND
- 15.4.8.1 Increasing demand for preventive care and aging pet population to drive market
- 15.4.9 NEW ZEALAND
- 15.4.9.1 Increasing demand for preventive care and an aging pet population to drive the veterinary imaging market growth
- 15.4.10 REST OF ASIA PACIFIC
- 15.5 LATIN AMERICA
- 15.5.1 MACROECONOMIC OUTLOOK FOR LATIN AMERICA
- 15.5.2 LATIN AMERICA: VOLUME ANALYSIS OF INSTRUMENTS & REAGENTS, 2024-2031 (THOUSAND UNITS)
- 15.5.3 BRAZIL
- 15.5.3.1 Brazil to dominate the LATAM market due to rapidly increasing livestock population
- 15.5.4 MEXICO
- 15.5.4.1 Rising demand for animal-derived food products to contribute to market growth
- 15.5.5 ARGENTINA
- 15.5.5.1 Export-oriented livestock production to drive veterinary imaging demand
- 15.5.6 REST OF LATIN AMERICA
- 15.6 MIDDLE EAST & AFRICA
- 15.6.1 MACROECONOMIC OUTLOOK FOR THE MIDDLE EAST & AFRICA
- 15.6.2 MIDDLE EAST & AFRICA: VOLUME ANALYSIS OF INSTRUMENTS & REAGENTS, 2024-2031 (THOUSAND UNITS)
- 15.6.3 GCC COUNTRIES
- 15.6.3.1 Kingdom of Saudi Arabia
- 15.6.3.1.1 Technology advancements in veterinary diagnostic imaging to boost growth
- 15.6.3.2 United Arab Emirates
- 15.6.3.2.1 Government support and high livestock population to fuel market growth
- 15.6.3.3 Rest of GCC Countries
- 15.6.3.1 Kingdom of Saudi Arabia
- 15.6.4 REST OF THE MIDDLE EAST & AFRICA
16 COMPETITIVE LANDSCAPE
- 16.1 INTRODUCTION
- 16.2 KEY PLAYER STRATEGIES/RIGHT TO WIN
- 16.2.1 OVERVIEW OF STRATEGIES DEPLOYED BY KEY PLAYERS IN VETERINARY IMAGING MARKET
- 16.3 REVENUE ANALYSIS, 2021-2025
- 16.4 MARKET SHARE ANALYSIS, 2025
- 16.4.1 RANKING OF KEY MARKET PLAYERS
- 16.4.2 GLOBAL MARKET SHARE ANALYSIS
- 16.4.2.1 US veterinary imaging market share analysis
- 16.4.2.2 Europe veterinary imaging market
- 16.4.3 VETERINARY RADIOGRAPHY IMAGING MARKET
- 16.4.4 VETERINARY ULTRASOUND MARKET
- 16.4.5 VETERINARY MRI MARKET
- 16.4.6 VETERINARY CT MARKET
- 16.5 COMPANY EVALUATION MATRIX: KEY PLAYERS, 2025
- 16.5.1 STARS
- 16.5.2 EMERGING LEADERS
- 16.5.3 PERVASIVE PLAYERS
- 16.5.4 PARTICIPANTS
- 16.5.5 COMPANY FOOTPRINT: KEY PLAYERS, 2025
- 16.5.5.1 Company footprint
- 16.5.5.2 Region footprint
- 16.5.5.3 Offering footprint
- 16.5.5.4 Animal type footprint
- 16.5.5.5 Modality footprint
- 16.6 COMPANY EVALUATION MATRIX: STARTUPS/SMES, 2025
- 16.6.1 PROGRESSIVE COMPANIES
- 16.6.2 RESPONSIVE COMPANIES
- 16.6.3 DYNAMIC COMPANIES
- 16.6.4 STARTING BLOCKS
- 16.6.5 COMPETITIVE BENCHMARKING: STARTUPS/SMES, 2025
- 16.6.5.1 Detailed list of key startups/SME players
- 16.6.5.2 Competitive benchmarking of key emerging players/startups
- 16.7 PRODUCT COMPARISON
- 16.8 R&D EXPENDITURE OF KEY PLAYERS
- 16.9 COMPANY VALUATION & FINANCIAL METRICS
- 16.9.1 FINANCIAL METRICS
- 16.9.2 COMPANY VALUATION
- 16.10 COMPETITIVE SCENARIO
- 16.10.1 PRODUCT LAUNCHES & UPGRADES
- 16.10.2 DEALS
- 16.10.3 EXPANSIONS
- 16.10.4 OTHER DEVELOPMENTS
17 COMPANY PROFILES
- 17.1 KEY PLAYERS
- 17.1.1 GE HEALTHCARE
- 17.1.1.1 Business overview
- 17.1.1.2 Products offered
- 17.1.1.3 Recent developments
- 17.1.1.3.1 Product launches & upgrades
- 17.1.1.3.2 Deals
- 17.1.1.3.3 Expansions
- 17.1.1.3.4 Other developments
- 17.1.1.4 MnM view
- 17.1.1.4.1 Key strengths
- 17.1.1.4.2 Strategic choices
- 17.1.1.4.3 Weaknesses & competitive threats
- 17.1.2 IDEXX LABORATORIES, INC.
- 17.1.2.1 Business overview
- 17.1.2.2 Products offered
- 17.1.2.3 MnM view
- 17.1.2.3.1 Key strengths
- 17.1.2.3.2 Strategic choices
- 17.1.2.3.3 Weaknesses & competitive threats
- 17.1.3 CARESTREAM HEALTH
- 17.1.3.1 Business overview
- 17.1.3.2 Products offered
- 17.1.3.3 Recent developments
- 17.1.3.3.1 Product launches, enhancements, approvals, and upgrades
- 17.1.3.3.2 Deals
- 17.1.3.4 MnM view
- 17.1.3.4.1 Key strengths
- 17.1.3.4.2 Strategic choices
- 17.1.3.4.3 Weaknesses & competitive threats
- 17.1.4 AGFA-GEVAERT GROUP
- 17.1.4.1 Business overview
- 17.1.4.2 Products offered
- 17.1.4.3 Recent developments
- 17.1.4.3.1 Product launches & upgrades
- 17.1.4.4 MnM view
- 17.1.4.4.1 Key strengths
- 17.1.4.4.2 Strategic choices
- 17.1.4.4.3 Weaknesses & competitive threats
- 17.1.5 ESAOTE SPA
- 17.1.5.1 Business overview
- 17.1.5.2 Products offered
- 17.1.5.3 Recent developments
- 17.1.5.3.1 Product launches
- 17.1.5.3.2 Deals
- 17.1.5.3.3 Expansions
- 17.1.5.4 MnM view
- 17.1.5.4.1 Key strengths
- 17.1.5.4.2 Strategic choices
- 17.1.5.4.3 Weaknesses & competitive threats
- 17.1.6 SHENZHEN MINDRAY ANIMAL MEDICAL TECHNOLOGY CO., LTD.
- 17.1.6.1 Business overview
- 17.1.6.2 Products/Services offered
- 17.1.6.3 Recent developments
- 17.1.6.3.1 Product launches
- 17.1.6.3.2 Expansions
- 17.1.7 ANTECH DIAGNOSTICS, INC.
- 17.1.7.1 Business overview
- 17.1.7.2 Products offered
- 17.1.7.3 Recent developments
- 17.1.7.3.1 Product launches
- 17.1.7.3.2 Deals
- 17.1.8 SIEMENS HEALTHCARE PTY LTD
- 17.1.8.1 Business overview
- 17.1.8.2 Products offered
- 17.1.8.3 Recent developments
- 17.1.8.3.1 Other developments
- 17.1.9 FUJIFILM HOLDINGS CORPORATION
- 17.1.9.1 Business overview
- 17.1.9.2 Products offered
- 17.1.9.3 Recent developments
- 17.1.9.3.1 Product launches
- 17.1.10 OEHM UND REHBEIN GMBH
- 17.1.10.1 Business overview
- 17.1.10.2 Products offered
- 17.1.10.3 Recent developments
- 17.1.10.3.1 Product launches & enhancements
- 17.1.10.3.2 Deals
- 17.1.11 CANON INC.
- 17.1.11.1 Business overview
- 17.1.11.2 Products offered
- 17.1.12 SEDECAL
- 17.1.12.1 Business overview
- 17.1.12.2 Products offered
- 17.1.13 DRAMINSKI
- 17.1.13.1 Business overview
- 17.1.13.2 Products offered
- 17.1.13.3 Recent developments
- 17.1.13.3.1 Product upgrades
- 17.1.14 E.I. MEDICAL IMAGING
- 17.1.14.1 Business overview
- 17.1.14.2 Products offered
- 17.1.14.3 Recent developments
- 17.1.14.3.1 Product launches & upgrades
- 17.1.15 SAMSUNG ELECTRONICS CO., LTD.
- 17.1.15.1 Business overview
- 17.1.15.2 Products offered
- 17.1.15.3 Recent developments
- 17.1.15.3.1 Product launches & approvals
- 17.1.15.3.2 Deals
- 17.1.15.3.3 Other developments
- 17.1.16 KONICA MINOLTA, INC.
- 17.1.16.1 Business overview
- 17.1.16.2 Products offered
- 17.1.16.3 Recent developments
- 17.1.16.3.1 Other developments
- 17.1.17 VETEL DIAGNOSTICS INCE
- 17.1.17.1 Business overview
- 17.1.17.2 Products offered
- 17.1.1 GE HEALTHCARE
- 17.2 OTHER PLAYERS
- 17.2.1 VETOLOGY AI
- 17.2.2 HALLMARQ VETERINARY IMAGING
- 17.2.3 MINXRAY, INC.
- 17.2.4 REPROSCAN
- 17.2.5 IM3 AUS
- 17.2.6 MIE GMBH
- 17.2.7 MYVET IMAGING INC. (SUBSIDIARY OF WOORIEN)
- 17.2.8 HAWKCELL SAS
18 RESEARCH METHODOLOGY
- 18.1 RESEARCH DATA
- 18.2 RESEARCH METHODOLOGY DESIGN
- 18.2.1 SECONDARY DATA
- 18.2.1.1 Key data from secondary sources
- 18.2.2 PRIMARY DATA
- 18.2.2.1 Key data from primary sources
- 18.2.2.2 Key industry insights
- 18.2.1 SECONDARY DATA
- 18.3 MARKET SIZE ESTIMATION
- 18.3.1 APPROACH 1: REVENUE SHARE ANALYSIS
- 18.3.2 APPROACH 2: COMPANY PRESENTATIONS AND PRIMARY INTERVIEWS
- 18.3.3 APPROACH 3: DEMAND-SIDE ANALYSIS
- 18.3.4 APPROACH 4: TOP-DOWN APPROACH
- 18.3.5 APPROACH 5: BOTTOM-UP APPROACH
- 18.4 MARKET BREAKDOWN & DATA TRIANGULATION
- 18.5 MARKET SHARE ANALYSIS
- 18.6 RESEARCH ASSUMPTIONS
- 18.6.1 GROWTH RATE ASSUMPTIONS
- 18.7 RISK ASSESSMENT
- 18.8 RESEARCH LIMITATIONS
- 18.8.1 METHODOLOGY-RELATED LIMITATIONS
- 18.8.2 SCOPE-RELATED LIMITATIONS
19 APPENDIX
- 19.1 DISCUSSION GUIDE
- 19.2 KNOWLEDGESTORE: MARKETSANDMARKETS' SUBSCRIPTION PORTAL
- 19.3 CUSTOMIZATION OPTIONS
- 19.3.1 SERVICE ANALYSIS
- 19.3.2 COMPANY INFORMATION
- 19.3.3 GEOGRAPHIC ANALYSIS
- 19.3.4 REGIONAL/COUNTRY-LEVEL MARKET SHARE ANALYSIS
- 19.3.5 COUNTRY-LEVEL VOLUME ANALYSIS BY PRODUCT
- 19.3.6 BY SERVICE MARKET SHARE ANALYSIS (TOP 5 PLAYERS)
- 19.3.7 ANY CONSULT/CUSTOM REQUIREMENTS AS PER CLIENT REQUESTS
- 19.4 RELATED REPORTS
- 19.5 AUTHOR DETAILS
