
|
시장보고서
상품코드
2130444
변압기 모니터링 시장(-2031년) : 구성 요소(하드웨어·소프트웨어), 서비스(오일 감시·부싱 감시·부분 방전 감시·OLTC 감시), 전압, 유형, 설치 구분, 최종 사용자, 용도, 지역별Transformer Monitoring Market by Component (Hardware, Software), Service (Oil Monitoring, Bushing Monitoring, Partial Discharge Monitoring, OLTC Monitoring), Voltage, Type, Installation, End User, Application, and Region - Global Forecast to 2031 |
||||||

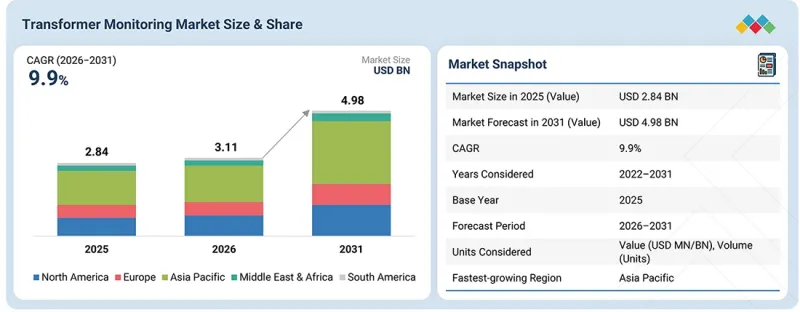
변압기 모니터링 시장 규모는 2026년 31억 1,000만 달러에서 2031년에는 49억 8,000만 달러에 이를 것으로 예상되며, 예측 기간 동안 CAGR 9.9%를 기록할 전망입니다.
송전망의 신뢰성, 변압기 자산의 건전성, 상태 기반 유지보수(CBM)에 대한 관심이 높아짐에 따라 이 시장은 급속히 성장할 것으로 예상되며, 예측됩니다.
| 조사 범위 | |
|---|---|
| 조사 대상 기간 | 2022-2031년 |
| 기준 연도 | 2025년 |
| 예측 기간 | 2026-2031년 |
| 단위 | 금액(달러)·수량(유닛) |
| 부문 | 구성 요소, 서비스, 전압, 유형, 설치 구분, 최종 사용자, 용도, 지역별 |
| 대상 지역 | 북미, 남미, 유럽, 아시아태평양, 중동 및 아프리카 |
전력 회사 및 산업 사업자들은 비정상적인 가동 상태를 감지하고, 고장을 조기에 발견하며, 예기치 못한 변압기 고장을 방지하기 위해 모니터링 시스템의 활용을 점점 더 확대되고 있습니다. 변압기의 가동 수명을 연장하고 유지보수 프로세스를 개선해야 할 필요성이 높아짐에 따라, 예측 유지보수, 실시간 모니터링 시스템, 자산 건전성 평가의 활용이 더욱 촉진될 것입니다.
“예측 기간 동안, 신규 설치 부문이 주도적인 위치를 유지할 전망”
설치 부문별로는 설계·제조 단계부터 새로 가동되는 변압기에 모니터링 시스템을 탑재하는 추세가 있어, 2026년부터 2031년에 걸쳐 신설 부문이 주도적인 위치를 유지할 것으로 예측됩니다. 공장에서 내장된 센서, 통신 인터페이스, 모니터링 플랫폼을 통해 모니터링 기능을 나중에 추가하는 것이 아니라 변압기에 처음부터 내장할 수 있게 되어, 가동 초기부터 종합적인 상태 평가를 지원합니다. 또한, 각 지역에서 전력망의 확장 및 업그레이드가 진행되는 가운데, 변압기의 신규 설치 건수가 증가하고 있는 것은 통합형 감시 기술에 큰 성장 기회를 제공합니다. 게다가 신규 설치의 경우, 다중 파라미터 감시, 디지털 통신, 자산 관리 기술을 도입하기 쉬우므로, 신규 설치를 위한 감시 솔루션에 대한 안정적인 수요가 유지될 전망입니다.
“2026년부터 2031년에 걸쳐 데이터센터 부문이 가장 높은 연평균 성장률(CAGR)을 보일 전망”
최종 사용자별로 보면, 하이퍼스케일 및 코로케이션 시설의 급속한 확대, AI 워크로드 증가, 전력 밀도 요구 사항의 상승을 배경으로, 예측 기간 동안 데이터센터 부문이 가장 높은 성장률을 기록할 전망입니다. 무정전 전원 장치(UPS)에 대한 의존도가 높아지는 가운데, 고장 징후를 조기에 감지하고, 예기치 않은 정전을 방지하며, 전력 인프라의 신뢰성을 향상시키기 위한 실시간 변압기 모니터링에 대한 수요가 증가하고 있습니다. 데이터센터에서는 미션 크리티컬한 전기 시스템이 지속적으로 가동되고 있기 때문에 사업자들은 가동 중지 시간을 최소화하고 유지보수 비용을 최적화하기 위해 예측 유지보수, 자산 건전성 평가, 상태 모니터링을 우선시하고 있습니다. 또한, 디지털 변전소, IoT 지원 센서, 원격 모니터링 플랫폼의 통합을 통해 전체 전기 자산을 일원적으로 가시화할 수 있게 되어, 가동률 향상, 운영 복원력 강화, 변압기 인프라의 수명 주기 최적화가 촉진되고 있습니다.
“2031년에는 아시아태평양이 가장 큰 점유율을 차지할 전망”
급속한 송전망 확장, 도시화의 가속화, 송배전 인프라 현대화를 위한 대규모 투자가 주요 요인입니다. 전력 수요 증가, 재생에너지 도입, 국경을 초월한 전력 연결로 인해 지역 송전망 운영이 복잡해지고 있으며, 자산 현황을 실시간으로 파악할 필요성이 높아지고 있습니다. 일본, 한국, 호주 등의 선진국 시장에서는 변압기의 노후화가 진행되고 있는 점이 상태 모니터링 및 예측 유지보수 솔루션 도입을 뒷받침하고 있습니다. 한편, 신흥 경제국에서는 새로운 송배전 인프라 구축에 따라 모니터링 역량 확충이 진행되고 있습니다. 또한, 스마트 그리드, 디지털 변전소, IoT를 활용한 모니터링, 송배전망의 복원력에 대한 투자가 전력 회사의 데이터 기반 자산 관리로의 전환을 촉진하여, 계획 외 정지를 줄이는 데 기여하고 있습니다.
본 보고서에서는 세계의 변압기 모니터링 시장을 조사했으며, 시장 개요, 시장 성장에 영향을 미치는 각종 요인 분석, 기술 및 특허 동향, 법규제 환경, 사례 연구, 시장 규모 추이 및 전망, 각종 분류·지역/주요 국가별 상세 분석, 경쟁 구도, 주요 기업 프로파일 등을 정리했습니다.
자주 묻는 질문
목차
제1장 서론
제2장 주요 요약
제3장 프리미엄 인사이트
제4장 시장 개요
제5장 업계 동향
제6장 기술 진보, AI의 영향, 특허, 혁신, 향후 용도
제7장 규제 상황
제8장 고객 현황과 구매 행동
제9장 변압기 모니터링 시장 : 구성 요소별
제10장 변압기 모니터링 시장 : 유형별
제11장 변압기 모니터링 시장 : 용도별
제12장 변압기 모니터링 시장 : 서비스별
제13장 변압기 모니터링 시장 : 정격 전압별
제14장 변압기 모니터링 시장 : 설치 구분별
제15장 변압기 모니터링 시장 : 최종 사용자별
제16장 변압기 모니터링 시장 : 지역별
제17장 경쟁 구도
제18장 기업 개요
제19장 조사 방법
제20장 부록
KTH 26.09.28The transformer monitoring market is projected to reach USD 4.98 billion by 2031 from USD 3.11 billion in 2026, recording a CAGR of 9.9% during the forecast period. The market is expected to grow rapidly due to the growing emphasis on grid reliability, transformer asset health, and condition-based maintenance.
| Scope of the Report | |
|---|---|
| Years Considered for the Study | 2022-2031 |
| Base Year | 2025 |
| Forecast Period | 2026-2031 |
| Units Considered | Value (USD Million/Billion), Volume (Units) |
| Segments | by Component, Service, Voltage, Type, Installation, End User, Application, and Region |
| Regions covered | North America, South America, Europe, Asia Pacific, and the Middle East & Africa |
Utilities and industrial operators are increasingly using monitoring systems to detect unusual operating conditions, ensuring the early detection of failures, and preventing unexpected transformer failures. The need to extend transformers' operational life and improve the maintenance process will further stimulate the use of predictive diagnostics, real-time monitoring systems, and asset health assessment.
"New segment to maintain the leading position during the forecast period"
In terms of installation, the new segment is anticipated to maintain the leading position in the transformer monitoring market from 2026 to 2031 due to the trend of including monitoring systems in newly commissioned transformers even during the design and manufacturing stages. Factory-integrated sensors, communication interfaces, and monitoring platforms allow monitoring capabilities to be built into the transformer rather than added later, supporting comprehensive condition assessment from the beginning of operation. The growing number of new transformer installations in the expanding and upgrading power grid of regions opens great prospects for integrated monitoring technologies. Moreover, new installations allow more room for utilizing multi-parameter monitoring, digital communication, and asset management technologies, maintaining steady demand for monitoring solutions for new installations.
"Data centers segment to exhibit the highest CAGR between 2026 and 2031"
In terms of end user, the data centers segment is likely to record the highest growth rate in the transformer monitoring market during the forecast period, driven by rapid expansion of hyperscale and colocation facilities, rising AI workloads, and increasing power-density requirements. Growing dependence on uninterrupted power supply is strengthening demand for real-time transformer monitoring to detect emerging faults, prevent unplanned outages, and enhance power infrastructure reliability. As data centers operate mission-critical electrical systems continuously, operators are prioritizing predictive maintenance, asset health assessment, and condition-based monitoring to minimize downtime and optimize maintenance costs. In addition, the integration of digital substations, IoT-enabled sensors, and remote monitoring platforms is enabling centralized visibility across electrical assets, supporting higher uptime, operational resilience, and lifecycle optimization of transformer infrastructure.
"Asia Pacific to hold the largest share of the transformer monitoring market in 2031"
In terms of region, Asia Pacific is expected to account for the largest market share in 2031, owing to the rapid grid expansion, accelerating urbanization, and substantial investments in transmission and distribution infrastructure modernization. Growing electricity demand, renewable energy integration, and cross-border power connectivity are increasing the operational complexity of regional grids, strengthening the need for real-time asset visibility. Aging transformer fleets across developed markets such as Japan, South Korea, and Australia are driving adoption of condition monitoring and predictive maintenance solutions, while emerging economies are expanding monitoring capabilities alongside new grid infrastructure. Additionally, investments in smart grids, digital substations, IoT-enabled monitoring, and grid resilience are encouraging utilities to transition toward data-driven asset management and minimize unplanned outages.
Breakdown of Primaries
In-depth interviews with key industry participants, subject-matter experts, C-level executives of key market players, and directors, among other experts, were conducted to obtain and verify critical qualitative and quantitative information, as well as to assess future market prospects. The primary interviews were distributed as follows:
By Company Type: Tier 1- 65%, Tier 2 - 24%, and Tier 3 - 11%
By Designation: C-Level Executives - 30%, Directors - 25%, Others - 45%
By Region: North America - 20%, Europe - 25%, Asia Pacific - 30%, Middle East & Africa - 10%, South America - 15%.
Note: Others include sales managers, engineers, and regional managers.
Tier 1 company: revenue >USD 5 billion; tier 2 company: revenue between USD 1 and USD 5 billion; and tier 3 company: revenue <USD 1 billion in 2025
Well-established technology companies and transformer monitoring manufacturers predominantly govern the transformer monitoring market. Key players profiled in the report include GE Vernova (US), Schneider Electric (France), Siemens (Germany), Hitachi Energy Ltd. (Switzerland), Eaton (Ireland), Mistras Group (US), Vaisala (Finland), Reinhausen GmbH (Germany), Qualitrol Company LLC. (US), and Doble Engineering Company (US), among others. Their strong manufacturing footprints, services technology leadership, and continued investments in Transformer Monitoring Systems transition and regional capacity expansion continue to shape the competitive landscape.
Research Coverage
The report provides a comprehensive definition, description, and forecast of the transformer monitoring across component (hardware and software), type (oil-immersed, cast-resin, and other types), service (dissolved gas analysis, bushing monitoring, partial discharge monitoring, OLTC monitoring, and other services), voltage (below 36 kV, 36-230 kV, and above 230 kV), application (power transformers, distribution transformers, and other applications), installation (new and retrofit), end user (power utilities, industrial, residential/commercial, data centers, and other end users), and region (North America, Europe, Asia Pacific, South America, and the Middle East & Africa). It delivers qualitative and quantitative analysis of market drivers, restraints, opportunities, and challenges. The study also includes competitive landscape assessment, market sizing and forecasts, technology trends, ecosystem analysis, commercial use cases, company benchmarking, and recent developments to provide a comprehensive view of the Transformer Monitoring market.
Key Benefits of Buying the Report
The report is designed to support OEMs, installers, utilities, policymakers, investors, and other stakeholders in understanding the evolving Transformer Monitoring market. It provides reliable market forecasts across all major segments and regions while delivering insights into technology adoption, competitive positioning, and future growth opportunities. The report enables stakeholders to make informed business decisions through detailed market intelligence and strategic analysis.
- Analysis of Key Market Dynamics: Covers the major drivers (Increasing adoption of digital substations and smart grids, Growing power demand in data centers, Mounting adoption of condition-based and predictive maintenance for transformers), restraints (High initial investment and installation costs, Complex integration with existing infrastructure), opportunities (Rising adoption of big data analytics and cloud-based monitoring platforms, Increasing reliance on renewables), and challenges (Cybersecurity and data protection risks) influencing the growth of the transformer monitoring market
- Technology and Product Innovation: Examines advancements in online dissolved gas analysis, partial discharge monitoring, bushing monitoring, temperature and moisture measuring, IoT sensors, cloud and edge computing, and analytics-based health assessment of transformers that facilitate continuous condition monitoring and fault detection
- Market Development: Highlights how the modernization of the grid, aging transformer fleets, penetration of renewable energies, rising demand for electricity, and transition towards condition-based maintenance spur the implementation of transformer monitoring systems in utilities, industries, and critical power infrastructure
- Market Diversification: Evaluates transformer monitoring applications extending from traditional electric utility assets to new sectors, including industrial companies, data centers, and other infrastructure requiring high amounts of energy
- Competitive Assessment: Provides detailed analysis of leading companies including GE Vernova (US), Schneider Electric (France), Siemens (Germany), Hitachi Energy Ltd. (Switzerland), Eaton (Ireland), Mistras Group (US), Vaisala (Finland), Reinhausen GmbH (Germany), Qualitrol Company LLC. (US), Doble Engineering Company (US), Dynamic Ratings (US), Camlin Energy (Ireland), TreeTech (Brazil), Rugged Monitoring (Canada), and H2scan (US), covering their product portfolios, strategic initiatives, technological capabilities, and competitive positioning
TABLE OF CONTENTS
1 INTRODUCTION
- 1.1 STUDY OBJECTIVES
- 1.2 MARKET DEFINITION
- 1.3 MARKET SCOPE
- 1.3.1 MARKET SEGMENTATION AND REGIONAL SCOPE
- 1.3.2 INCLUSIONS AND EXCLUSIONS
- 1.3.3 YEARS CONSIDERED
- 1.4 CURRENCY CONSIDERED
- 1.5 LIMITATIONS
- 1.6 STAKEHOLDERS
- 1.7 SUMMARY OF CHANGES
2 EXECUTIVE SUMMARY
- 2.1 MARKET HIGHLIGHTS AND KEY INSIGHTS
- 2.2 KEY MARKET PARTICIPANTS: MAPPING OF STRATEGIC DEVELOPMENTS
- 2.3 DISRUPTIVE TRENDS IN TRANSFORMER MONITORING MARKET
- 2.4 HIGH-GROWTH SEGMENTS
- 2.5 REGIONAL SNAPSHOT: MARKET SIZE, GROWTH RATE, AND FORECAST
3 PREMIUM INSIGHTS
- 3.1 ATTRACTIVE OPPORTUNITIES FOR PLAYERS IN TRANSFORMER MONITORING MARKET
- 3.2 TRANSFORMER MONITORING MARKET, BY COMPONENT AND REGION
- 3.3 TRANSFORMER MONITORING MARKET, BY COMPONENT
- 3.4 TRANSFORMER MONITORING MARKET, BY TYPE
- 3.5 TRANSFORMER MONITORING MARKET, BY APPLICATION
- 3.6 TRANSFORMER MONITORING MARKET, BY SERVICE
- 3.7 TRANSFORMER MONITORING MARKET, BY VOLTAGE RATING
- 3.8 TRANSFORMER MONITORING MARKET, BY INSTALLATION
- 3.9 TRANSFORMER MONITORING MARKET, BY END USER
- 3.10 TRANSFORMER MONITORING MARKET, BY COUNTRY
4 MARKET OVERVIEW
- 4.1 INTRODUCTION
- 4.2 MARKET DYNAMICS
- 4.2.1 DRIVERS
- 4.2.1.1 Increasing digitalization of utilities and adoption of digital substations and smart grids
- 4.2.1.2 Growing data center power demand and transformer deployment
- 4.2.1.3 Growing adoption of condition-based and predictive maintenance for transformers
- 4.2.2 RESTRAINTS
- 4.2.2.1 High initial investment and installation costs
- 4.2.2.2 Complex integration with existing infrastructure
- 4.2.3 OPPORTUNITIES
- 4.2.3.1 Growing adoption of big data analytics and cloud-based monitoring platforms
- 4.2.3.2 Growth of renewables
- 4.2.4 CHALLENGES
- 4.2.4.1 Cybersecurity and data protection risks
- 4.2.1 DRIVERS
- 4.3 UNMET NEEDS AND WHITE SPACES
- 4.4 INTERCONNECTED MARKETS AND CROSS-SECTOR OPPORTUNITIES
- 4.5 STRATEGIC MOVES BY TIER-1/2/3 PLAYERS
5 INDUSTRY TRENDS
- 5.1 PORTER'S FIVE FORCES ANALYSIS
- 5.1.1 INTENSITY OF COMPETITIVE RIVALRY
- 5.1.2 THREAT OF NEW ENTRANTS
- 5.1.3 BARGAINING POWER OF SUPPLIERS
- 5.1.4 BARGAINING POWER OF BUYERS
- 5.1.5 THREATS OF SUBSTITUTES
- 5.2 MACROECONOMIC OUTLOOK
- 5.2.1 INTRODUCTION
- 5.2.1.1 Increasing electricity demand and grid infrastructure expansion
- 5.2.1.2 Accelerating renewable energy integration
- 5.2.1.3 Growing digitalization of power infrastructure
- 5.2.2 GDP TRENDS AND FORECAST
- 5.2.3 TRENDS IN GLOBAL TRANSFORMER MONITORING INDUSTRY
- 5.2.1 INTRODUCTION
- 5.3 VALUE CHAIN ANALYSIS
- 5.3.1 RAW MATERIAL SUPPLIERS
- 5.3.2 COMPONENT MANUFACTURERS
- 5.3.3 TRANSFORMER MONITORING MANUFACTURERS
- 5.3.4 END USERS
- 5.3.5 POST-SALES SERVICE PROVIDERS
- 5.4 ECOSYSTEM ANALYSIS
- 5.5 PRICING ANALYSIS
- 5.5.1 AVERAGE SELLING PRICE TREND OF TRANSFORMER MONITORING SYSTEMS, BY APPLICATION, 2022-2025
- 5.5.2 AVERAGE SELLING PRICE TREND OF TRANSFORMER MONITORING SYSTEMS, BY REGION, 2022-2025
- 5.6 TRADE ANALYSIS
- 5.6.1 IMPORT SCENARIO (HS CODE 8504)
- 5.6.2 EXPORT SCENARIO (HS CODE 8504)
- 5.7 KEY CONFERENCES AND EVENTS, 2026-2027
- 5.8 TRENDS/DISRUPTIONS IMPACTING CUSTOMER BUSINESS
- 5.9 INVESTMENT AND FUNDING SCENARIO
- 5.10 CASE STUDY ANALYSIS
- 5.10.1 HITACHI ENERGY DIGITALIZED TRANSFORMER MONITORING FOR FORTUM'S HYDROPOWER PLANT
- 5.10.2 HITACHI ENERGY IMPLEMENTS ONLINE TRANSFORMER MONITORING FOR TATA STEEL
- 5.10.3 CAMLIN ENERGY DEPLOYS TRANSFORMER MONITORING FOR VATTENFALL RENEWABLES
- 5.11 IMPACT OF 2025 US TARIFF - TRANSFORMER MONITORING MARKET
- 5.11.1 INTRODUCTION
- 5.11.2 KEY TARIFF RATES
- 5.11.3 PRICE IMPACT ANALYSIS
- 5.11.4 IMPACT ON COUNTRIES/REGIONS
- 5.11.4.1 US
- 5.11.4.2 Europe
- 5.11.4.3 Asia Pacific
- 5.11.4.4 South America
- 5.11.4.5 Middle East & Africa
- 5.11.5 IMPACT ON END-USE INDUSTRIES
6 TECHNOLOGICAL ADVANCEMENTS, AI-DRIVEN IMPACT, PATENTS, INNOVATIONS, AND FUTURE APPLICATIONS
- 6.1 KEY TECHNOLOGIES
- 6.1.1 SENSORS AND INTERNET OF THINGS (IOT)
- 6.1.2 DATA ANALYTICS AND ARTIFICIAL INTELLIGENCE (AI)
- 6.2 COMPLEMENTARY TECHNOLOGIES
- 6.2.1 DIGITAL TWINS AND SIMULATION
- 6.2.2 CLOUD AND EDGE COMPUTING
- 6.3 TECHNOLOGY/PRODUCT ROADMAP
- 6.3.1 SHORT-TERM (2025-2027) | FOUNDATION & EARLY COMMERCIALIZATION
- 6.3.2 MID-TERM (2027-2030) | EXPANSION & STANDARDIZATION
- 6.3.3 LONG-TERM (2030+) | MASS COMMERCIALIZATION & DISRUPTION
- 6.4 PATENT ANALYSIS
- 6.5 FUTURE APPLICATIONS
- 6.6 IMPACT OF AI/GEN AI ON TRANSFORMER MONITORING MARKET
- 6.6.1 TOP USE CASES AND MARKET POTENTIAL
- 6.6.2 BEST PRACTICES FOLLOWED BY OEMS IN TRANSFORMER MONITORING MARKET
- 6.6.3 CASE STUDIES RELATED TO AI/GEN AI IMPLEMENTATION IN TRANSFORMER MONITORING MARKET
- 6.6.4 INTERCONNECTED ECOSYSTEM AND IMPACT ON MARKET PLAYERS
- 6.6.5 CLIENTS' READINESS TO ADOPT AI/GEN AI-INTEGRATED TRANSFORMER MONITORING
- 6.7 SUCCESS STORIES AND REAL-WORLD APPLICATIONS
- 6.7.1 GE VERNOVA: AI-ENABLED TRANSFORMER ASSET PERFORMANCE MANAGEMENT
- 6.7.2 SIEMENS ENERGY: AI-BASED TRANSFORMER CONDITION MONITORING
- 6.7.3 SCHNEIDER ELECTRIC: AI-ENABLED TRANSFORMER FLEET HEALTH MANAGEMENT
7 REGULATORY LANDSCAPE
- 7.1 REGIONAL REGULATIONS AND COMPLIANCE
- 7.1.1 REGULATORY BODIES, GOVERNMENT AGENCIES, AND OTHER ORGANIZATIONS
- 7.1.2 INDUSTRY STANDARDS
8 CUSTOMER LANDSCAPE AND BUYER BEHAVIOR
- 8.1 DECISION-MAKING PROCESS
- 8.2 KEY STAKEHOLDERS INVOLVED IN BUYING PROCESS AND THEIR EVALUATION CRITERIA
- 8.2.1 KEY STAKEHOLDERS IN BUYING PROCESS
- 8.2.2 BUYING CRITERIA
- 8.3 ADOPTION BARRIERS AND INTERNAL CHALLENGES
- 8.4 MARKET PROFITABILITY
- 8.4.1 REVENUE POTENTIAL
- 8.4.2 COST DYNAMICS
9 TRANSFORMER MONITORING MARKET, BY COMPONENT
- 9.1 INTRODUCTION
- 9.2 HARDWARE
- 9.2.1 RISING NEED FOR REAL-TIME CONDITION MONITORING AND ASSET LIFE EXTENSION TO DRIVE DEMAND
- 9.3 SOFTWARE
- 9.3.1 INCREASING ADOPTION OF IOT AND ADVANCED ANALYTICS TO ENABLE REAL-TIME MONITORING TO DRIVE MARKET
10 TRANSFORMER MONITORING MARKET, BY TYPE
- 10.1 INTRODUCTION
- 10.2 OIL-IMMERSED
- 10.2.1 INCREASING FOCUS ON REAL-TIME CONDITION MONITORING AND ASSET LIFE EXTENSION TO OPTIMIZE TRANSFORMER PERFORMANCE
- 10.3 CAST RESIN
- 10.3.1 GROWING ADOPTION OF REAL-TIME MONITORING TO ENHANCE RELIABILITY AND ASSET PERFORMANCE TO PROPEL MARKET
- 10.4 OTHER TYPES
11 TRANSFORMER MONITORING MARKET, BY APPLICATION
- 11.1 INTRODUCTION
- 11.2 POWER TRANSFORMERS
- 11.2.1 GROWING DEMAND FOR REAL-TIME MONITORING AND ASSET OPTIMIZATION TO ENHANCE POWER TRANSFORMER PERFORMANCE
- 11.3 DISTRIBUTION TRANSFORMERS
- 11.3.1 ACCELERATING GRID DIGITALIZATION AND RENEWABLE INTEGRATION TO DRIVE ADOPTION OF DISTRIBUTION TRANSFORMER MONITORING SOLUTIONS
- 11.4 OTHER APPLICATIONS
12 TRANSFORMER MONITORING MARKET, BY SERVICE
- 12.1 INTRODUCTION
- 12.2 DISSOLVED GAS ANALYSIS
- 12.2.1 INCREASING ADOPTION OF CONTINUOUS ONLINE DGA TO ENABLE EARLY FAULT DETECTION TO PROPEL MARKET
- 12.3 BUSHING MONITORING
- 12.3.1 RISING DEMAND FOR REAL-TIME BUSHING HEALTH ASSESSMENT TO STRENGTHEN TRANSFORMER RELIABILITY AND OPERATIONAL VISIBILITY
- 12.4 PARTIAL DISCHARGE MONITORING
- 12.4.1 INCREASING ADOPTION OF ONLINE PARTIAL DISCHARGE MONITORING TO STRENGTHEN INSULATION ASSESSMENT AND TRANSFORMER RELIABILITY
- 12.5 ON-LOAD TAP CHANGER MONITORING
- 12.5.1 RISING ADOPTION OF ADVANCED OLTC MONITORING TO ENHANCE VOLTAGE REGULATION AND OPTIMIZE TRANSFORMER PERFORMANCE
- 12.6 OTHER SERVICES
13 TRANSFORMER MONITORING MARKET, BY VOLTAGE RATING
- 13.1 INTRODUCTION
- 13.2 UP TO 36 KV
- 13.2.1 WIDELY USED IN DISTRIBUTION, COMMERCIAL, AND INDUSTRIAL APPLICATIONS REQUIRING LOWER VOLTAGE LEVELS
- 13.3 36-230 KV
- 13.3.1 WIDELY USED IN SUB-TRANSMISSION AND POWER TRANSMISSION NETWORKS TO SUPPORT RISING POWER DEMAND
- 13.4 ABOVE 230 KV
- 13.4.1 WIDELY DEPLOYED IN HIGH-VOLTAGE TRANSMISSION NETWORKS FOR LONG-DISTANCE POWER TRANSFER AND GRID INTERCONNECTION
14 TRANSFORMER MONITORING MARKET, BY INSTALLATION
- 14.1 INTRODUCTION
- 14.2 NEW
- 14.2.1 RISING DEPLOYMENT OF NEW TRANSFORMERS ACROSS EXPANDING POWER GRIDS TO DRIVE DEMAND
- 14.3 RETROFIT
- 14.3.1 INCREASING DIGITALIZATION OF AGING TRANSFORMER FLEETS TO DRIVE ADOPTION OF RETROFIT MONITORING SOLUTIONS
15 TRANSFORMER MONITORING MARKET, BY END USER
- 15.1 INTRODUCTION
- 15.2 POWER UTILITIES
- 15.2.1 EXPANDING POWER GRIDS AND RISING ELECTRICITY DEMAND TO DRIVE ADOPTION OF TRANSFORMER MONITORING SOLUTIONS
- 15.3 INDUSTRIAL
- 15.3.1 INCREASING TRANSFORMER DEPLOYMENT ACROSS ENERGY-INTENSIVE INDUSTRIES TO DRIVE DEMAND FOR CONDITION MONITORING SOLUTIONS
- 15.4 COMMERCIAL AND RESIDENTIAL
- 15.4.1 INCREASING DEPLOYMENT OF ELECTRICAL INFRASTRUCTURE ACROSS COMMERCIAL AND RESIDENTIAL FACILITIES TO SUPPORT DEMAND
- 15.5 DATA CENTERS
- 15.5.1 RAPID DATA CENTER EXPANSION AND RISING POWER DENSITY TO ACCELERATE DEMAND FOR REAL-TIME TRANSFORMER MONITORING SOLUTIONS
- 15.6 OTHER END USERS
16 TRANSFORMER MONITORING MARKET, BY REGION
- 16.1 INTRODUCTION
- 16.2 NORTH AMERICA
- 16.2.1 US
- 16.2.1.1 Rapid data center expansion, grid modernization, and aging transformers to drive market
- 16.2.2 CANADA
- 16.2.2.1 Aging grid infrastructure and renewable energy integration to propel market
- 16.2.3 MEXICO
- 16.2.3.1 Industrial modernization and grid infrastructure investments to support market growth
- 16.2.1 US
- 16.3 EUROPE
- 16.3.1 UK
- 16.3.1.1 Rising grid modernization, renewable integration, and aging transformer assets to accelerate market growth
- 16.3.2 FRANCE
- 16.3.2.1 Nuclear power infrastructure, grid modernization, and renewable integration to drive market growth
- 16.3.3 GERMANY
- 16.3.3.1 Industrial modernization and grid reliability to drive market
- 16.3.4 RUSSIA
- 16.3.4.1 Aging grid infrastructure, energy sector modernization, and harsh operating conditions to drive growth
- 16.3.5 ITALY
- 16.3.5.1 Grid modernization and renewable integration to strengthen transformer monitoring demand
- 16.3.6 REST OF EUROPE
- 16.3.1 UK
- 16.4 ASIA PACIFIC
- 16.4.1 CHINA
- 16.4.1.1 Renewable energy expansion, grid modernization, and reliability requirements to propel market
- 16.4.2 INDIA
- 16.4.2.1 Grid modernization, renewable integration, and aging transformer infrastructure to drive adoption
- 16.4.3 JAPAN
- 16.4.3.1 Aging grid assets, reliability requirements, and digitalization to strengthen adoption
- 16.4.4 SOUTH KOREA
- 16.4.4.1 Smart grid deployment and predictive asset diagnostics to drive market
- 16.4.5 AUSTRALIA
- 16.4.5.1 Grid resilience, distributed generation, and asset-life optimization to propel market
- 16.4.6 REST OF ASIA PACIFIC
- 16.4.1 CHINA
- 16.5 SOUTH AMERICA
- 16.5.1 BRAZIL
- 16.5.1.1 Renewable energy integration and aging transformer infrastructure to drive growth
- 16.5.2 ARGENTINA
- 16.5.2.1 Oil & gas infrastructure and grid reliability needs to support adoption
- 16.5.3 VENEZUELA
- 16.5.3.1 Aging grid infrastructure and reliability requirements to support market growth
- 16.5.4 REST OF SOUTH AMERICA
- 16.5.1 BRAZIL
- 16.6 MIDDLE EAST & AFRICA
- 16.6.1 GCC COUNTRIES
- 16.6.1.1 Saudi Arabia
- 16.6.1.1.1 Grid expansion, energy diversification, and industrial electrification to strengthen demand
- 16.6.1.2 UAE
- 16.6.1.2.1 Rising investments in solar energy generation to drive market growth
- 16.6.1.3 Qatar
- 16.6.1.3.1 Oil & gas expansion, grid modernization, and renewable energy integration to drive market
- 16.6.1.4 Rest of GCC countries
- 16.6.1.1 Saudi Arabia
- 16.6.2 ALGERIA
- 16.6.2.1 Growing power grid modernization and oil & gas infrastructure to drive market
- 16.6.3 IRAN
- 16.6.3.1 Aging grid infrastructure and renewable energy integration to drive market growth
- 16.6.4 SOUTH AFRICA
- 16.6.4.1 Growing power generation and grid reliability requirements to accelerate adoption
- 16.6.5 REST OF MIDDLE EAST & AFRICA
- 16.6.1 GCC COUNTRIES
17 COMPETITIVE LANDSCAPE
- 17.1 OVERVIEW
- 17.2 KEY PLAYER COMPETITIVE STRATEGIES/RIGHT TO WIN, JANUARY 2023-AUGUST 2026
- 17.3 MARKET SHARE ANALYSIS, 2025
- 17.4 REVENUE ANALYSIS, 2021-2025
- 17.5 BRAND COMPARISON
- 17.5.1 GE VERNOVA (US)
- 17.5.2 SIEMENS ENERGY (GERMANY)
- 17.5.3 SCHNEIDER ELECTRIC (FRANCE)
- 17.5.4 EATON (IRELAND)
- 17.5.5 VAISALA (FINLAND)
- 17.6 COMPANY EVALUATION MATRIX: KEY PLAYERS, 2025
- 17.6.1 STARS
- 17.6.2 EMERGING LEADERS
- 17.6.3 PERVASIVE PLAYERS
- 17.6.4 PARTICIPANTS
- 17.6.5 COMPANY FOOTPRINT: KEY PLAYERS, 2025
- 17.6.5.1 Company footprint
- 17.6.5.2 Region footprint
- 17.6.5.3 Component footprint
- 17.6.5.4 Service footprint
- 17.6.5.5 End-user footprint
- 17.7 COMPANY EVALUATION MATRIX: STARTUPS/SMES, 2025
- 17.7.1 PROGRESSIVE COMPANIES
- 17.7.2 RESPONSIVE COMPANIES
- 17.7.3 DYNAMIC COMPANIES
- 17.7.4 STARTING BLOCKS
- 17.7.5 COMPETITIVE BENCHMARKING: STARTUPS/SMES, 2025
- 17.7.5.1 Detailed list of key startups/SMEs
- 17.7.5.2 Competitive benchmarking of key startups/SMEs
- 17.8 COMPANY VALUATION AND FINANCIAL METRICS
- 17.9 COMPETITIVE SCENARIO
- 17.9.1 PRODUCT LAUNCHES
- 17.9.2 DEALS
- 17.9.3 EXPANSIONS
18 COMPANY PROFILES
- 18.1 KEY PLAYERS
- 18.1.1 GE VERNOVA
- 18.1.1.1 Business overview
- 18.1.1.2 Products/Solutions/Services offered
- 18.1.1.3 Recent developments
- 18.1.1.3.1 Product launches
- 18.1.1.3.2 Deals
- 18.1.1.4 MnM view
- 18.1.1.4.1 Key strengths/Right to win
- 18.1.1.4.2 Strategic choices
- 18.1.1.4.3 Weaknesses/Competitive threats
- 18.1.2 SCHNEIDER ELECTRIC
- 18.1.2.1 Business overview
- 18.1.2.2 Products/Solutions/Services offered
- 18.1.2.3 Recent developments
- 18.1.2.3.1 Product Launches
- 18.1.2.3.2 Deals
- 18.1.2.4 MnM view
- 18.1.2.4.1 Key strengths/Right to win
- 18.1.2.4.2 Strategic choices
- 18.1.2.4.3 Weaknesses/Competitive threats
- 18.1.3 SIEMENS ENERGY
- 18.1.3.1 Business overview
- 18.1.3.2 Products/Solutions/Services offered
- 18.1.3.3 Recent developments
- 18.1.3.3.1 Deals
- 18.1.3.3.2 Expansions
- 18.1.3.4 MnM view
- 18.1.3.4.1 Key strengths/Right to win
- 18.1.3.4.2 Strategic choices
- 18.1.3.4.3 Weaknesses/Competitive threats
- 18.1.4 EATON
- 18.1.4.1 Business overview
- 18.1.4.2 Products/Solutions/Services offered
- 18.1.4.3 Recent developments
- 18.1.4.3.1 Deals
- 18.1.4.3.2 Expansions
- 18.1.4.4 MnM view
- 18.1.4.4.1 Key strengths/Right to win
- 18.1.4.4.2 Strategic choices
- 18.1.4.4.3 Weaknesses/Competitive threats
- 18.1.5 VAISALA
- 18.1.5.1 Business overview
- 18.1.5.2 Products/Solutions/Services offered
- 18.1.5.2.1 Product Launches
- 18.1.5.3 MnM view
- 18.1.5.3.1 Key strengths/Right to win
- 18.1.5.3.2 Strategic choices
- 18.1.5.3.3 Weaknesses/Competitive threats
- 18.1.6 MISTRAS GROUP
- 18.1.6.1 Business overview
- 18.1.6.2 Products/Solutions/Services offered
- 18.1.6.3 Recent developments
- 18.1.6.3.1 Product launches
- 18.1.7 HITACHI ENERGY LTD.
- 18.1.7.1 Business overview
- 18.1.7.2 Products/Solutions/Services offered
- 18.1.7.3 Recent developments
- 18.1.7.3.1 Product launches
- 18.1.7.3.2 Expansions
- 18.1.8 REINHAUSEN GMBH
- 18.1.8.1 Business overview
- 18.1.8.2 Products/Solutions/Services offered
- 18.1.8.3 Recent Developments
- 18.1.8.3.1 Deals
- 18.1.8.3.2 Expansions
- 18.1.9 QUALITROL COMPANY LLC
- 18.1.9.1 Business overview
- 18.1.9.2 Products/Solutions/Services offered
- 18.1.9.3 Recent developments
- 18.1.9.3.1 Product launches
- 18.1.10 DOBLE ENGINEERING COMPANY
- 18.1.10.1 Business overview
- 18.1.10.2 Products/Solutions/Services offered
- 18.1.10.3 Recent developments
- 18.1.10.3.1 Product launches
- 18.1.10.3.2 Expansions
- 18.1.10.3.3 Deals
- 18.1.11 DYNAMIC RATINGS
- 18.1.11.1 Business overview
- 18.1.11.2 Products/Solutions/Services offered
- 18.1.11.3 Recent developments
- 18.1.11.3.1 Product launches
- 18.1.11.3.2 Expansions
- 18.1.11.3.3 Deals
- 18.1.12 CAMLIN ENERGY
- 18.1.12.1 Business overview
- 18.1.12.2 Products/Solutions/Services offered
- 18.1.12.3 Recent developments
- 18.1.12.3.1 Deals
- 18.1.13 MTE METER TEST EQUIPMENT AG
- 18.1.13.1 Business overview
- 18.1.13.2 Products/Solutions/Services offered
- 18.1.14 H2SCAN
- 18.1.14.1 Business overview
- 18.1.14.2 Products/Solutions/Services offered
- 18.1.14.3 Recent developments
- 18.1.14.3.1 Product launches
- 18.1.15 FRANKLIN ELECTRIC GRID SOLUTIONS
- 18.1.15.1 Business overview
- 18.1.15.2 Products/Solutions/Services offered
- 18.1.1 GE VERNOVA
- 18.2 OTHER PLAYERS
- 18.2.1 TREETECH
- 18.2.2 EMCO ELECTRONICS
- 18.2.3 ADVANCED POWER TECHNOLOGIES
- 18.2.4 RUGGED MONITORING
- 18.2.5 EDGE ZERO
- 18.2.6 MEGGER
- 18.2.7 NINGBO LIGONG ENVIRONMENT AND ENERGY TECHNOLOGY CO., LTD.
- 18.2.8 HAOMAI ELECTRIC TEST EQUIPMENT CO., LTD.
- 18.2.9 CREATIVE MICRO SYSTEMS
- 18.2.10 INFOLECH
19 RESEARCH METHODOLOGY
- 19.1 RESEARCH DATA
- 19.1.1 SECONDARY DATA
- 19.1.1.1 List of major secondary sources
- 19.1.1.2 Key data from secondary sources
- 19.1.2 PRIMARY DATA
- 19.1.2.1 List of primary interview participants
- 19.1.2.2 Key industry insights
- 19.1.2.3 Breakdown of primaries
- 19.1.2.4 Key data from primary sources
- 19.1.1 SECONDARY DATA
- 19.2 DATA TRIANGULATION
- 19.3 MARKET SIZE ESTIMATION
- 19.3.1 BOTTOM-UP APPROACH
- 19.3.2 TOP-DOWN APPROACH
- 19.4 DEMAND-SIDE ANALYSIS
- 19.4.1 ASSUMPTIONS FOR DEMAND-SIDE ANALYSIS
- 19.4.2 CALCULATIONS FOR DEMAND-SIDE ANALYSIS
- 19.5 SUPPLY-SIDE ANALYSIS
- 19.5.1 ASSUMPTIONS FOR SUPPLY-SIDE ANALYSIS
- 19.5.2 CALCULATIONS FOR SUPPLY-SIDE ANALYSIS
- 19.6 GROWTH FORECAST ASSUMPTIONS
- 19.7 RESEARCH LIMITATIONS
- 19.8 RISK ASSESSMENT
20 APPENDIX
- 20.1 DISCUSSION GUIDE
- 20.2 KNOWLEDGE STORE: MARKETSANDMARKETS' SUBSCRIPTION PORTAL
- 20.3 CUSTOMIZATION OPTIONS
- 20.4 RELATED REPORTS
- 20.5 AUTHOR DETAILS


