


|
시장보고서
상품코드
1687212
드라이믹스 모르타르 시장 : 시장 점유율 분석, 산업 동향 및 통계, 성장 예측(2025-2030년)Dry Mix Mortar - Market Share Analysis, Industry Trends & Statistics, Growth Forecasts (2025 - 2030) |
||||||
■ 보고서에 따라 최신 정보로 업데이트하여 보내드립니다. 배송일정은 문의해 주시기 바랍니다.
드라이믹스 모르타르 시장 규모는 2024년에 3억 5,093만 톤으로 추정되고, 2030년에는 4억 8,216만 톤에 이를 것으로 예측되며, 예측 기간(2024-2030년) 중 CAGR 5.44%로 성장할 전망입니다.
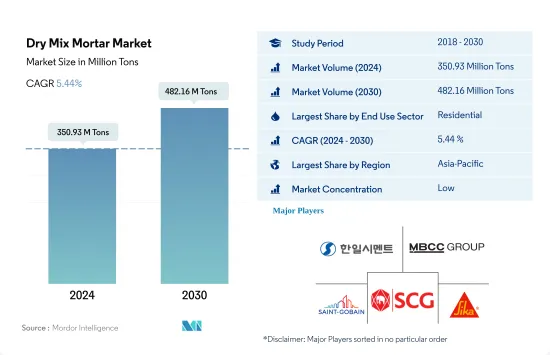
인도의 A등급 오피스 등 신흥국에서의 상업 시설 건설이 증가하고 있으며 2030년에는 12억 평방피트에 이를 것으로 예상되어 시장 성장을 촉진합니다.
- 2022년 드라이믹스 모르타르의 세계소비량은 0.64%라는 완만한 성장률을 보였으나 이는 인프라 및 상업 건설 부문 수요 증가에 따른 것입니다. 특히 2022년 인프라 부문과 상업 부문의 성장률은 2021년과 비교해 각각 3.42%와 1.0%였습니다. 세계의 드라이믹스 모르타르 시장은 2023년에 약 4.29% 성장할 것으로 예측되었습니다.
- 2022년의 점유율은 62.34%로 주택 부문이 드라이믹스 몰탈의 최대 소비자로 되어 있습니다. 도시화, 정부의 대처, 국내외 투자 등의 요인이 주택 수요를 부추겨 주택 건설의 급증으로 이어지고 있습니다. 예를 들어 독일에서는 2024년까지 최소 4,000호의 주택을 새로 건설하기로 되어 있으며 말레이시아 정부는 2025년까지 약 50만 호의 저렴한 주택을 건설하는 것을 목표로 하고 있습니다. 그 결과 주택 분야의 드라이믹스 모르타르 시장은 2023-2030년 CAGR 5.43%로 성장할 것으로 예측되고 있습니다.
- 상업 부문은 드라이 믹스 박격포의 소비자로 가장 급성장하고 있으며 CAGR은 6.52%로 예측됩니다. 이러한 급증은 쇼핑몰, 사무실 공간 및 기타 상업 구조물에 대한 수요 증가에 따른 것입니다. 이 동향을 부각시키는 것처럼 인도 상위 7개 도시의 A등급 오피스 시장은 2026년까지 약 10억 평방 피트로 확대되고 2030년까지 12억 평방 피트로 확대될 것으로 예상됩니다. 또 세계 상업 시설의 신설 바닥 면적은 2023년에 비해 2030년에는 25억 평방피트로 대폭 증가할 것으로 예측되고 있습니다. 그 결과 세계 업무용 드라이믹스 모르타르 소비량은 2023-2030년 1억 4,900만 톤 증가할 것으로 추정됩니다.
아시아태평양과 남미의 급속한 건설 활동이 드라이믹스 모르타르의 수요를 끌어올릴 것으로 예측됩니다.
- 드라이믹스 모르타르는 상업건축 및 주택건축 모두에서 중요한 역할을 하고 있으며, 스태코, 그라우트, 타일 접착제, 줄눈 충전제 등에서 용도를 찾아내고 있습니다. 2022년 세계의 드라이믹스 모르타르 시장은 수량 기준으로 0.64%의 꾸준한 성장을 기록했는데, 이는 인플레이션, 원료비 급등, 임박한 경기후퇴 등의 요인으로 인한 둔화였습니다. 이러한 과제는 건설 투자의 침체와 프로젝트의 지연을 초래하여 드라이믹스 모르타르의 수요를 감쇠시켰습니다. 그러나 2022-2023년 수량 성장률은 4.95%로 평가되었으며, 북미 시장이 주도할 태세여서 회복이 예측됩니다.
- 아시아태평양은 2022년 드라이믹스 모르타르 시장에서 압도적인 지위를 차지해 세계 점유율의 1억 3,000만 톤을 크게 차지했습니다. 특기할 만한 것은 중국, 일본, 인도 등의 국가들이 이 수요의 형성에 매우 중요한 역할을 했다는 점입니다. 2022년 중국의 교통 인프라에 대한 공공 지출은 2021년 1,576억 달러에서 1,656억 달러로 증가했습니다. 일본은 제조시설 건설이 급증했고, 인도는 교통망 강화와 저렴한 주택 제공을 목표로 건설 분야 확대에 박차를 가했다.
- 아시아태평양은 드라이믹스 모르타르의 수량으로 CAGR 6.09%로 성장을 지속하고, 가장 높은 성장률을 기록하는 전망입니다. 남미가 근소한 차이로 계속되며 예측 기간 동안 CAGR 5.54%로 전망됩니다. 정부와 외국 투자가 주요 프로젝트를 지원하는 가운데 주택, 인프라, 상업 건설 분야의 번영이 전망되어 드라이믹스 모르타르의 수요를 견인하고 있습니다.
세계 드라이믹스 모르타르 시장 동향
아시아태평양의 대규모 오피스 빌딩 건설 프로젝트의 급증으로 세계 상업 건축 전용 바닥 면적이 증가할 전망
- 2022년 세계 상업 건축용 신설 바닥 면적은 전년대비 0.15% 증가하고 소폭 성장에 머물렀습니다. 유럽은 12.70%의 대폭적인 성장으로 두드러지고 있으며, 이는 2030년의 이산화탄소 배출 목표에 맞추어 에너지 효율이 높은 오피스 빌딩을 추진하는 움직임이 원동력이 되고 있습니다. 직원들의 사무실 복귀에 따라 유럽 기업들은 리스 계약을 재개했고, 2022년에는 450만 평방피트의 신규 사무실 건설에 박차를 가했다. 이 기세는 2023년에도 계속되어 세계 성장률은 4.26%로 평가되었습니다.
- COVID-19의 유행은 노동력과 자재 부족을 일으켜 상업시설 건설 프로젝트의 취소와 지연을 초래했습니다. 그러나 폐쇄가 완화되고 건설 활동이 재개되면서 2021년 세계 상업 시설의 신설 바닥 면적은 11.11% 급증했고, 아시아 태평양이 20.98%의 성장률로 앞섰습니다.
- 향후 세계 상업 시설의 신설 바닥 면적의 CAGR은 4.56%가 될 것입니다. 아시 태평양의 CAGR은 5.16%로 예측되어 타 지역을 능가할 것으로 예상됩니다. 이 성장의 원동력이 되고 있는 것은 중국, 인도, 한국, 일본에 있어서의 상업 시설 건설 프로젝트의 활발화입니다. 특히 베이징, 상하이, 홍콩, 타이베이와 같은 중국의 주요 도시에서는 A등급 사무실 공간 건설이 가속화되고 있습니다. 게다가 인도에서는 2023-2025년 상위 7개 도시에서 약 2,325만 평방 피트에 이르는 약 60개의 쇼핑몰이 오픈할 예정입니다. 아시아태평양 전역의 이러한 대처를 합계하면, 2030년까지 상업 시설의 신규 바닥 면적은 2022년 대비 15억 6,000만 평방 피트 증가할 것으로 예상됩니다.
세계의 주택 부문을 뒷받침하는 저렴한 주택 계획에 대한 정부 투자 증가로 남미의 주택 건설이 가장 빠르게 성장할 것으로 추정됩니다.
- 2022년 세계 주택건축의 신규 바닥면적은 2021년 대비 약 2억 8,900만 평방피트 감소했습니다. 이는 토지 부족, 노동력 부족, 건설 자재 가격의 지속 불가능한 급등으로 인해 발생한 주택 위기에 기인합니다. 이 위기는 아시아 태평양에 심각한 영향을 미쳐 2022년 신설 바닥 면적은 2021년 대비 5.39% 감소했습니다. 그러나 2023년에는 2030년까지 30억 명을 수용할 수 있는 저렴한 주택을 새로 건설하기 위한 자금을 제공할 수 있는 정부 투자로 세계 신설 면적은 2022년 대비 3.31% 증가할 것으로 예측돼 보다 밝은 전망이 기대됩니다.
- COVID-19의 유행은 경기 감속을 일으켜, 그 때문에 많은 주택 건설 프로젝트가 중지 또는 연기되어 2020년 세계의 신설 바닥 면적은 2019년에 비해 4.79% 감소했습니다. 2021년 규제가 풀리면서 주택 프로젝트에 대한 침체된 수요가 해방되자 신설 바닥 면적은 2020년 대비 11.22% 증가했고, 유럽이 18.28%로 가장 높은 증가세를 보였으며, 이어 남미가 2021년에 2020년 대비 17.36% 증가했습니다.
- 세계의 주택용 신설 바닥 면적은 예측 기간 동안 CAGR 3.81%로 성장을 지속하고, 남미가 가장 빠른 CAGR 4.05%로 발전할 것으로 예측됩니다. 2023년에 발표된 브라질의 Minha Casa Minha Vida와 같은 계획과 이니셔티브는 몇 가지 규제 변경과 함께 발표되었으며, 정부는 저소득 가구에 저렴한 주택을 제공하기 위해 19억 8,000만 달러의 투자를 계획하고 있으며, 칠레의 FOGAES도 2023년에 발표되었으며, 초기 투자액은 5,000만 달러입니다.
드라이믹스 모르타르 산업 개요
드라이믹스 모르타르 시장은 세분화되어 있으며 상위 5개사에서 11.78%를 차지하고 있습니다. 이 시장의 주요 기업은 HANIL HOLDINGS, MBCC Group, Saint-Gobain, SCG, Sika AG 등입니다.
기타 혜택
- 엑셀 형식 시장 예측(ME) 시트
- 3개월의 애널리스트 서포트
목차
제1장 주요 요약 및 주요 조사 결과
제2장 보고서 제안
제3장 서문
- 조사의 전제조건 및 시장 정의
- 조사 범위
- 조사 방법
제4장 주요 산업 동향
- 최종 용도 부문의 동향
- 상업
- 산업 및 시설
- 인프라
- 주택용
- 주요 인프라 프로젝트(현재로 발표됨)
- 규제 프레임워크
- 밸류체인 및 유통채널 분석
제5장 시장 세분화
- 최종 용도 부문별
- 상업
- 산업 및 시설
- 인프라
- 주택용
- 용도별
- 콘크리트 보호 및 개수
- 그라우트
- 단열 및 마무리 시스템
- 석고
- 렌더
- 타일 접착제
- 방수 슬러리
- 기타
- 지역별
- 아시아태평양
- 국가별
- 호주
- 중국
- 인도
- 인도네시아
- 일본
- 말레이시아
- 한국
- 태국
- 베트남
- 기타 아시아태평양
- 유럽
- 국가별
- 프랑스
- 독일
- 이탈리아
- 러시아
- 스페인
- 영국
- 기타 유럽
- 중동 및 아프리카
- 국가별
- 사우디아라비아
- 아랍에미리트(UAE)
- 기타 중동 및 아프리카
- 북미
- 국가별
- 캐나다
- 멕시코
- 미국
- 남미
- 국가별
- 아르헨티나
- 브라질
- 기타 남미
- 아시아태평양
제6장 경쟁 구도
- 주요 전략 동향
- 시장 점유율 분석
- 기업 상황
- 기업 프로파일
- Ardex Group
- CEMEX, SAB de CV
- Grupo Puma
- HANIL HOLDINGS CO.,LTD.
- Holcim
- LATICRETE International, Inc.
- MAPEI SpA
- MBCC Group
- Saint-Gobain
- SAMPYO GROUP
- SCG
- SIG
- Sika AG
- UltraTech Cement Ltd.
- Votorantim Cimentos
제7장 CEO에 대한 주요 전략적 질문
제8장 부록
- 세계 개요
- 개요
- Porter's Five Forces 분석 프레임워크(산업 매력도 분석)
- 세계의 밸류체인 분석
- 시장 역학(DROs)
- 정보원 및 참고문헌
- 도표 일람
- 주요 인사이트
- 데이터 팩
- 용어집
The Dry Mix Mortar Market size is estimated at 350.93 million Tons in 2024, and is expected to reach 482.16 million Tons by 2030, growing at a CAGR of 5.44% during the forecast period (2024-2030).

Growing commercial constructions in emerging countries, such as India's Grade A office, are expected to reach 1.2 billion square feet by 2030, augmenting the market's growth
- In 2022, global consumption of dry mix mortar saw a modest growth rate of 0.64%, driven by heightened demand from the infrastructure and commercial construction sectors. Notably, the infrastructure and commercial sectors saw growth rates of 3.42% and 1.0%, respectively, in 2022, compared to 2021. The global dry mix mortar market was projected to grow by approximately 4.29% in 2023.
- With a share of 62.34% in 2022, the residential sector stands as the largest consumer of dry mix mortar. Factors such as urbanization, government initiatives, and both foreign and domestic investments are fueling the demand for housing, leading to a surge in residential building construction. For example, Germany is set to construct a minimum of 4.0 thousand new housing units by 2024, while the Malaysian government aims to build around 500 thousand affordable housing units by 2025. Consequently, the dry mix mortar market for the residential sector is projected to witness a CAGR of 5.43% from 2023 to 2030.
- The commercial sector is poised to be the fastest-growing consumer of dry mix mortar, with a forecasted CAGR of 6.52%. This surge is attributed to the rising demand for shopping malls, office spaces, and other commercial structures. Highlighting this trend, India's Grade A office market in its top seven cities is expected to expand to approximately 1 billion square feet by 2026 and further to 1.2 billion square feet by 2030. In addition, the global commercial new floor area is projected to witness a substantial increase of 2.50 billion sq. ft. in 2030 compared to 2023. As a result, the global dry mix mortar consumption for the commercial sector is estimated to rise by 149 million tons from 2023 to 2030.
Fast-paced construction activities in the Asia-Pacific and South America predicted to bolster the demand for dry-mix mortar
- Dry-mix mortar plays a crucial role in both commercial and residential construction, finding applications in stucco, grouts, tile adhesives, and joint fillers. In 2022, the global dry-mix mortar market recorded a modest 0.64% growth in volume, a slowdown attributed to factors like inflation, surging raw material costs, and an impending recession. These challenges led to a dip in construction investments and project delays, dampening the demand for dry-mix mortar. However, a rebound was predicted, with the North American market poised to lead the way, projecting a 4.95% growth in volume from 2022 to 2023.
- Asia-Pacific held a dominant position in the dry-mix mortar market in 2022, accounting for a significant 130 million tons of the global share. Notably, countries like China, Japan, and India played pivotal roles in shaping this demand. In 2022, China's public spending on transport infrastructure rose to USD 165.6 billion, up from USD 157.6 billion in 2021. Japan witnessed a surge in manufacturing facility constructions, while India aimed to bolster its transportation network and provide affordable housing, fueling the construction sector's expansion.
- The Asia-Pacific region is poised to witness the highest growth rate, registering a CAGR of 6.09% in dry-mix mortar volume. South America follows closely, registering a CAGR of 5.54% during the forecast period. With governments and foreign investments backing major projects, the residential, infrastructure, and commercial construction sectors are expected to flourish, driving the demand for dry-mix mortar.
Global Dry Mix Mortar Market Trends
Asia-Pacific's surge in large-scale office building projects is set to elevate the global floor area dedicated to commercial construction
- In 2022, the global new floor area for commercial construction witnessed a modest growth of 0.15% from the previous year. Europe stood out with a significant surge of 12.70%, driven by a push for high-energy-efficient office buildings to align with its 2030 carbon emission targets. As employees returned to offices, European companies, resuming lease decisions, spurred the construction of 4.5 million square feet of new office space in 2022. This momentum is poised to persist in 2023, with a projected global growth rate of 4.26%.
- The COVID-19 pandemic caused labor and material shortages, leading to cancellations and delays in commercial construction projects. However, as lockdowns eased and construction activities resumed, the global new floor area for commercial construction surged by 11.11% in 2021, with Asia-Pacific taking the lead with a growth rate of 20.98%.
- Looking ahead, the global new floor area for commercial construction is set to achieve a CAGR of 4.56%. Asia-Pacific is anticipated to outpace other regions, with a projected CAGR of 5.16%. This growth is fueled by a flurry of commercial construction projects in China, India, South Korea, and Japan. Notably, major Chinese cities like Beijing, Shanghai, Hong Kong, and Taipei are gearing up for an uptick in Grade A office space construction. Additionally, India is set to witness the opening of approximately 60 shopping malls, spanning 23.25 million square feet, in its top seven cities between 2023 and 2025. Collectively, these endeavors across Asia-Pacific are expected to add a staggering 1.56 billion square feet to the new floor area for commercial construction by 2030, compared to 2022.
South America's estimated fastest growth in residential constructions due to increasing government investments in schemes for affordable housing to boost the global residential sector
- In 2022, the global new floor area for residential construction declined by around 289 million square feet compared to 2021. This can be attributed to the housing crisis generated due to the shortage of land, labor, and unsustainably high construction materials prices. This crisis severely impacted Asia-Pacific, where the new floor area declined 5.39% in 2022 compared to 2021. However, a more positive outlook is expected in 2023 as the global new floor area is predicted to grow by 3.31% compared to 2022, owing to government investments that can finance the construction of new affordable homes capable of accommodating 3 billion people by 2030.
- The COVID-19 pandemic caused an economic slowdown, due to which many residential construction projects got canceled or delayed, and the global new floor area declined by 4.79% in 2020 compared to 2019. As the restrictions were lifted in 2021 and pent-up demand for housing projects was released, new floor area grew 11.22% compared to 2020, with Europe having the highest growth of 18.28%, followed by South America, which rose 17.36% in 2021 compared to 2020.
- The global new floor area for residential construction is expected to register a CAGR of 3.81% during the forecast period, with South America predicted to develop at the fastest CAGR of 4.05%. Schemes and initiatives like the Minha Casa Minha Vida in Brazil announced in 2023 with a few regulatory changes, for which the government plans an investment of USD 1.98 billion to provide affordable housing units for low-income families, and the FOGAES in Chile also publicized in 2023, with an initial investment of USD 50 million, are aimed at providing mortgage loans to families for affordable housing and will encourage the construction of new residential units.
Dry Mix Mortar Industry Overview
The Dry Mix Mortar Market is fragmented, with the top five companies occupying 11.78%. The major players in this market are HANIL HOLDINGS CO.,LTD., MBCC Group, Saint-Gobain, SCG and Sika AG (sorted alphabetically).
Additional Benefits:
- The market estimate (ME) sheet in Excel format
- 3 months of analyst support
TABLE OF CONTENTS
1 EXECUTIVE SUMMARY & KEY FINDINGS
2 REPORT OFFERS
3 INTRODUCTION
- 3.1 Study Assumptions & Market Definition
- 3.2 Scope of the Study
- 3.3 Research Methodology
4 KEY INDUSTRY TRENDS
- 4.1 End Use Sector Trends
- 4.1.1 Commercial
- 4.1.2 Industrial and Institutional
- 4.1.3 Infrastructure
- 4.1.4 Residential
- 4.2 Major Infrastructure Projects (current And Announced)
- 4.3 Regulatory Framework
- 4.4 Value Chain & Distribution Channel Analysis
5 MARKET SEGMENTATION (includes market size, forecasts up to 2030 and analysis of growth prospects.)
- 5.1 End Use Sector
- 5.1.1 Commercial
- 5.1.2 Industrial and Institutional
- 5.1.3 Infrastructure
- 5.1.4 Residential
- 5.2 Application
- 5.2.1 Concrete Protection and Renovation
- 5.2.2 Grouts
- 5.2.3 Insulation and Finishing Systems
- 5.2.4 Plaster
- 5.2.5 Render
- 5.2.6 Tile Adhesive
- 5.2.7 Water Proofing Slurries
- 5.2.8 Other Applications
- 5.3 Region
- 5.3.1 Asia-Pacific
- 5.3.1.1 By Country
- 5.3.1.1.1 Australia
- 5.3.1.1.2 China
- 5.3.1.1.3 India
- 5.3.1.1.4 Indonesia
- 5.3.1.1.5 Japan
- 5.3.1.1.6 Malaysia
- 5.3.1.1.7 South Korea
- 5.3.1.1.8 Thailand
- 5.3.1.1.9 Vietnam
- 5.3.1.1.10 Rest of Asia-Pacific
- 5.3.2 Europe
- 5.3.2.1 By Country
- 5.3.2.1.1 France
- 5.3.2.1.2 Germany
- 5.3.2.1.3 Italy
- 5.3.2.1.4 Russia
- 5.3.2.1.5 Spain
- 5.3.2.1.6 United Kingdom
- 5.3.2.1.7 Rest of Europe
- 5.3.3 Middle East and Africa
- 5.3.3.1 By Country
- 5.3.3.1.1 Saudi Arabia
- 5.3.3.1.2 United Arab Emirates
- 5.3.3.1.3 Rest of Middle East and Africa
- 5.3.4 North America
- 5.3.4.1 By Country
- 5.3.4.1.1 Canada
- 5.3.4.1.2 Mexico
- 5.3.4.1.3 United States
- 5.3.5 South America
- 5.3.5.1 By Country
- 5.3.5.1.1 Argentina
- 5.3.5.1.2 Brazil
- 5.3.5.1.3 Rest of South America
- 5.3.1 Asia-Pacific
6 COMPETITIVE LANDSCAPE
- 6.1 Key Strategic Moves
- 6.2 Market Share Analysis
- 6.3 Company Landscape
- 6.4 Company Profiles
- 6.4.1 Ardex Group
- 6.4.2 CEMEX, S.A.B. de C.V.
- 6.4.3 Grupo Puma
- 6.4.4 HANIL HOLDINGS CO.,LTD.
- 6.4.5 Holcim
- 6.4.6 LATICRETE International, Inc.
- 6.4.7 MAPEI S.p.A.
- 6.4.8 MBCC Group
- 6.4.9 Saint-Gobain
- 6.4.10 SAMPYO GROUP
- 6.4.11 SCG
- 6.4.12 SIG
- 6.4.13 Sika AG
- 6.4.14 UltraTech Cement Ltd.
- 6.4.15 Votorantim Cimentos
7 KEY STRATEGIC QUESTIONS FOR CONCRETE, MORTARS AND CONSTRUCTION CHEMICALS CEOS
8 APPENDIX
- 8.1 Global Overview
- 8.1.1 Overview
- 8.1.2 Porter's Five Forces Framework (Industry Attractiveness Analysis)
- 8.1.3 Global Value Chain Analysis
- 8.1.4 Market Dynamics (DROs)
- 8.2 Sources & References
- 8.3 List of Tables & Figures
- 8.4 Primary Insights
- 8.5 Data Pack
- 8.6 Glossary of Terms


샘플 요청 목록