
|
시장보고서
상품코드
1693529
북미의 특수 비료 시장 : 점유율 분석, 산업 동향, 성장 예측(2025-2030년)North America Specialty Fertilizer - Market Share Analysis, Industry Trends & Statistics, Growth Forecasts (2025 - 2030) |
||||||
북미의 특수 비료 시장 규모는 2025년에 108억 5,000만 달러, 2030년에는 143억 9,000만 달러에 이를 것으로 예측되며, 예측 기간 중(2025-2030년) CAGR은 5.81%를 나타낼 전망입니다.
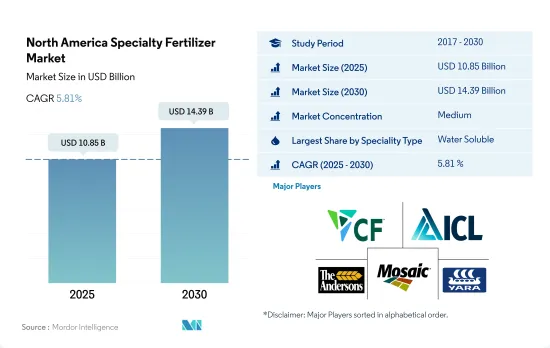
광범위한 영양 등급과 다양한 적용 방법이 있기 때문에 시장은 수용성 비료가 지배적입니다.
- 2022년에는 수용성 비료가 북미의 특수 비료 시장에서 최대 점유율을 차지했으며 47.9%를 차지했습니다. 드나 잎면 살포나 시비 등의 시용 방법에 의해 좌우됩니다.
- 액체 비료는 2022년에 45.9%로 두 번째 시장 점유율을 확보했습니다. 이 비료는 토양의 pH 수준을 유지하는 데 도움이 될 뿐만 아니라 환경보호론자와 농업 종사자 모두에게 중요한 문제인 질소의 용출에 관한 우려에도 대처할 수 있습니다.
- 방출제어비료는 시장 점유율 4.9%로 미미하지만 정밀농업에 있어서 매우 중요한 역할을 하고 있습니다.
- 2022년에는 미국이 북미의 특수 비료 시장의 67.1%로 큰 비율을 차지했습니다. 조사기간 중 미국에서는 엽면 살포와 관개가 강하게 선호되고 있는 것이 밝혀졌지만, 이것은 이 나라의 관개 인프라가 잘 정비되어 있는 것에 기인하는 동향입니다.
- 관개 시스템이 발달하여 밭작물, 잔디, 관엽 식물에 대한 수요가 성장하고 있기 때문에 미국의 특수 비료 시장은 향후 수년간 성장할 전망입니다.
미국은 개발된 농업 시스템과 국가 전체의 경작 면적의 크기에 따라 시장을 독점하고 있습니다.
- 2022년 미국은 북미의 특수 비료 시장에서 압도적인 지위를 차지했습니다. 시장 점유율은 수용성 비료가 48.0%, 액체 비료가 46.3%, CRF가 5.1%였습니다. 곡류 등의 주요 작물에서의 채용이 제한되어 있기 때문입니다.
- 북미에서는 캐나다가 2위의 특수 비료 시장을 가지고 미국이 그에 이어 2023-2030년에 걸쳐 캐나다의 특수 비료 시장은 CAGR은 6.4%를 보일 것으로 예측되고 있습니다.
- 멕시코는 2022년에 북미의 특수 비료 시장에서 16.0%의 점유율을 차지했습니다.
- 특수 비료는 주로 COVID-19 팬데믹에 의한 공급 체인의 혼란으로 인해 2019년과 2020년에 금액과 수량 모두에서 현저한 침체를 경험했습니다.
- 정밀 기술의 채용 확대가 특수 비료 수요를 견인할 것으로 예측됩니다. 최적의 비료 살포를 중시하는 정밀 농업은 방출 제어형이나 완효성 등 특수 비료의 특성과 잘 어울립니다. 그 결과, 북미의 특수 비료 시장은 2023-2030년에 CAGR 5.6%로 성장할 것으로 예상됩니다.
북미의 특수 비료 시장 동향
보조금 등 정부에 의한 재정 지원이 농작물 확대에 기여
- 북미 농장에서는 농작물을 중심으로 다양한 작물이 재배되고 있습니다. 옥수수, 면화, 쌀, 콩, 밀은 이 지역에서 주요 농작물의 일부입니다. 미국, 캐나다, 멕시코는 이 지역의 농업 생산에 크게 기여하고 있습니다. 2022년 북미에서는 농작물이 재배 전체의 약 97.6%를 차지하고, 곡물과 기름씨가 시장을 독점하고 있습니다.
- 국가별로는 미국이 시장을 독점하고 조사 기간 중 작물 재배 면적 전체의 1억 3,570만 헥타르를 차지하고 있습니다. 밭작과 원예가 면적의 대부분을 차지했고, 2022년의 점유율은 97.2%와 2.8%였습니다. 그러나 2018-2019년에 걸쳐 텍사스와 휴스턴 등 지역에서 대홍수가 발생한 불리한 환경 조건 때문에 작물 재배 면적이 대폭 감소했습니다.
- 미국 중서부 전통지역에서 인디애나 서부, 일리노이주, 아이오와주, 미주리주, 네브래스카주 동부, 캔자스주 동부를 거의 커버하며, 옥수수와 콩이 주요 작물입니다. 또한 쌀의 주요 수출국이기도 하며, 이 지역의 쌀 재배는 주로 4개 지역에 집중되어 있습니다. 이 지역의 농작물 시장 잠재력 증가는 정부의 자금 지원 및 보호 강화와 함께 이 지역의 농작물 재배 면적을 밀어올릴 것으로 예측됩니다.
1차 영양소 중에서도 질소는 밭작물에의 시용량이 많아, 229.8kg/헥타르에 상당합니다.
- 벼, 옥수수, 밀, 유채, 카놀라 등의 농작물은 이 지역에서 주요 1차 양분을 소비하는 작물의 일부입니다. 유채, 카놀라가 118.40kg/헥타르를 섭취했습니다. 곡물이 가장 많이 질소 비료를 소비할 것으로 예측됩니다.
- 1차 영양소 중에서는 질소의 시용량이 많아, 2022년에는 약 74.0%를 차지해, 농작물에서는 229.8kg/헥타르에 상당합니다. 그러나, 질소 결핍은 이 지역에서 가장 일반적인 작물 양분의 문제의 하나입니다. 질소 보급의 대부분은 토양 시용에 의해 행해지고 있습니다. 토양에 시용되면, 질소는 식물이 흡수하기 쉽도록 미네랄 질산염으로 변환됩니다.
- 유채는 윤활유, 유압작동유, 플라스틱 등의 공업용도의 오일 추출에 사용됩니다. 비료 사용량은 토양의 질과 강우 잠재력에 따라 달라지지만, 질소 요구량은 100에서 150파운드/에이커에 달합니다. 인과 칼륨의 시비율도 토양에 따라서 다릅니다.
- 1차양분은 다양한 작물의 주요 양분원이므로 토양의 고갈이나 용출 등에 의해 그 시용량은 해마다 대폭 증가할 것으로 예측됩니다.
북미의 특수 비료 산업 개요
북미의 특수 비료 시장은 적당히 통합되어 있으며 상위 5개사에서 63.41%를 차지하고 있습니다.이 시장의 주요 기업은 CF Industries Holdings, Inc., ICL Group Ltd.,The Andersons Inc., The Mosaic Company, 그리고 Yara International ASA입니다 (알파벳순).
기타 혜택
- 엑셀 형식 시장 예측(ME) 시트
- 3개월의 애널리스트 서포트
목차
제1장 주요 요약과 주요 조사 결과
제2장 보고서 제안
제3장 소개
- 조사의 전제조건과 시장 정의
- 조사 범위
- 조사 방법
제4장 주요 산업 동향
- 주요 작물의 작부 면적
- 밭작물
- 원예작물
- 평균 양분 시용률
- 미량영양소
- 밭작물
- 원예작물
- 1차 영양소
- 밭작물
- 원예작물
- 2차 다량 영양소
- 밭작물
- 원예작물
- 미량영양소
- 관개 농지
- 규제 프레임워크
- 밸류체인과 유통채널 분석
제5장 시장 세분화
- 특수 유형
- CRF
- 폴리머 코트
- 폴리머 유황 코팅
- 기타
- 액체 비료
- SRF
- 수용성
- CRF
- 시비 모드
- 시비
- 잎면 살포
- 토양
- 작물 유형
- 밭작물
- 원예작물
- 잔디 및 관상용
- 생산국
- 캐나다
- 멕시코
- 미국
- 기타 북미
제6장 경쟁 구도
- 주요 전략 동향
- 시장 점유율 분석
- 기업 상황
- 기업 프로파일
- CF Industries Holdings, Inc.
- Haifa Group
- ICL Group Ltd
- Koch Industries Inc.
- Nutrien Ltd.
- Sociedad Quimica y Minera de Chile SA
- The Andersons Inc.
- The Mosaic Company
- Wilbur-Ellis Company LLC
- Yara International ASA
제7장 CEO에 대한 주요 전략적 질문
제8장 부록
- 세계 개요
- 개요
- Five Forces 분석 프레임워크
- 세계의 밸류체인 분석
- 시장 역학(DROs)
- 정보원과 참고문헌
- 도표 일람
- 주요 인사이트
- 데이터 팩
- 용어집
The North America Specialty Fertilizer Market size is estimated at 10.85 billion USD in 2025, and is expected to reach 14.39 billion USD by 2030, growing at a CAGR of 5.81% during the forecast period (2025-2030).
The market is dominated by water-soluble fertilizers due to the wide range of nutrient grades and different application methods
- In 2022, water-soluble fertilizers held the maximum share of the North American specialty fertilizers market, accounting for 47.9%. The demand for these fertilizers is influenced by nutrient grades and application modes, such as foliar or fertigation, based on specific needs. Notably, in 2022, foliar application accounted for 45.2% of the market, while fertigation claimed 54.8%.
- Liquid fertilizers secured the second-largest market share at 45.9% in 2022. Given the acidic nature of arable lands in the region, there's a growing preference for liquid-based specialty fertilizers like ammonium nitrate. These fertilizers not only help maintain soil pH levels but also address concerns about nitrogen leaching, a key issue for both environmentalists and farmers.
- Controlled-release fertilizers, with a modest 4.9% market share, play a pivotal role in precision farming. By ensuring crops receive precise nutrient dosages, they have become indispensable in modern agriculture.
- In 2022, the US accounted for a significant chunk, 67.1%, of the North American specialty fertilizer market. Water-soluble and liquid fertilizers were the dominant segments in the US market. Likewise, the study period revealed a strong preference for foliar and fertigation modes in the US, a trend attributed to the country's well-established irrigation infrastructure.
- With a well-developed irrigation system and growing demand for field crops, turfs, and ornamentals, the specialty fertilizer market in the US is poised for growth in the coming years.
The United States dominates the market due to well-developed agricultural systems and larger cultivation area across the country
- In 2022, the United States held a dominant position in the North American specialty fertilizers market. Water-soluble fertilizers, liquid fertilizers, and CRF accounted for 48.0%, 46.3%, and 5.1% of the market share, respectively. Slow-release fertilizers had a smaller share of 0.6%, primarily due to limited adoption in major crops like wheat, maize, and cereals. However, the segment's growth is expected to be bolstered by the country's developing micro-irrigation system. In 2022, the total irrigated cropland in the US spanned 18.3 million hectares.
- In North America, Canada has the second-largest specialty fertilizer market, followed by the United States. During 2023-2030, the country's specialty fertilizer market is anticipated to register a CAGR of 6.4%.
- Mexico held a 16.0% share of the North American specialty fertilizers market in 2022. Notably, Mexico's field crops saw a volume of 2.2 million metric tons in 2022, with an expected rise to 2.8 million metric tons by 2030.
- Specialty fertilizers experienced a notable decline in both value and volume in 2019 and 2020, primarily due to disruptions in the supply chain caused by the COVID-19 pandemic. However, the market rebounded in 2021, driven by rising raw material prices and increased demand.
- The growing adoption of precision technologies is expected to drive the demand for specialty fertilizers. Precision farming, which emphasizes optimal fertilizer application, aligns well with the characteristics of specialty fertilizers like controlled-release and slow-release variants. As a result, the North American specialty fertilizers market is projected to register a CAGR of 5.6% during 2023-2030.
North America Specialty Fertilizer Market Trends
Financial support by the government, such as subsidies, has contributed to the expansion of field crops
- A wide array of crops are grown on North American farms, mainly covering field crops. Corn, cotton, rice, soybean, and wheat are some of the dominating field crops across the region. The United States, Canada, and Mexico are major contributors to the region's agricultural output. In 2022, field crops covered around 97.6% of the overall cultivation in North America, with cereals and oilseeds dominating the market.
- By country, the United States dominates the market, covering 135.7 million hectares of the overall area under crop cultivation during the study period. Field crops and horticulture covered the majority of the area and accounted for shares of 97.2% and 2.8% in 2022. However, between 2018 and 2019, the country witnessed a significant dip in crop acreages majorly due to unfavorable environmental conditions resulting in heavy floods in areas like Texas and Houston.
- The largest crop cultivated is corn, the majority of which is grown in a region known as the 'Corn Belt,' It is a traditional area in the midwestern United States, roughly covering western Indiana, Illinois, Iowa, Missouri, eastern Nebraska, and eastern Kansas, in which corn (maize) and soybeans are the dominant crops. Also, it is the major rice exporter, and rice cultivation in the region is mainly concentrated within four regions, with three in the South and one in California. The increased market potential for the region's field crops, coupled with increased government funding and protection, is anticipated to positively drive the area under field crop cultivation in the region.
Among all the primary nutrients, nitrogen is applied in a higher quantity to field crops, which is equivalent to 229.8 kg/hectare
- Field crops, such as rice, corn/maize, wheat, and rapeseed/canola, are some of the major primary nutrient-consuming crops in the region. In 2022, about 140.85 kg/hectare of primary nutrients were consumed by rice, followed by 118.40 kg/hectare consumed by rapeseed/canola. Cereals are anticipated to consume the maximum amount of nitrogen-based fertilizers. As they are grown intensively in the region, they deplete the nutrients in the soil and require more fertilizers to supplement growth.
- Among all the primary nutrients, nitrogen is applied in a higher quantity, accounting for about 74.0% in 2022, equivalent to 229.8 kg/hectare for field crops. Nitrogen deficiency, however, is one of the most prevalent crop nutrient problems in the region. Hence, most of the nitrogen supplement is provided through soil application. When applied to the soil, nitrogen is converted to mineral nitrate for the plants to absorb easily. Rapeseed, the major nitrogen-consuming crop, is widely grown in the United States.
- Rapeseed is used for extracting oil for industrial applications, like lubricants, hydraulic fluids, and plastics. While fertilizer usage is based on soil quality and rainfall potential, its nitrogen requirements range from 100 to 150 lbs./acre. Phosphorus and potassium fertility rates also vary from soil to soil. However, the recommended rates range from 0 to 80 lbs./acre and 0 to 140 lbs./acre, as per the AgMRC.
- Since primary nutrients are the major sources of nutrients for various crops, their application rates are anticipated to grow significantly over the years due to soil depletion, leaching, etc.
North America Specialty Fertilizer Industry Overview
The North America Specialty Fertilizer Market is moderately consolidated, with the top five companies occupying 63.41%. The major players in this market are CF Industries Holdings, Inc., ICL Group Ltd, The Andersons Inc., The Mosaic Company and Yara International ASA (sorted alphabetically).
Additional Benefits:
- The market estimate (ME) sheet in Excel format
- 3 months of analyst support
TABLE OF CONTENTS
1 EXECUTIVE SUMMARY & KEY FINDINGS
2 REPORT OFFERS
3 INTRODUCTION
- 3.1 Study Assumptions & Market Definition
- 3.2 Scope of the Study
- 3.3 Research Methodology
4 KEY INDUSTRY TRENDS
- 4.1 Acreage Of Major Crop Types
- 4.1.1 Field Crops
- 4.1.2 Horticultural Crops
- 4.2 Average Nutrient Application Rates
- 4.2.1 Micronutrients
- 4.2.1.1 Field Crops
- 4.2.1.2 Horticultural Crops
- 4.2.2 Primary Nutrients
- 4.2.2.1 Field Crops
- 4.2.2.2 Horticultural Crops
- 4.2.3 Secondary Macronutrients
- 4.2.3.1 Field Crops
- 4.2.3.2 Horticultural Crops
- 4.2.1 Micronutrients
- 4.3 Agricultural Land Equipped For Irrigation
- 4.4 Regulatory Framework
- 4.5 Value Chain & Distribution Channel Analysis
5 MARKET SEGMENTATION (includes market size in Value in USD and Volume, Forecasts up to 2030 and analysis of growth prospects)
- 5.1 Speciality Type
- 5.1.1 CRF
- 5.1.1.1 Polymer Coated
- 5.1.1.2 Polymer-Sulfur Coated
- 5.1.1.3 Others
- 5.1.2 Liquid Fertilizer
- 5.1.3 SRF
- 5.1.4 Water Soluble
- 5.1.1 CRF
- 5.2 Application Mode
- 5.2.1 Fertigation
- 5.2.2 Foliar
- 5.2.3 Soil
- 5.3 Crop Type
- 5.3.1 Field Crops
- 5.3.2 Horticultural Crops
- 5.3.3 Turf & Ornamental
- 5.4 Country
- 5.4.1 Canada
- 5.4.2 Mexico
- 5.4.3 United States
- 5.4.4 Rest of North America
6 COMPETITIVE LANDSCAPE
- 6.1 Key Strategic Moves
- 6.2 Market Share Analysis
- 6.3 Company Landscape
- 6.4 Company Profiles
- 6.4.1 CF Industries Holdings, Inc.
- 6.4.2 Haifa Group
- 6.4.3 ICL Group Ltd
- 6.4.4 Koch Industries Inc.
- 6.4.5 Nutrien Ltd.
- 6.4.6 Sociedad Quimica y Minera de Chile SA
- 6.4.7 The Andersons Inc.
- 6.4.8 The Mosaic Company
- 6.4.9 Wilbur-Ellis Company LLC
- 6.4.10 Yara International ASA
7 KEY STRATEGIC QUESTIONS FOR FERTILIZER CEOS
8 APPENDIX
- 8.1 Global Overview
- 8.1.1 Overview
- 8.1.2 Porter's Five Forces Framework
- 8.1.3 Global Value Chain Analysis
- 8.1.4 Market Dynamics (DROs)
- 8.2 Sources & References
- 8.3 List of Tables & Figures
- 8.4 Primary Insights
- 8.5 Data Pack
- 8.6 Glossary of Terms
