


|
시장보고서
상품코드
1693569
북미의 비즈니스 제트기 시장 : 점유율 분석, 산업 동향, 성장 예측(2025-2030년)North America Business Jet - Market Share Analysis, Industry Trends & Statistics, Growth Forecasts (2025 - 2030) |
||||||
■ 보고서에 따라 최신 정보로 업데이트하여 보내드립니다. 배송일정은 문의해 주시기 바랍니다.
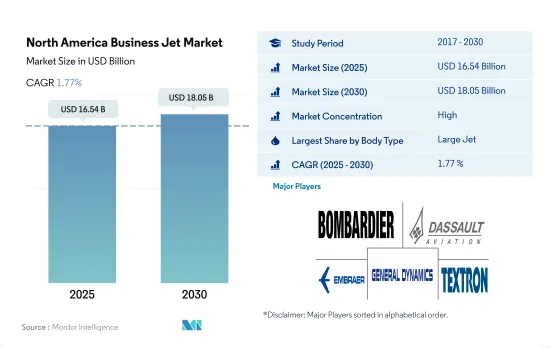
북미의 비즈니스 제트기 시장 규모는 2025년에 165억 4,000만 달러, 2030년에는 180억 5,000만 달러에 이르고, 예측 기간(2025-2030년)의 CAGR은 1.77%를 나타낼 것으로 예측됩니다.
유행 후 출장 비행 시간 증가로 비즈니스 제트기의 높은 수요가 발생했습니다.
- 북미의 비즈니스 제트기기 시장은 최근, 대형, 소형, 중형 제트기로 강력한 성장과 기술 혁신을 이루고 있습니다.
- 모든 제트기 중 소형 제트기의 카테고리가 최대의 점유율을 차지하고 북미의 2022년 납입 대수의 43% 이상을 차지하고 있습니다.
- 2020년 COVID-19 팬데믹 때 이 지역의 비즈니스 제트기기에서는 중형 35.3%, 대형 21.5%에 비해 소형 제트기 카테고리가 17.8%로 가장 영향이 적었습니다.
- 과거 중, 텍스트 론 에비에이션이 980대를 납입해 선두가 되었고, 걸프 스트림 에어로 스페이스가 591대를 납입해 2위가 되었습니다. Aviation이 6,693기를 납품해 톱이 되어, Gulfstream 에어로스페이스가 2,354대에 이어 엠브라엘, 다스알토 에비에이션, 봄바르디아, 리어 제트가 다른 주요 시장 진출 기업으로 2022년 12월 현재 보유기 수의 35%를 차지하고 있습니다. 효율적이고 커스터마이즈형 항공 수송 솔루션을 요구하는 기업이나 개인용의 북미 시장이 수요를 견인할 것으로 예상되며, 예측 기간 중에 1,749기의 대형 제트기가 이러한 수요를 충족시키기 위해 조달될 전망입니다.
비공개 여행에 대한 선호도 증가와 HNWI 인구 증가로 이 지역의 비즈니스 제트기 수요 견인
- 북미의 안정적인 경제 상황은 비즈니스 제트기 시장의 성장에 중요한 역할을 하고 있습니다. 이 지역의 강력한 경제는 강력한 GDP 성장과 낮은 실업률로 특징지어지며, 기업 확장과 투자 환경을 조성했습니다. 북미의 HNWI의 부는 2022년에 2021년 대비 5% 증가했습니다.
- 북미는 세계에서 가장 많은 프라이빗 제트기를 보유하고 있으며, 미국은 세계 제트기 보유 대수의 약 90%를 차지하고, 대수 및 금액 모두 가장 지배적인 시장이 되고 있습니다.
- 비즈니스 항공 부문 전체의 항공기 납품은 COVID-19 팬데믹의 영향을 받아 2020년 성장은 22% 감소했습니다. 북미의 경제 활동 축소와 여행 관련 제한은 이 지역의 비즈니스 제트기기 수요에 영향을 미쳤습니다. 슈퍼 부유층 사이에서는 보다 안전한 이동 수단으로 되는 자가 비행기로의 전환을 볼 수 있어, 이 지역에서의 비즈니스 제트기기의 조달을 뒷받침했습니다. 그러나 이 지역의 경기 회복은 예상보다 빠르며 2022년에는 2020년 대비 8%의 성장을 기록했습니다. 이로 인해 처음으로 비즈니스 제트기를 구매하는 사람의 구매 계획이 증가하고 예측 기간 동안 해당 지역의 비즈니스 제트기기 보유 대수가 두 배가 될 것으로 예측됩니다. COVID-19의 유행에 따른 구매 습관의 변화가 시장 성장을 가속하고 2023-2030년 사이에 비즈니스 제트기 조달은 4,314기 증가할 것으로 예측됩니다.
북미의 비즈니스 제트기 시장 동향
HNWI 인구 증가는 시장의 주요 성장 촉진요인으로
- 유동성 금융자산이 100만 달러 이상인 개인을 HNWI, 순자산이 3,000만 달러 이상인 개인을 UHNWI라고 부릅니다. 주식시장의 상승과 정부의 경기자극책에 의해 2022년에는 이 지역이 유럽과 아시아태평양을 제치고 전체 HNWI 인구를 앞질렀습니다. 북미의 HNWI 재산은 2022년에는 2021년 대비 거의 4% 증가했습니다. HNWI의 수와 자산 측면에서 북미가 주도하는 것은 대부분 미국에 기인합니다. 북미는 초부유층 증가가 가장 두드러졌으며 2022년에는 세계 HNWI 인구의 49%를 기록했습니다.
- HNWI는 개인 여행과 출장을 위해 개인 제트기를 소유하는 경우가 많습니다. 2022년 12월 현재, 북미에는 약 16,524기의 프라이빗 제트가 등록되어 있어 그 중 미국이 거의 91%를 차지하고, 멕시코가 6%, 캐나다가 3%로 계속되고 있습니다.
- 지속가능한 투자(SI)는 보다 주목을 받고 있으며, 기업에 높은 잠재력을 가진 참여 기회를 제공합니다. 초HNWI 부문에서 SI는 빠르게 주목받고 있습니다. 또한 2021년과 2022년에는 미국에서 팬데믹시의 건강에 대한 배려와 금융시장에 있어서의 세계 부의 급증을 배경으로 항공기 보유에 대한 수요가 증가하였습니다.
북미의 비즈니스 제트기 산업 개요
북미의 비즈니스 제트기 시장은 상당히 통합되어 있으며 상위 5개 기업에서 94.16%를 차지하고 있습니다.
기타 혜택
- 엑셀 형식 시장 예측(ME) 시트
- 3개월의 애널리스트 서포트
목차
제1장 주요 요약과 주요 조사 결과
제2장 보고서 제안
제3장 소개
- 조사의 전제조건과 시장 정의
- 조사 범위
- 조사 방법
제4장 주요 산업 동향
- 부유층(HNWI)
- 규제 프레임워크
- 밸류체인 분석
제5장 시장 세분화
- 바디 유형
- 대형 제트기
- 소형 제트기
- 중형 제트기
- 국가명
- 캐나다
- 멕시코
- 미국
- 기타 북미
제6장 경쟁 구도
- 주요 전략 동향
- 시장 점유율 분석
- 기업 상황
- 기업 프로파일
- Bombardier Inc.
- Cirrus Design Corporation
- Dassault Aviation
- Embraer
- General Dynamics Corporation
- Honda Motor Co., Ltd.
- Pilatus Aircraft Ltd
- Textron Inc.
제7장 CEO에 대한 주요 전략적 질문
제8장 부록
- 세계 개요
- 개요
- Five Forces 분석 프레임워크
- 세계의 밸류체인 분석
- 시장 역학(DROs)
- 정보원과 참고문헌
- 도표 일람
- 주요 인사이트
- 데이터 팩
- 용어집
The North America Business Jet Market size is estimated at 16.54 billion USD in 2025, and is expected to reach 18.05 billion USD by 2030, growing at a CAGR of 1.77% during the forecast period (2025-2030).
Increase in business travel flight hours after the pandemic generated a high demand for business jets
- The North American business jets market has experienced robust growth and innovation in recent years, particularly in large, light, and mid-size jets. The region accounted for around 69% of the global business jet deliveries in 2022, making it the biggest general aviation market globally.
- Among all the jets, the light jet category accounted for the largest share, with over 43% of the deliveries in 2022 in the North American region. An increase in business travel flight hours after the pandemic generated a high demand for regional business jets.
- During the COVID-19 pandemic in 2020, the light jet category was the least impacted business jets in this region, with a decline of 17.8% compared with the mid-size 35.3% and large jets 21.5%, respectively. This is due to the consistent demand for light jets, with clients prioritizing light jets over other mid-size and large jets.
- During the historic period, Textron Aviation became the leading player in deliveries with 980 aircraft, while Gulfstream Aerospace was in the second position with 591 deliveries. Cirrus Aircraft, Embraer, and Bombardier were the other major market players, accounting for 40% of the share in the historic period. Regarding the operational business jets, Textron Aviation became the leading player in deliveries with 6,693 aircraft, followed by Gulfstream Aerospace with 2,354 deliveries. Embraer, Dassualt Aviation, Bombardier, and Learjet were the other major market players, accounting for 35% of the fleet as of December 2022. Overall, the demand is anticipated to be driven by the North American market for businesses and individuals seeking efficient and customized air transportation solutions, and 1,749 large jets are expected to be procured to meet the demand for these jets during the forecast period.
Increasing preferences for private travel and the rising HNWI population are driving the demand for business jets in the region
- North America's stable economic conditions have played a crucial role in the growth of the business jet market. The region's robust economy, characterized by strong GDP growth and low unemployment rates, created a conducive corporate expansion and investment environment. North America's HNWI wealth grew by almost 5% in 2022 compared to 2021. North America recorded the most significant rise in the ultra-wealthy population, which recorded 66% of the global HNWI population.
- The North American region accounts for the highest number of private jets globally, and the United States accounts for around 90% of the total jet fleet globally, making it the most dominating market in terms of volume and value. Mexico and Canada accounted for 6% and 3% of the operational fleet in the region, respectively, in December 2022.
- The overall aircraft deliveries in the business aviation sector were affected during the COVID-19 pandemic, and the growth in 2020 declined by 22%. The reduction in North America's economic activities and travel-related restrictions affected the demand for business jets in the region. There has been a shift toward private flying as it is considered a safer means of transportation among the ultra-wealthy population, which aided in procuring business jets in the region. However, the region's economic recovery was faster than expected, and in 2022, the region recorded a growth of 8% compared to 2020. This led to an increase in the purchase plans of first-time buyers and is anticipated to double the region's business jet fleet size during the forecast period. The change in purchasing habits driven by the COVID-19 pandemic is expected to drive the growth of the market, and during 2023-2030, the procurement of business jets is expected to rise by 4,314.
North America Business Jet Market Trends
Rise in the HNWI population is acting as the major growth driver for the market
- Individuals with liquid financial assets over USD 1 million are termed as HNWIs, and those with a net worth of at least USD 30 million are termed as UHNWIs. Due to the rising equity markets and government stimulus, in 2022, the region overtook Europe and Asia-Pacific to lead the total HNWI population. North America's HNWI wealth grew by almost 4% in 2022 compared to 2021. The leading position of North America in terms of the number and assets of HNWIs is mostly attributed to the United States. North America recorded the most significant rise in the ultrawealthy population, which recorded 49% of the global HNWI population in 2022.
- HNWIs often own private jets for personal or business travel. Although North America accounts for almost 70% of private jets globally, it lags in terms of private jets present as a percentage of its super-rich population compared to Latin America and Africa. As of December 2022, there were around 16,524 registered private aircraft in North America, of which the United States accounted for almost 91%, followed by Mexico and Canada, with 6% and 3%, respectively.
- Sustainable investing (SI) is attracting more attention and providing businesses with a high-potential engagement opportunity. In the ultra-HNWI segment, SI is rapidly gaining traction. For instance, about 40% of ultra-HNWIs are willing to invest money in sustainability, compared to 27% of HNWIs who expressed interest in SI products. Furthermore, in 2021 and 2022, there was an increase in the demand for aircraft ownership in the United States, driven by health considerations during the pandemic and a surge in global wealth in the financial markets. This trend is strengthened with capital raising and Initial Public Offering (IPO) activities and boosted by supportive public market valuations.
North America Business Jet Industry Overview
The North America Business Jet Market is fairly consolidated, with the top five companies occupying 94.16%. The major players in this market are Bombardier Inc., Dassault Aviation, Embraer, General Dynamics Corporation and Textron Inc. (sorted alphabetically).
Additional Benefits:
- The market estimate (ME) sheet in Excel format
- 3 months of analyst support
TABLE OF CONTENTS
1 EXECUTIVE SUMMARY & KEY FINDINGS
2 REPORT OFFERS
3 INTRODUCTION
- 3.1 Study Assumptions & Market Definition
- 3.2 Scope of the Study
- 3.3 Research Methodology
4 KEY INDUSTRY TRENDS
- 4.1 High-net-worth Individual (hnwi)
- 4.2 Regulatory Framework
- 4.3 Value Chain Analysis
5 MARKET SEGMENTATION (includes market size in Value in USD and Volume, Forecasts up to 2030 and analysis of growth prospects)
- 5.1 Body Type
- 5.1.1 Large Jet
- 5.1.2 Light Jet
- 5.1.3 Mid-Size Jet
- 5.2 Country
- 5.2.1 Canada
- 5.2.2 Mexico
- 5.2.3 United States
- 5.2.4 Rest of North America
6 COMPETITIVE LANDSCAPE
- 6.1 Key Strategic Moves
- 6.2 Market Share Analysis
- 6.3 Company Landscape
- 6.4 Company Profiles
- 6.4.1 Bombardier Inc.
- 6.4.2 Cirrus Design Corporation
- 6.4.3 Dassault Aviation
- 6.4.4 Embraer
- 6.4.5 General Dynamics Corporation
- 6.4.6 Honda Motor Co., Ltd.
- 6.4.7 Pilatus Aircraft Ltd
- 6.4.8 Textron Inc.
7 KEY STRATEGIC QUESTIONS FOR AVIATION CEOS
8 APPENDIX
- 8.1 Global Overview
- 8.1.1 Overview
- 8.1.2 Porter's Five Forces Framework
- 8.1.3 Global Value Chain Analysis
- 8.1.4 Market Dynamics (DROs)
- 8.2 Sources & References
- 8.3 List of Tables & Figures
- 8.4 Primary Insights
- 8.5 Data Pack
- 8.6 Glossary of Terms


샘플 요청 목록