|
시장보고서
상품코드
1693657
버스 : 시장 점유율 분석, 산업 동향 및 통계, 성장 예측(2025-2030년)Bus - Market Share Analysis, Industry Trends & Statistics, Growth Forecasts (2025 - 2030) |
||||||
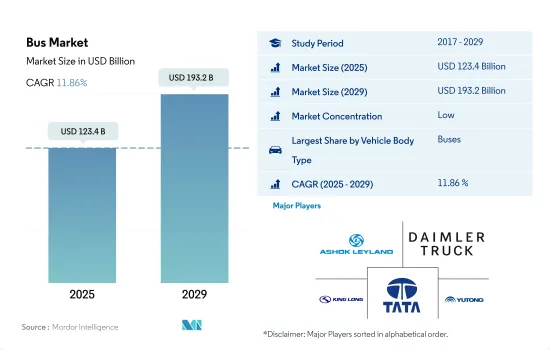
버스 시장 규모는 2025년에 1,234억 달러로 추정되고, 2029년에는 1,932억 달러에 이를 것으로 예측되며, 예측 기간(2025-2029년)의 CAGR은 11.86%를 나타낼 전망입니다.

전기 버스는 연료 및 유지보수 비용 절감으로 디젤 버스에 비해 총소유비용이 현저히 낮습니다.
- 연료는 모든 차량의 운영 비용에서 가장 큰 부분을 차지합니다. 대중교통에 전기 버스를 사용하면 연료비와 기타 초기 비용 및 총 소유 비용을 절감할 수 있습니다.
- 전기 버스의 가격은 75만 달러로 일반적인 디젤 대중교통 차량의 50만 달러에 비해 저렴합니다. 초기 비용은 더 높지만 전기 버스는 비용 효율적인 대안입니다. 유지보수 및 연료비 지출이 적어 운영 비용이 낮을 뿐만 아니라 화석 연료 가격에 비해 전기 가격이 상대적으로 안정적이기 때문에 비용 예측 가능성이 높아서 수명 기간 동안 상당한 비용을 절감할 수 있습니다. 우호적인 법안이 마련되면 전기 버스의 재정적 타당성이 더욱 높아집니다.
- 세계의 전기버스 생태계의 구성 요소들이 정해진 정부 규정에 따라 시행되고 있지만, 전 세계적으로 전기버스 생태계가 빠르게 발전하기 위해서는 전기버스 충전소의 계획, 책임 범위, 운영 측면에서 전기버스 충전소 설치 및 관리라는 당면 과제를 최우선적으로 해결해야 합니다.
세계의 버스 시장 동향
세계적인 수요 증가와 정부 지원으로 전기차 시장 성장 촉진
- 전기자동차(EV)는 에너지 효율성을 높이고 온실가스 및 공해 배출을 줄일 수 있다는 잠재력에 힘입어 자동차 산업에서 없어서는 안 될 필수품이 되었습니다. 이러한 급증은 주로 환경에 대한 관심이 높아지고 정부의 지원 노력에 기인합니다. 특히 전 세계의 전기차 판매량은 2021년에 비해 2022년에 10.82%의 견고한 성장세를 보였습니다
- 런던 경찰청 및 소방청과 같은 선도적인 제조업체와 기관들은 전기 모빌리티 전략을 적극적으로 추진하고 있습니다. 예를 들어, 이들은 2025년까지 무공해 차량 목표를 설정하고 2030년까지 밴의 40%를 전기화하고 2040년까지 완전 전기화를 달성한다는 목표를 세웠습니다.
- 아시이평양과 유럽은 배터리 기술 및 차량 전기화의 발전에 힘입어 전기차 생산을 주도할 것으로 보입니다. 2020년 5월, 기아자동차 유럽은 전기화로의 전략적 전환을 알리는 '플랜 S'를 발표했습니다. 이 결정은 유럽에서 기아자동차의 전기차 판매량이 기록적으로 증가한 이후 내려진 것입니다. 기아는 2025년까지 승용차, SUV, MPV 등 다양한 부문에 걸쳐 11개의 전기차 모델을 전 세계에 출시한다는 야심찬 계획을 세우고 있습니다.
버스 산업 개요
버스 시장은 세분화되어 있으며 상위 5개 기업이 12.60%를 점유하고 있습니다. 이 시장의 주요 업체는 Ashok Leyland Limited, Daimler Truck Holding AG, King Long United Automotive Industry Co. Ltd., Tata Motors Limited 및 Zhengzhou Yutong Bus Co. Ltd.(알파벳 순 정렬)입니다.
기타 혜택
- 엑셀 형식 시장 예측(ME) 시트
- 3개월의 애널리스트 지원
목차
제1장 주요 요약과 주요 조사 결과
제2장 보고서 제안
제3장 소개
- 조사의 전제조건과 시장 정의
- 조사 범위
- 조사 방법
제4장 주요 산업 동향
- 인구
- 아프리카
- 아시이평양
- 유럽
- 중동
- 북미
- 남미
- 1인당 GDP
- 아프리카
- 아시이평양
- 유럽
- 중동
- 북미
- 남미
- 자동차 구입을 위한 소비 지출(CVP)
- 아프리카
- 아시이평양
- 유럽
- 중동
- 북미
- 남미
- 인플레이션율
- 아프리카
- 아시이평양
- 유럽
- 중동
- 북미
- 남미
- 자동차 대출 금리
- 공유 차량 서비스
- 공유 차량 서비스
- 전기화의 영향
- EV 충전소
- 배터리 팩 가격
- 아프리카
- 아시이평양
- 유럽
- 중동
- 북미
- 남미
- Xev 신모델 발표
- 연료 가격
- OEM 생산 통계
- 규제 프레임워크
- 밸류체인과 유통채널 분석
제5장 시장 세분화
- 추진 부문
- 하이브리드 자동차와 전기자동차
- 연료 카테고리별
- BEV
- FCEV
- HEV
- PHEV
- ICE
- 연료 카테고리별
- 하이브리드 자동차와 전기자동차
- 지역별
- 아프리카
- 아시이평양
- 인도
- 일본
- 유럽
- 체코 공화국
- 중동
- 북미
- 캐나다
- 멕시코
- 미국
- 남미
제6장 경쟁 구도
- 주요 전략 동향
- 시장 점유율 분석
- 기업 상황
- 기업 프로파일
- Anhui Ankai Automobile Co. Ltd.
- Ashok Leyland Limited
- Byd Auto Industry Company Limited
- Daimler Truck Holding AG
- King Long United Automotive Industry Co. Ltd.
- NFI Group Inc.
- Proterra INC.
- Tata Motors Limited
- Volvo Group
- Zhengzhou Yutong Bus Co. Ltd.
- Zhongtong Bus Holding Co. Ltd.
제7장 CEO에 대한 주요 전략적 질문
제8장 부록
- 세계 개요
- 개요
- Five Forces 분석 프레임워크
- 세계의 밸류체인 분석
- 시장 역학(DROs)
- 출처 및 참고문헌
- 도표 일람
- 주요 인사이트
- 데이터 팩
- 용어집
The Bus Market size is estimated at 123.4 billion USD in 2025, and is expected to reach 193.2 billion USD by 2029, growing at a CAGR of 11.86% during the forecast period (2025-2029).
Electric buses offer significantly lower total cost of ownership compared to diesel buses through reduced fuel and maintenance costs
- Fuel constitutes a major part of the operating cost of any vehicle. Using an electric bus for public transport reduces fuel costs, along with other upfront costs and the total cost of ownership. By 2030, the prices for electric buses are expected to decrease to the price level of diesel fuel buses. Electric buses help reduce 81-83% of the maintenance and operating costs compared to a diesel-engine bus.
- An electric bus costs USD 750,000 compared to USD 500,000 for a typical diesel transit vehicle. Despite their higher initial costs, electric buses are a cost-effective alternative. They offer lower operating costs due to lower maintenance and fuel expenditures, as well as greater cost predictability due to the relative stability of electricity prices compared to fossil fuel prices, resulting in significant savings over the course of their lifetime. With favorable legislation, electric buses are more financially feasible. Manufacturers of electric buses assert that these vehicles more than make up for their higher initial cost, with fuel savings of USD 4,00,000 and maintenance savings of about USD 1,25,000.
- Although the components of the global e-bus ecosystem are being implemented in accordance with established government regulations, the immediate challenge of setting up and managing e-bus charging stations in terms of planning, the scope of responsibilities, and operation must be addressed on a high-priority basis to expedite the development of the e-bus ecosystem across the world.
Global Bus Market Trends
The rising global demand and government support propel electric vehicle market growth
- Electric vehicles (EVs) have become indispensable in the automotive industry, driven by their potential to enhance energy efficiency and reduce greenhouse gas and pollution emissions. This surge is primarily attributed to growing environmental concerns and supportive government initiatives. Notably, global EV sales witnessed a robust 10.82% growth in 2022 compared to 2021. Projections indicate that annual sales of electric passenger cars will surpass 5 million by the end of 2025, accounting for approximately 15% of total vehicle sales.
- Leading manufacturers and organizations, like the London Metropolitan Police & Fire Service, have been actively pursuing their electric mobility strategies. For instance, they have set a target of a zero-emission fleet by 2025, with a goal of electrifying 40% of their vans by 2030 and achieving full electrification by 2040. Similar trends are expected globally, with the period from 2024 to 2030 witnessing a surge in demand and sales of electric vehicles.
- Asia-Pacific and Europe are poised to dominate electric vehicle production, driven by their advancements in battery technology and vehicle electrification. In May 2020, Kia Motors Europe unveiled its "Plan S," signaling a strategic shift toward electrification. This decision came on the heels of record-breaking sales of Kia's EVs in Europe. Kia has ambitious plans to introduce 11 EV models globally by 2025, spanning various segments like passenger vehicles, SUVs, and MPVs. The company aims to achieve annual global EV sales of 500,000 by 2026.
Bus Industry Overview
The Bus Market is fragmented, with the top five companies occupying 12.60%. The major players in this market are Ashok Leyland Limited, Daimler Truck Holding AG, King Long United Automotive Industry Co. Ltd., Tata Motors Limited and Zhengzhou Yutong Bus Co. Ltd. (sorted alphabetically).
Additional Benefits:
- The market estimate (ME) sheet in Excel format
- 3 months of analyst support
TABLE OF CONTENTS
1 EXECUTIVE SUMMARY & KEY FINDINGS
2 REPORT OFFERS
3 INTRODUCTION
- 3.1 Study Assumptions & Market Definition
- 3.2 Scope of the Study
- 3.3 Research Methodology
4 KEY INDUSTRY TRENDS
- 4.1 Population
- 4.1.1 Africa
- 4.1.2 Asia-Pacific
- 4.1.3 Europe
- 4.1.4 Middle East
- 4.1.5 North America
- 4.1.6 South America
- 4.2 GDP Per Capita
- 4.2.1 Africa
- 4.2.2 Asia-Pacific
- 4.2.3 Europe
- 4.2.4 Middle East
- 4.2.5 North America
- 4.2.6 South America
- 4.3 Consumer Spending For Vehicle Purchase (cvp)
- 4.3.1 Africa
- 4.3.2 Asia-Pacific
- 4.3.3 Europe
- 4.3.4 Middle East
- 4.3.5 North America
- 4.3.6 South America
- 4.4 Inflation
- 4.4.1 Africa
- 4.4.2 Asia-Pacific
- 4.4.3 Europe
- 4.4.4 Middle East
- 4.4.5 North America
- 4.4.6 South America
- 4.5 Interest Rate For Auto Loans
- 4.6 Shared Rides
- 4.7 Shared Rides
- 4.8 Impact Of Electrification
- 4.9 EV Charging Station
- 4.10 Battery Pack Price
- 4.10.1 Africa
- 4.10.2 Asia-Pacific
- 4.10.3 Europe
- 4.10.4 Middle East
- 4.10.5 North America
- 4.10.6 South America
- 4.11 New Xev Models Announced
- 4.12 Fuel Price
- 4.13 Oem-wise Production Statistics
- 4.14 Regulatory Framework
- 4.15 Value Chain & Distribution Channel Analysis
5 MARKET SEGMENTATION (includes market size in Value in USD and Volume, Forecasts up to 2029 and analysis of growth prospects)
- 5.1 Propulsion Type
- 5.1.1 Hybrid and Electric Vehicles
- 5.1.1.1 By Fuel Category
- 5.1.1.1.1 BEV
- 5.1.1.1.2 FCEV
- 5.1.1.1.3 HEV
- 5.1.1.1.4 PHEV
- 5.1.2 ICE
- 5.1.2.1 By Fuel Category
- 5.1.1 Hybrid and Electric Vehicles
- 5.2 Region
- 5.2.1 Africa
- 5.2.2 Asia-Pacific
- 5.2.2.1 India
- 5.2.2.2 Japan
- 5.2.3 Europe
- 5.2.3.1 Czech Republic
- 5.2.4 Middle East
- 5.2.5 North America
- 5.2.5.1 Canada
- 5.2.5.2 Mexico
- 5.2.5.3 US
- 5.2.6 South America
6 COMPETITIVE LANDSCAPE
- 6.1 Key Strategic Moves
- 6.2 Market Share Analysis
- 6.3 Company Landscape
- 6.4 Company Profiles
- 6.4.1 Anhui Ankai Automobile Co. Ltd.
- 6.4.2 Ashok Leyland Limited
- 6.4.3 Byd Auto Industry Company Limited
- 6.4.4 Daimler Truck Holding AG
- 6.4.5 King Long United Automotive Industry Co. Ltd.
- 6.4.6 NFI Group Inc.
- 6.4.7 Proterra INC.
- 6.4.8 Tata Motors Limited
- 6.4.9 Volvo Group
- 6.4.10 Zhengzhou Yutong Bus Co. Ltd.
- 6.4.11 Zhongtong Bus Holding Co. Ltd.
7 KEY STRATEGIC QUESTIONS FOR VEHICLES CEOS
8 APPENDIX
- 8.1 Global Overview
- 8.1.1 Overview
- 8.1.2 Porter's Five Forces Framework
- 8.1.3 Global Value Chain Analysis
- 8.1.4 Market Dynamics (DROs)
- 8.2 Sources & References
- 8.3 List of Tables & Figures
- 8.4 Primary Insights
- 8.5 Data Pack
- 8.6 Glossary of Terms