|
시장보고서
상품코드
1693765
인도의 유기 비료 시장 : 시장 점유율 분석, 산업 동향 및 통계, 성장 예측(2025-2030년)India Organic Fertilizer - Market Share Analysis, Industry Trends & Statistics, Growth Forecasts (2025 - 2030) |
||||||
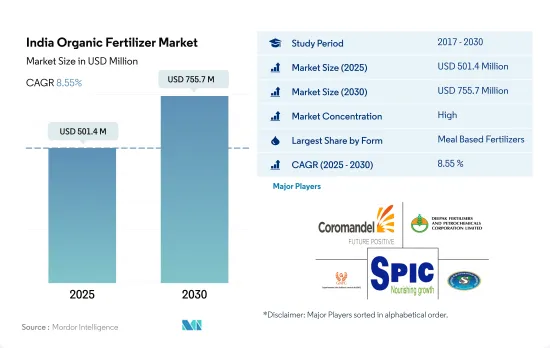
인도의 유기 비료 시장 규모는 2025년 5억 140만 달러로 추정되고, 2030년에는 7억 5,570만 달러에 이를 것으로 예측되며, 예측 기간(2025-2030년) 중 CAGR 8.55%로 성장할 전망입니다.

- 유기비료는 유기물을 대량으로 포함하여 토양의 생물활성을 높여 토양의 생물다양성을 유지 및 향상시키고 있습니다. 유기 비료는 유기농법과 프랙티스 농법에서 널리 사용되기 때문에 2022년에는 인도 전체 작물 영양 부문의 69.9%를 차지했습니다.
- 밀 기반 비료는 가장 높은 평가를 받는 유기 비료를 구성하며 2022년 유기 비료 시장의 67.5%를 차지했습니다. 그러나 육분 시장, 특히 쇠고기 기반 육분은 인도에서는 그다지 받아들여지지 않고, 골분 생산은 인도의 많은 지역에서 한정되어 있습니다.
- 비료는 인도에서 가장 소비되고 있는 유기 비료이며, 그 입수의 용이성이 최대 시장 점유율을 차지하고 있습니다. 작물의 품종에 관계없이, 거의 모든 작물에 시용되고 있습니다. 농업 종사자들은 비료로 퇴비를 적절하게 사용함으로써 종종 비용을 절약할 수 있습니다. 이 부문의 양은 2023-2029년 추정 CAGR 4.8%로 성장할 것으로 예측되고 있습니다.
- 유기 비료의 소비는 연작 작물로 우위를 차지하고 있어 2022년 시장 규모의 약 85.0%를 차지했습니다. 연작작물이 우세한 것은 주로 국내에서의 재배 면적이 크기 때문으로 2022년에는 전체 유기농 작물 면적의 약 59.8%를 차지했습니다.
- 국내외 시장에서 유기제품에 대한 수요는 높고 화학 비료의 과잉사용은 이 나라의 큰 과제 중 하나입니다. 인도 정부는 유기농 비료에 인센티브를 부여함으로써 다양한 제도와 프로그램을 통해 지속가능한 유기농 실천을 추진하고 있으며, 2023-2029년 시장을 견인할 것으로 예상됩니다.
인도의 유기 비료 시장 동향
유기생산자 증가로 주로 연작작물에서 유기재배 면적 증가
- 인도는 인증된 유기 생산자의 총수로 세계 최대의 국가이며, 2019년에는 130만 명의 유기 생산자가 있습니다. 많은 유기 생산자가 있음에도 불구하고, 이 나라의 유기 재배 면적은 이 나라의 전체 농업 면적의 약 2.0%입니다. 2021년 이 나라의 유기농 면적은 711,094.0ha로 2017년과 비교해 약 3.4% 증가했습니다.
- 국내 유기농업은 여러 주에 집중되어 있습니다. 국내 유기농업 상위 10개 주가 유기농작물 총면적의 약 80.0%를 차지하고 있습니다. 유기농업의 보급률 향상으로 선진화되고 있는 주는 몇 개 있습니다. 마디야 프라데시 주, 라자스탄 주, 마하라슈트라 주가 유기농업 상위 3개 주입니다. 마디야 프라데시 주는 2019년 인도 전체 유기농 면적의 약 27.0%를 차지했습니다.
- 국내에서는 연작 작물의 유기 재배가 우세합니다. 2021년의 유기 재배 작물 총 면적의 약 59.7%를 열작물이 차지했습니다. 국내에서는 곡류 작물 생산이 우세하며 쌀, 밀, 수수, 옥수수가 주요 곡류 작물입니다. 대부분의 곡류는 칼리프기(6-9월)에 재배됩니다. 이 시기에 재배되는 작물은 주로 비에 좌우되거나 벼, 옥수수, 면화, 대두 등 더 많은 물을 필요로 합니다.
- 유기 환금 작물 전체의 재배 면적은 증가 경향에 있으며, 2017년의 27만 ha에서 2021년에는 28만 ha가 되었습니다. 이 나라에서 생산되는 주요 환금 작물에는 면화, 사탕수수, 홍차, 향신료 등이 있습니다. 현재 이 나라에서는 유기 원예 작물의 성장은 제한되어 있습니다. 유기농 제품에 대한 수요 증가와 인도 정부의 유기농 노력으로 2023-2029년 유기농 작물 재배 면적이 증가할 것으로 예상됩니다.
수요 증가와 전자상거래 채널을 통한 입수 용이성으로 유기농 식품에 대한 1인당 지출 증가
- 인도의 유기농 제품에 대한 1인당 지출은 0.23달러로, 아시아태평양의 유기농 제품에 대한 1인당 지출의 평균과 비교하면 비교적 낮습니다. 그러나 최근 소비자의 수요는 유기농 제품으로 점점 이동하고 있습니다. 유기농 제품은 면역력이 높고 품질이 높으며 전자상거래 채널을 통해 구하기 쉽기 때문입니다. 인도는 유기농 식품과 식음료의 유망한 시장입니다. 인도 내 유기농 식음료 산업은 2024년까지 1억 3,800만 달러 규모가 될 것으로 예상되며 2019-2024년 CAGR은 13%로 성장할 전망입니다.
- 2022년에는 1억 800만 달러 상당의 유기농 식품이 국내에서 소비되었습니다. 이 나라의 유기농 제품 소비액은 2016년 4,500만 달러에서 2021년에는 9,600만 달러로 증가했습니다. 유기농 식품의 매출이 증가한 것은 주로 소비자들의 의식이 높아졌기 때문이며, 고소득 소비자들이 유기농 식품과 식음료의 소비를 촉진하고 있습니다. 가장 수요가 많았던 카테고리에는 유기농 계란, 유제품, 과일 및 채소 등 필수 식품이 포함됩니다.
- 유기농 음료 소비는 시장을 독점했으며 2022년 유기농 식품과 유기농 음료의 총 시장액의 약 85.2%를 차지했습니다. 유기농 음료 부문에는 승인된 인증 기관에 의해 인증된 유기농 포장 식음료가 포함됩니다. 유기농 음료 소비액은 2020-2022년 CAGR 14%의 성장을 기록했습니다. 유기농 제품과 관련된 가격 프리미엄은 저소득층 소비자의 접근을 방해하고 유기농 식품 소비의 주요 제한 요인이 되고 있습니다. 그러나 유기농 제품의 적극적인 판매 촉진과 이점이 예측 기간 동안 유기농 식품 시장을 견인할 것으로 예상됩니다.
인도의 유기 비료 산업 개요
인도의 유기 비료 시장은 상당히 통합되어 있으며 상위 5개 기업에서 72.35%를 차지하고 있습니다. 이 시장의 주요 기업은 Coromandel International Ltd, Deepak Fertilisers & Petrochemicals Corp. Ltd, Gujarat Narmada Valley Fertilizers & Chemicals Ltd, Southern Petrochemical Industries Corp. Ltd, Swaroop Agrochemical Industries 등입니다.
기타 혜택
- 엑셀 형식 시장 예측(ME) 시트
- 3개월의 애널리스트 서포트
목차
제1장 주요 요약 및 주요 조사 결과
제2장 보고서 제안
제3장 서문
- 조사의 전제조건 및 시장 정의
- 조사 범위
- 조사 방법
제4장 주요 산업 동향
- 유기 재배 면적
- 1인당 유기농 제품에 대한 지출
- 규제 프레임워크
- 인도
- 밸류체인 및 유통 채널 분석
제5장 시장 세분화
- 형태별
- 비료
- 밀 기반 비료
- 오일 케이크
- 기타 유기 비료
- 작물 유형별
- 환금작물
- 원예작물
- 밭작물
제6장 경쟁 구도
- 주요 전략적 움직임
- 시장 점유율 분석
- 기업 상황
- 기업 프로파일
- Amruth Organic Fertilizers
- Coromandel International Ltd
- Deepak Fertilisers & Petrochemicals Corp. Ltd
- GrowTech Agri Science Private Limited
- Gujarat Narmada Valley Fertilizers & Chemicals Ltd
- Gujarat State Fertilizers & Chemicals Ltd
- Prabhat Fertilizer And Chemical Works
- Southern Petrochemical Industries Corp. Ltd
- Swaroop Agrochemical Industries
제7장 CEO에 대한 주요 전략적 질문
제8장 부록
- 세계 개요
- 개요
- Porter's Five Forces 분석 프레임워크
- 세계의 밸류체인 분석
- 시장 역학(DROs)
- 정보원 및 참고문헌
- 도표 일람
- 주요 인사이트
- 데이터 팩
- 용어집
The India Organic Fertilizer Market size is estimated at 501.4 million USD in 2025, and is expected to reach 755.7 million USD by 2030, growing at a CAGR of 8.55% during the forecast period (2025-2030).
- Organic fertilizers contain organic matter in large quantities, which boosts biological activities in soil and aids in maintaining and enhancing soil biodiversity. Organic fertilizers accounted for 69.9% of the total Indian crop nutrition segment in 2022, owing to their widespread use in organic and conventional farming.
- Meal-based fertilizers constituted the most valued organic fertilizer, accounting for 67.5% of the organic fertilizer market in 2022. However, the meat meal market, especially cattle meat-based meals, is not well accepted in India, and the production of bone meals is limited in many parts of India.
- Manures constitute the most consumed organic fertilizer in India, with the largest market share attributed to their easy availability. They are applied to almost all crops, regardless of crop variety. Farmers can often save money by properly using manure as a fertilizer. The segment's volume is projected to grow, with an estimated CAGR of 4.8% between 2023 and 2029.
- The consumption of organic fertilizers is dominant in row crops and accounted for about 85.0% of the market volume in 2022. The dominance of row crops is mainly due to their large cultivation area in the country, which accounted for approximately 59.8% of the total organic crop area in 2022.
- There is a high demand for organic products in domestic and international markets, and the overuse of chemical fertilizers is one of the major challenges in the country. The Indian government's promotion of sustainable or organic cultivation practices through various schemes or programs by providing incentives for organic fertilizers is expected to drive the market between 2023 and 2029.
India Organic Fertilizer Market Trends
Growing number of organic producers helping the increase in area under organic cultivation, primarily in row crops
- India is the largest country, in terms of the total number of certified organic producers in the world, with 1.3 million organic producers in 2019. Despite a large number of organic producers, organic cultivation areas in the country account for around 2.0% of the total agriculture area in the country. In 2021, the organic area in the country was 711,094.0 ha, which increased by about 3.4% compared to 2017.
- Organic farming in the country is concentrated in only a few states. The top ten organic farming states in the country account for about 80.0% of the total organic crop area. A few states have taken the lead in improving organic farming coverage. Madhya Pradesh, Rajasthan, and Maharashtra are the top three organic farming states in the country. Madhya Pradesh accounted for about 27.0% of India's total organic cultivation area in 2019.
- Organic cultivation of row crops is dominant in the country. Row crops accounted for about 59.7% of the total organic crop area in 2021. Cereal crop production dominates in the country, with rice, wheat, millet, and maize being the major cereals produced. Most cereal crops are grown in the Kharif season (June-September). The crops grown in this season mainly depend on rain or require more water, like rice, maize, cotton, soybean, etc.
- There has been an increasing trend in the overall organic cash crop cultivation area, from 270,000 ha in 2017 to 280,000 ha in 2021. The major cash crops produced in the country include cotton, sugarcane, tea, and spices. Currently, there is limited growth of organic horticultural crops in the country. The increasing demand for organic products and initiatives by the Indian government to go organic are anticipated to increase the organic crop area between 2023 and 2029.
Growing demand and their easy accessibility through e-commerce channels, rising the per capita spending on organic food
- India's per capita spending on organic products is relatively low at USD 0.23 compared to the average per capita spending on organic products of the Asia-Pacific region. However, in recent years, consumer demand has been increasingly shifting toward organic products as these items offer better immunity, higher quality, and more accessibility through e-commerce channels. India is a promising, developing market for organic foods and beverages. India's domestic organic food and beverage industry is expected to be worth USD 138.0 million by 2024, a CAGR of 13% between 2019 to 2024.
- In 2022, organic food and beverages worth USD 108.0 million were consumed in the country. The consumption value of organic products in the country increased from USD 45.0 million in 2016 to USD 96.0 million in 2021. Organic food sales increased mainly due to increasing consumer awareness, and high-income consumers are propelling organic food and beverage consumption. Categories that experienced the most demand included essential foods such as organic eggs, dairy, and fruits and vegetables.
- The consumption of organic beverages dominated the market and accounted for about 85.2% of the total combined organic food and beverages market value in 2022. The organic beverages segment includes organic packaged food and beverages that are certified by the approved certification body. The consumption value of organic beverages registered growth with a CAGR of 14% between 2020 to 2022. The price premium associated with organic products hampers lower-income consumer access and is the major limiting factor for organic food consumption. However, the active promotion and advantages of organic products are expected to drive the organic food market in the forecast period.
India Organic Fertilizer Industry Overview
The India Organic Fertilizer Market is fairly consolidated, with the top five companies occupying 72.35%. The major players in this market are Coromandel International Ltd, Deepak Fertilisers & Petrochemicals Corp. Ltd, Gujarat Narmada Valley Fertilizers & Chemicals Ltd, Southern Petrochemical Industries Corp. Ltd and Swaroop Agrochemical Industries (sorted alphabetically).
Additional Benefits:
- The market estimate (ME) sheet in Excel format
- 3 months of analyst support
TABLE OF CONTENTS
1 EXECUTIVE SUMMARY & KEY FINDINGS
2 REPORT OFFERS
3 INTRODUCTION
- 3.1 Study Assumptions & Market Definition
- 3.2 Scope of the Study
- 3.3 Research Methodology
4 KEY INDUSTRY TRENDS
- 4.1 Area Under Organic Cultivation
- 4.2 Per Capita Spending On Organic Products
- 4.3 Regulatory Framework
- 4.3.1 India
- 4.4 Value Chain & Distribution Channel Analysis
5 MARKET SEGMENTATION (includes market size in Value in USD and Volume, Forecasts up to 2030 and analysis of growth prospects)
- 5.1 Form
- 5.1.1 Manure
- 5.1.2 Meal Based Fertilizers
- 5.1.3 Oilcakes
- 5.1.4 Other Organic Fertilizers
- 5.2 Crop Type
- 5.2.1 Cash Crops
- 5.2.2 Horticultural Crops
- 5.2.3 Row Crops
6 COMPETITIVE LANDSCAPE
- 6.1 Key Strategic Moves
- 6.2 Market Share Analysis
- 6.3 Company Landscape
- 6.4 Company Profiles (includes Global Level Overview, Market Level Overview, Core Business Segments, Financials, Headcount, Key Information, Market Rank, Market Share, Products and Services, and Analysis of Recent Developments).
- 6.4.1 Amruth Organic Fertilizers
- 6.4.2 Coromandel International Ltd
- 6.4.3 Deepak Fertilisers & Petrochemicals Corp. Ltd
- 6.4.4 GrowTech Agri Science Private Limited
- 6.4.5 Gujarat Narmada Valley Fertilizers & Chemicals Ltd
- 6.4.6 Gujarat State Fertilizers & Chemicals Ltd
- 6.4.7 Prabhat Fertilizer And Chemical Works
- 6.4.8 Southern Petrochemical Industries Corp. Ltd
- 6.4.9 Swaroop Agrochemical Industries
7 KEY STRATEGIC QUESTIONS FOR AGRICULTURAL BIOLOGICALS CEOS
8 APPENDIX
- 8.1 Global Overview
- 8.1.1 Overview
- 8.1.2 Porter's Five Forces Framework
- 8.1.3 Global Value Chain Analysis
- 8.1.4 Market Dynamics (DROs)
- 8.2 Sources & References
- 8.3 List of Tables & Figures
- 8.4 Primary Insights
- 8.5 Data Pack
- 8.6 Glossary of Terms