
|
시장보고서
상품코드
1836496
스마트 유틸리티 관리 : 시장 점유율 분석, 산업 동향, 통계, 성장 예측(2025-2030년)Smart Utilities Management - Market Share Analysis, Industry Trends & Statistics, Growth Forecasts (2025 - 2030) |
||||||
2025년 스마트 유틸리티 관리 시장 규모는 176억 5,000만 달러로, 2030년에는 CAGR 15.7%를 나타내 366억 달러에 이를 것으로 예측되며 레거시 자산에서 데이터 중심 자동화 그리드로의 명확한 변화가 강조되고 있습니다.
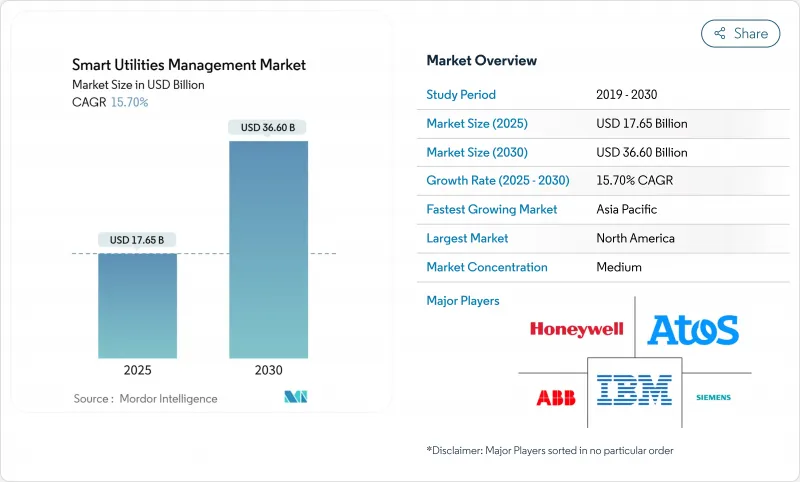
고도 계측 인프라(AMI)의 가속적 전개, 대규모 디지털 트윈의 전개, 엣지 대응 분석이 이 궤도를 지지하는 주된 힘이 되고 있습니다. 북미는 지원 규제와 그리드 현대화 예산을 배경으로 가장 규모가 큰 지역 허브로 계속되고 있습니다. 한편, 아시아태평양은 중국과 인도가 차세대 송배전을 향해 기록적인 유틸리티설비 투자를 하는 중 가장 빠른 확대를 기록하고 있습니다. 유틸리티 회사는 또한 마이크로그리드와 분산 에너지 자원(DER) 오케스트레이션 플랫폼을 채택하여 기후 변화로 인한 정전에 대한 네트워크를 강화하고 미터 뒷면의 자산을 최적화합니다. 유틸리티 기업이 복잡한 시스템 통합 및 사이버 보안 모니터링을 아웃소싱하기 때문에 조달 계획에서 소프트웨어 솔루션이 대부분을 차지하고 있지만 관리 서비스가 가장 빠르게 증가하고 있습니다.
세계의 스마트 유틸리티 관리 시장 동향과 인사이트
스마트시티 도입 증가
지자체의 계획 담당자가 전력, 물, 교통, 폐기물의 통합 운용을 요구하고 있기 때문에 스마트 시티 프로그램은 엔드 투 엔드의 유틸리티 디지털화를 가속화하고 있습니다. 싱가포르의 푼골 디지털 지구는 에너지, 냉방 및 이동성 데이터를 단일 명령 플랫폼으로 통합하는 지구 수준의 스마트 그리드를 구축하고 있습니다. 중국의 차량 투 그리드 조종사는 연결된 전기자동차를 사용하여 지역 배전 부하의 균형을 맞추고 스마트 이동성과 에너지 관리의 융합을 보여줍니다. 중동에서는 두바이의 전력·수도국이 스마트 그리드 로드맵에 19억 달러를 투입해, 유틸리티을 도시 전체의 최적화를 위한 디지털 백본으로 자리잡고 있습니다. 이러한 이니셔티브는 강력한 네트워크 효과를 창출합니다. 일단 기본 원격 측정이 도입되면 교통 신호에서 폐기물 물류에 이르기까지 추가 도시 기능이 동일한 데이터 척추를 타고 통합 유틸리티 플랫폼에 대한 수요가 증폭됩니다.
선진 계측 인프라에 대한 정부의 의무
법규제는 단기 보급을 촉진하는 가장 강력한 촉임베디드니다. 호주에서는 현재 2030년까지 전국 전력 시장 전체에 스마트 미터를 보급할 것을 의무화하고 있으며, 고재생 가능 그리드에 있어서 스마트 미터는 "양도할 수 없는" 것으로 선언하고 있습니다. 미국에서는 2020년 에너지법에 의해 연방 시설에 매일 검침 가능한 고도 수도 미터의 설치가 의무화되고 있습니다. 프랑스의 전국 링키 프로그램은 의무화를 통해 5년 이내에 90%의 가구 보급률을 달성하고 수출 시장에 파급되는 성능 기준을 설정하는 방법을 보여줍니다. 수량 보증은 공급업체에게 단가를 줄이고 제품을 공통 표준에 맞추기 위한 규모를 제공하여 후발 유틸리티자 채용 위험을 줄입니다.
스마트 미터의 높은 비용, 보안 및 통합 문제
특히 고객 1인당 수익이 낮을 경우 총소유비용 장애물은 여전히 높습니다. AMI의 완전한 변환에는 변전소 업그레이드, 헤드엔드 교체, 새로운 사이버 보안 레이어가 필요한 경우가 많으며, 미터의 하드웨어 이외의 설비 투자를 밀어 올립니다. 미국 국립의학 도서관에 게재된 설문조사는 연결된 미터마다 공격 벡터를 추가하고 그리드의 위협 측면이 확대될 것이라고 경고합니다. 공급업체가 API를 제한하거나 자체 펌웨어를 적용하면 그리드 서비스 참여를 제한하는 폐쇄형 배터리 생태계를 둘러싼 호주 토론에서 볼 수 있듯이 상호 운용성이 저하됩니다. 반도체 공급 핍박으로 인한 부품 부족은 리드 타임을 길게 늘리고 가격을 급등시키고 있습니다. 비용에 민감한 경제 유틸리티 기업은이 요인을 흡수하거나 소비자에게 전가해야합니다.
보고서에서 분석된 기타 성장 촉진요인 및 억제요인
- 분산형 에너지 자원(DER)과 마이크로그리드의 통합
- 에너지 효율 개선
- 복잡하게 진화하는 데이터 프라이버시 규정
부문 분석
미터 데이터 관리 시스템(MDMS)은 2024년 매출액 48.3%에서 선두를 유지했고 전력 회사가 인터벌 측정을 대규모로 수집, 검증, 분석하는 것을 선호하고 있음을 확인했습니다. 이 부문의 규모는 정전, 노동력, 자산 건강 용도에 공급하는 광범위한 분석 모듈의 앵커로도 자리잡고 있으며, 공급업체의 잠금을 강화하고 플랫폼 고정에 박차를 가하고 있습니다. 첨단 정전 관리 시스템은 유틸리티 기업이 기후에 좌우되는 이상 기상에 직면하는 가운데 CAGR 15.9%를 나타낼 전망입니다. 또한 AI를 활용한 토폴로지 모델링에 의해 고장 부분의 특정이 몇 시간에서 몇 분으로 단축되고 있습니다. CenterPoint Energy와 Neara의 허리케인 후의 파트너십은 유틸리티 기업들이 폭풍의 계절 전에 클라우드 네이티브 시뮬레이션 툴을 조달하여 네트워크 스트레스 테스트를 수행하는 방법을 돋보이게 합니다. 멀티 용도의 융합이 진행됨에 따라 MDMS를 SCADA, 지리 정보 시스템, DERMS와 조화시키는 벤더의 능력이 구매의 결정수가 되는 케이스가 늘어나고 있어, 인티그레이터는 모듈을 통합 라이선스에 번들하게 되고 있습니다.
이 컨버전스의 2차적인 영향은 유틸리티 기업 내에서 기술 격차의 확대를 포함합니다. 레거시 SCADA에 익숙한 운영자는 확률적 예측과 머신러닝으로 인한 출력을 해석해야 하며, 유틸리티 기업은 교육 프로그램 및 관리 운영 계약을 조타해야 합니다. MDMS를 운영 인텔리전스 커널로 자리매김하는 공급업체는 고객 참여, 현장 서비스 자동화, 사이버 응답 등의 다운스트림 수익을 확보하여 스마트 유틸리티 관리 시장의 장기적인 현금 흐름 프로파일을 강화하고 있습니다.
2024년 지출은 소프트웨어가 57.5%를 차지했고 분석, 시각화, 자동화 레이어의 가치 높이를 반영했습니다. 유틸리티 소프트웨어의 핵심에는 코드가 필요 없는 대시보드, 역할 기반 액세스 및 AI 지원 구성이 포함되어 시운전 사이클이 몇 달에서 며칠로 단축되었습니다. 동시에 유틸리티 회사는 라이선스 모델을 영구 계약에서 구독으로 전환하고 있으며, 운영을 평활화하면서 공급업체의 평생 고객 가치를 확대하고 있습니다. 이 서비스는 규모가 작고 통합 및 사이버 보안 수요가 기존 유틸리티 기업의 능력을 벗어나기 때문에 CAGR 16.3%를 나타낼 전망입니다. 베오리아와 미스트랄 AI의 협업은 그 상징적인 예입니다. 이 회사는 플랜트 관리자가 자연어로 자산 효율성을 조회할 수 있도록 생성된 AI 채팅 인터페이스를 통합하여 본질적으로 도메인 데이터를 의사결정 지원으로 변환합니다.
하드웨어 매출은 그리드 엣지 시각화에 여전히 중요합니다. 따라서 공급업체는 펌웨어 라이선스, 연장 보증 및 관리형 업그레이드 프로그램을 번들하여 지속적인 수익을 보장합니다. 이와 병행하여 클라우드 하이퍼스케일러는 NERC CIP와 ISO 27001 인증을 받은 섹터별 환경을 유틸리티 기업에 제공함으로써 인식되는 위험을 줄이고 스마트 유틸리티 관리 시장에서 클라우드의 축족을 가속화하고 있습니다.
지역 분석
북미는 연방 정부의 보조금, 주 수준의 회복력 의무, 적극적인 투자자 소유의 유틸리티(IOU)의 설비 투자 계획의 동기 사이클에 의해 2024년에 38.6%의 매출을 유지했습니다. AMI의 보급률은 모든 미터의 80%를 넘어 DERMS, 정전 예측, 고객 중심의 이용 시간 가격 설정에 관심이 옮겨지고 있습니다. 유럽은 계속 탈탄소화와 에너지의 자립을 우선하고, 용량계획과 국경을 넘은 상호접속에 있어서의 사이버 보안 강화를 위한 디지털 트윈을 지지하고 있습니다.
그러나 아시아태평양은 중국의 2025년 국가전망 예산 887억 달러와 인도의 송전 업그레이드 청사진 1,090억 달러에 지지되어 CAGR 16.0%를 나타낼 전망입니다. 이 지역 정부는 디지털 네트워크를 대규모 재생에너지 통합과 도시화 정책의 전제조건으로 간주합니다. 따라서 공급업체의 전략은 비용 최적화 하드웨어, 다국어 인터페이스 및 입찰 규칙을 피하기 위한 현지 서비스 파트너십에 중점을 둡니다. 동남아시아의 소규모 시장은 조기 참가자의 플레이북을 재현함으로써 보급 곡선을 압축하고 스마트 유틸리티 관리 시장의 평균을 웃도는 성장을 유지하고 있습니다.
기타 혜택 :
- 엑셀 형식 시장 예측(ME) 시트
- 3개월간의 애널리스트 서포트
목차
제1장 서론
- 조사 전제조건과 시장 정의
- 조사 범위
제2장 조사 방법
제3장 주요 요약
제4장 시장 상황
- 시장 개요
- 시장 성장 촉진요인
- 스마트 시티 도입 증가
- 선진 계측 인프라에 대한 정부의 의무화
- 분산형 에너지 자원(DER)과 마이크로그리드의 통합
- 에너지 효율 개선
- 유틸리티에서의 IoT 엣지 분석 확대
- 수도·가스 네트워크에의 디지털 트윈 채용
- 시장 성장 억제요인
- 스마트 미터의 고비용, 보안, 통합의 과제
- 복잡하고 진화하는 데이터 프라이버시 규제
- 독자적인 에코시스템에 의한 상호 운용성의 갭
- 지방의 노후화된 통신 인프라에의 의존
- 밸류체인 분석
- 규제 상황
- 기술적 전망
- Porter's Five Forces 분석
- 공급기업의 협상력
- 소비자의 협상력
- 신규 참가업체의 위협
- 대체품의 위협
- 경쟁 기업 간 경쟁 관계의 강도
- 거시 경제 동향이 시장에 미치는 영향 평가
제5장 시장 규모 및 성장 예측(금액)
- 유형별
- 계량 데이터 관리 시스템
- 에너지 모니터링/관리
- 스마트 배전 관리
- 첨단 정전 관리 시스템
- 구성 요소별
- 하드웨어
- 소프트웨어
- 서비스
- 유틸리티 유형별
- 전력
- 수도
- 가스
- 배포 모드별
- On-Premise
- 클라우드
- 지역별
- 북미
- 미국
- 캐나다
- 멕시코
- 유럽
- 독일
- 영국
- 프랑스
- 이탈리아
- 스페인
- 기타 유럽
- 아시아태평양
- 중국
- 일본
- 인도
- 한국
- 호주 및 뉴질랜드
- 기타 아시아태평양
- 남미
- 브라질
- 아르헨티나
- 기타 남미
- 중동 및 아프리카
- 중동
- 사우디아라비아
- 아랍에미리트(UAE)
- 튀르키예
- 기타 중동
- 아프리카
- 남아프리카
- 이집트
- 나이지리아
- 기타 아프리카
- 북미
제6장 경쟁 구도
- 시장 집중도
- 전략적 동향
- 시장 점유율 분석
- 기업 프로파일
- IBM Corporation
- Siemens AG
- Honeywell International Inc.
- ABB Ltd
- Cisco Systems Inc.
- Atos SE
- Itron Inc.
- Schneider Electric SE
- Oracle Corp.
- Landis Gyr AG
- Aclara Technologies LLC
- Sensus(Xylem Inc.)
- Kamstrup A/S
- Trilliant Holdings
- Powel ASA
- GE Digital
- Eaton Corp. plc
- Silver Spring Networks(Itron)
- Enel X
- Huawei Technologies Co.
제7장 시장 기회와 전망
KTH 25.10.27The smart utilities management market size stood at USD 17.65 billion in 2025 and is forecast to reach USD 36.60 billion by 2030 at a 15.7% CAGR, underscoring a clear shift from legacy assets to data-centric, automated grids.
Accelerated rollouts of advanced metering infrastructure (AMI), large-scale digital-twin deployments, and edge-enabled analytics are the chief forces sustaining this trajectory. North America remains the largest regional hub on the back of supportive regulation and grid-modernization budgets, while Asia-Pacific registers the fastest expansion as China and India direct record utility capex toward next-generation transmission and distribution. Utilities are also adopting microgrids and distributed energy resource (DER) orchestration platforms to harden networks against climate-driven outages and optimize behind-the-meter assets. Software solutions dominate procurement plans, yet managed services are rising fastest as utilities outsource complex system integration and cybersecurity oversight.
Global Smart Utilities Management Market Trends and Insights
Rise in Smart City Deployment
Smart-city programs are accelerating end-to-end utility digitalization as municipal planners demand integrated power, water, transport, and waste operations. Singapore's Punggol Digital District is deploying a district-level smart grid that unifies energy, cooling, and mobility data into a single command platform. China's vehicle-to-grid pilots are using connected electric vehicles to balance local distribution loads, signaling convergence between smart mobility and energy management. In the Middle East, Dubai Electricity and Water Authority committed USD 1.9 billion to its smart-grid roadmap, positioning utilities as digital backbones for city-wide optimization. These initiatives create strong network effects: once foundational telemetry is in place, additional city functions-from traffic lights to waste logistics-can ride on the same data spine, amplifying demand for unified utility platforms.
Government Mandates for Advanced Metering Infrastructure
Legislation is the single most powerful catalyst for near-term rollouts. Australia now requires universal smart meters across the National Electricity Market by 2030, declaring them "non-negotiable" for high-renewable grids. In the United States, the Energy Act of 2020 obliges federal facilities to install advanced water meters capable of daily readings. France's nationwide Linky program showcases how a mandate can hit 90% household coverage within five years, setting performance benchmarks that ripple into export markets. Guaranteed volume commitments give vendors scale to cut unit costs and conform products to common standards, thereby lowering adoption risk for late-moving utilities.
High Cost, Security and Integration Challenges for Smart Meters
Total-cost-of-ownership hurdles persist, especially where per-customer revenue is low. Full AMI conversions often require substation upgrades, head-end replacements, and new cybersecurity layers, driving up capex beyond meter hardware. Research published in the National Library of Medicine warns that each connected meter introduces an additional attack vector, expanding the grid's threat surface. Interoperability suffers when vendors restrict APIs or apply proprietary firmware, as illustrated by Australian debates over closed battery ecosystems that limit participation in grid services. Component shortages, driven by semiconductor supply tightness, are prolonging lead times and inflating prices-factors that utilities in cost-sensitive economies must absorb or pass through to consumers.
Other drivers and restraints analyzed in the detailed report include:
- Integration of Distributed Energy Resources (DERs) and Microgrids
- Improvements in Energy Efficiency
- Complex, Evolving Data-Privacy Regulations
For complete list of drivers and restraints, kindly check the Table Of Contents.
Segment Analysis
Meter data management systems (MDMS) retained leadership with 48.3% revenue in 2024, underscoring utilities' priority to collect, validate, and analyze interval readings at scale. The segment's size also positions it as the anchor for broader analytics modules that feed outage, workforce, and asset-health applications, reinforcing vendor lock-in and fueling platform stickiness. Advanced outage management systems are accelerating at a 15.9% CAGR as utilities confront climate-driven extreme-weather events; AI-enabled topology modeling is shrinking fault-location windows from hours to minutes. CenterPoint Energy's post-hurricane partnership with Neara highlights how utilities procure cloud-native simulation tools to stress-test networks before storm seasons. As multi-application convergence continues, purchasing decisions increasingly factor a vendor's ability to harmonize MDMS with SCADA, geographic information systems, and DERMS, driving integrators to bundle modules in unified licenses.
A second-order effect of this convergence is the widening skills gap inside utilities. Operators accustomed to legacy SCADA must now interpret probabilistic forecasts and machine-learning outputs, steering utilities toward training programs or managed-operations contracts. Vendors that position MDMS as the kernel for operational intelligence are capturing downstream revenues in customer engagement, field-service automation, and cyber-response, strengthening the long-term cash-flow profile of the smart utilities management market.
Software accounted for 57.5% of spending in 2024, reflecting the high value assigned to analytics, visualization, and automation layers. Core utility software now embeds no-code dashboards, role-based access, and AI-assisted configuration, reducing commissioning cycles from months to days. Simultaneously, utilities are migrating license models from perpetual to subscription, smoothing opex but enlarging lifetime customer value for vendors. Services, although smaller, are expanding at 16.3% CAGR because integration and cybersecurity demands fall outside traditional utility competencies. Veolia's collaboration with Mistral AI is emblematic: the firm is embedding generative AI chat interfaces so plant managers can query asset efficiency in natural language, essentially converting domain data into decision support.
Hardware sales remain critical for grid-edge visibility-particularly in emerging markets embarking on first-wave smart-meter rollouts-but margins are tightening. Suppliers, therefore, bundle firmware licenses, extended warranties, and managed-upgrade programs to lock in recurring revenue. In parallel, cloud hyperscalers court utilities with sector-specific environments certified for NERC CIP and ISO 27001, lowering perceived risk and accelerating the cloud pivot inside the smart utilities management market.
The Smart Utilities Management Market Report is Segmented by Type (Meter Data Management Systems, Energy Monitoring / Management, Smart Distribution Management, and Advanced Outage Management Systems), Component (Hardware, Software, and Services), Utility Type (Electricity, Water, and Gas), Deployment Mode (On-Premise and Cloud), and Geography. The Market Forecasts are Provided in Terms of Value (USD).
Geography Analysis
North America retained 38.6% revenue in 2024 thanks to a synchronized cycle of federal grants, state-level resiliency mandates, and aggressive investor-owned utility (IOU) capex plans. Penetration of AMI exceeds 80% of all meters, shifting attention to DERMS, outage prediction, and customer-centric time-of-use pricing. Europe continues to prioritize decarbonization and energy independence, championing digital twins for capacity planning and cybersecurity hardening across cross-border interties.
Asia-Pacific, however, posts the fastest 16.0% CAGR, anchored by China's USD 88.7 billion State Grid budget for 2025 and India's USD 109 billion transmission upgrade blueprint. Governments in the region view digital networks as a prerequisite for large-scale renewable integration and urbanization policies. Vendor strategies, therefore, emphasize cost-optimized hardware, multilingual interfaces, and local-services partnerships to navigate tender rules. Smaller Southeast Asian markets replicate early mover playbooks, compressing adoption curves and sustaining above-average growth for the smart utilities management market.
- IBM Corporation
- Siemens AG
- Honeywell International Inc.
- ABB Ltd
- Cisco Systems Inc.
- Atos SE
- Itron Inc.
- Schneider Electric SE
- Oracle Corp.
- Landis+Gyr AG
- Aclara Technologies LLC
- Sensus (Xylem Inc.)
- Kamstrup A/S
- Trilliant Holdings
- Powel ASA
- GE Digital
- Eaton Corp. plc
- Silver Spring Networks (Itron)
- Enel X
- Huawei Technologies Co.
Additional Benefits:
- The market estimate (ME) sheet in Excel format
- 3 months of analyst support
TABLE OF CONTENTS
1 INTRODUCTION
- 1.1 Study Assumptions and Market Definition
- 1.2 Scope of the Study
2 RESEARCH METHODOLOGY
3 EXECUTIVE SUMMARY
4 MARKET LANDSCAPE
- 4.1 Market Overview
- 4.2 Market Drivers
- 4.2.1 Rise in Smart City Deployment
- 4.2.2 Government Mandates for Advanced Metering Infrastructure
- 4.2.3 Integration of Distributed Energy Resources (DERs) and Microgrids
- 4.2.4 Improvements in Energy Efficiency
- 4.2.5 Expansion of IoT-Edge Analytics in Utilities
- 4.2.6 Digital-Twin Adoption for Water and Gas Networks
- 4.3 Market Restraints
- 4.3.1 High Cost, Security and Integration Challenges for Smart Meters
- 4.3.2 Complex, Evolving Data-Privacy Regulations
- 4.3.3 Interoperability Gaps from Proprietary Ecosystems
- 4.3.4 Rural Dependence on Aging Telecom Infrastructure
- 4.4 Value Chain Analysis
- 4.5 Regulatory Landscape
- 4.6 Technological Outlook
- 4.7 Porter's Five Forces Analysis
- 4.7.1 Bargaining Power of Suppliers
- 4.7.2 Bargaining Power of Consumers
- 4.7.3 Threat of New Entrants
- 4.7.4 Threat of Substitute Products
- 4.7.5 Intensity of Competitive Rivalry
- 4.8 Assessment of the Impact of Macroeconomic Trends on the Market
5 MARKET SIZE AND GROWTH FORECASTS (VALUE)
- 5.1 By Type
- 5.1.1 Meter Data Management Systems
- 5.1.2 Energy Monitoring / Management
- 5.1.3 Smart Distribution Management
- 5.1.4 Advanced Outage Management Systems
- 5.2 By Component
- 5.2.1 Hardware
- 5.2.2 Software
- 5.2.3 Services
- 5.3 By Utility Type
- 5.3.1 Electricity
- 5.3.2 Water
- 5.3.3 Gas
- 5.4 By Deployment Mode
- 5.4.1 On-Premise
- 5.4.2 Cloud
- 5.5 By Geography
- 5.5.1 North America
- 5.5.1.1 United States
- 5.5.1.2 Canada
- 5.5.1.3 Mexico
- 5.5.2 Europe
- 5.5.2.1 Germany
- 5.5.2.2 United Kingdom
- 5.5.2.3 France
- 5.5.2.4 Italy
- 5.5.2.5 Spain
- 5.5.2.6 Rest of Europe
- 5.5.3 Asia-Pacific
- 5.5.3.1 China
- 5.5.3.2 Japan
- 5.5.3.3 India
- 5.5.3.4 South Korea
- 5.5.3.5 Australia and New Zealand
- 5.5.3.6 Rest of Asia-Pacific
- 5.5.4 South America
- 5.5.4.1 Brazil
- 5.5.4.2 Argentina
- 5.5.4.3 Rest of South America
- 5.5.5 Middle East and Africa
- 5.5.5.1 Middle East
- 5.5.5.1.1 Saudi Arabia
- 5.5.5.1.2 United Arab Emirates
- 5.5.5.1.3 Turkey
- 5.5.5.1.4 Rest of Middle East
- 5.5.5.2 Africa
- 5.5.5.2.1 South Africa
- 5.5.5.2.2 Egypt
- 5.5.5.2.3 Nigeria
- 5.5.5.2.4 Rest of Africa
- 5.5.1 North America
6 COMPETITIVE LANDSCAPE
- 6.1 Market Concentration
- 6.2 Strategic Moves
- 6.3 Market Share Analysis
- 6.4 Company Profiles (includes Global overview, Market overview, Core Segments, Financials, Strategic Info, Market Rank/Share, Products and Services, Recent Developments)
- 6.4.1 IBM Corporation
- 6.4.2 Siemens AG
- 6.4.3 Honeywell International Inc.
- 6.4.4 ABB Ltd
- 6.4.5 Cisco Systems Inc.
- 6.4.6 Atos SE
- 6.4.7 Itron Inc.
- 6.4.8 Schneider Electric SE
- 6.4.9 Oracle Corp.
- 6.4.10 Landis+Gyr AG
- 6.4.11 Aclara Technologies LLC
- 6.4.12 Sensus (Xylem Inc.)
- 6.4.13 Kamstrup A/S
- 6.4.14 Trilliant Holdings
- 6.4.15 Powel ASA
- 6.4.16 GE Digital
- 6.4.17 Eaton Corp. plc
- 6.4.18 Silver Spring Networks (Itron)
- 6.4.19 Enel X
- 6.4.20 Huawei Technologies Co.
7 MARKET OPPORTUNITIES AND FUTURE OUTLOOK
- 7.1 White-Space and Unmet-Need Assessment
