


|
시장보고서
상품코드
1850996
합성 흑연 시장 : 시장 점유율 분석, 산업 동향, 통계, 성장 예측(2025-2030년)Synthetic Graphite - Market Share Analysis, Industry Trends & Statistics, Growth Forecasts (2025 - 2030) |
||||||
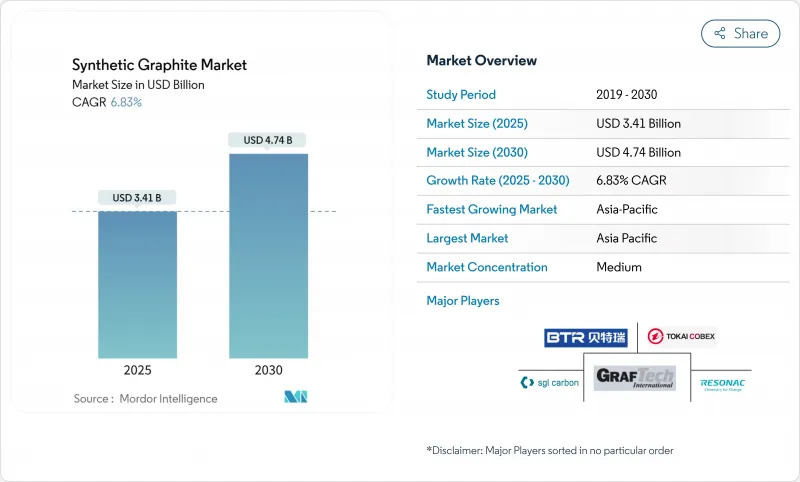
합성 흑연 시장의 규모는 2025년에 34억 1,000만 달러, 2030년에는 47억 4,000만 달러에 이를 것으로 예측되며, 2025-2030년의 CAGR은 6.83%로 예상됩니다.
고성능 전기자동차 및 계통 축전지에는 급속 충전, 긴 항속 거리, 안정된 사이클 수명을 가능하게 하는 음극 재료가 필요하기 때문에 수요가 확대되고 있습니다. 동시에, 전기 아크로(EAF) 철강 제조 업체는 3,000°C의 공정 온도를 견디는 흑연 전극에 의존하기 때문에 합성 흑연 시장의 대량 기준선이 확보되어 있습니다. 제조업체 각사는 또한 소형 모듈러 원자로의 원자력 등급 부품을 타겟으로 하고 있으며 특수강종을 새로운 수익 풀로 밀어 올리고 있습니다. 현재의 생산능력과 최종용도의 소비량은 아시아태평양이 압도적으로 많지만, 북미는 국내 공급망을 구축하기 위해 공적 자금을 투입한 프로젝트를 진행하고 있습니다. 에너지 전환과 야금 근대화라는 이중 요인으로 인해 생산자가 비용 인플레이션과 탈탄소화 압력 증가에 직면하고 있음에도 불구하고 합성 흑연 시장은 계속 확대되고 있습니다.
세계의 합성 흑연 시장의 동향과 인사이트
전기차 수요 증가
자동차 제조업체는 배출가스 규제 강화에 대응하기 위해 배터리 생산량을 증가시키고 있으며, 균일한 입자경, 낮은 불순물 수준, 수천 사이클에 걸친 안정된 성능을 실현하는 합성 흑연 음극재에 대한 수요가 급증하고 있습니다. 미국 에너지부는 2035년까지 국내 배터리 생산 능력이 6배로 증가할 것으로 예측하고 있으며, 7억 5,400만 달러의 조건부 대출을 받은 NOVONIX의 3만 1,500톤/년 테네시 공장을 지원하고 있습니다. 파나소닉 에너지는 이미 공급 라인을 단축하고 스코프 3 배출을 억제하기 위해 북미의 소재 1만 톤을 4년간 인수하는 계약을 맺고 있습니다. 4°C 이상의 충전 속도를 실현하는 새로운 셀 화학은 다공성을 조정한 초고순도 합성 입자에 의존하고 있으며, 합성 흑연 시장의 프리미엄 하위 부문을 활성화하고 있습니다. 중국 공급을 둘러싼 지정학적 리스크 증가는 유럽과 한국에서의 병행 투자를 촉진하고, 전지 등급 생산에 있어서 여러 지역의 성장세를 강화하고 있습니다.
철강 생산에서 전기 아크로 공정의 사용 확대
세계 철강 제조업체는 운전시 CO2 원단위를 줄이기 위해 고로에서 전기 아크로로의 전환을 진행하고 있으며, 각 전기 아크로는 소모품인 흑연 전극에 의존하고 있습니다. 인도, 베트남 및 걸프 협력 회의의 지역 설비 투자 파이프라인은 열당 150톤 이상의 용광로를 수십기 추가하여 향후 10년 동안 안정된 전극의 오프테이크로 이어질 것입니다. 균열과 산화는 비율 소비를 증가시키고 용융점의 수율을 방해하기 때문에 적절한 취급, 검사 및 정렬이 여전히 중요합니다. 전극 벤더는 유지 보수 권고 서비스를 번들로 제공하여 고객을 확보하는 한편 추가 수익을 얻습니다. 이러한 야금의 근대화는 배터리 수요가 고성장을 가져오는 가운데 합성 흑연 시장의 안정된 장기 사이클의 기반을 뒷받침합니다.
흑연의 높은 생산 비용
합성 흑연의 가격은 수주 동안 3,000°C에서 에너지를 소비하는 고온 흑연 공정을 반영하여 2만 달러 t 가까이에서 추이하고 있습니다. 배터리 셀 설계자는 중요한 속도 성능을 유지하면서 음극 비용을 억제하기 위해 천연 등급과 합성 등급을 혼합하여 대응합니다. 생산자는 1,500°C에서 터보스트래틱 탄소를 형성하는 NETL의 석탄 폐기물 유래 공정과 같은 새로운 저온 촉매 경로를 연구하고 있으며, 미래 용량에 대한 보다 선명한 비용 곡선을 보장하고 있습니다. 당분간 천연 플레이크 모양의 흑연과의 가파른 비용 델타는 특히 양산차에서 가격 경쟁을 벌이는 중견 셀 제조 업체에게 마진 압력이 될 것입니다.
부문 분석
야금은 2024년 합성 흑연 시장 규모의 49%를 유지했으며 롱 사이클 철강 생산에 있어서 안정된 전극 소비에 의해 지지되고 있습니다. EAF 용강 1톤당 1.8-2.2kg의 전극이 소비되므로 정기적인 교환 수요가 보장됩니다. 그러나 전지는 가장 급성장하고 있는 용도이며 EV와 거치형 축전설비 증가에 따라 CAGR 전망 8.39%로 성장을 지속하고 있습니다. 배터리 수요는 부극의 품질 사양을 높여 합성 흑연 공장에서의 연속 혼합과 미크론 수준의 분급 투자를 가속화하고 있습니다.
지역 분석
아시아태평양은 합성 흑연 시장의 56%를 차지하였으며, 2023년 세계 흑연 생산량에서 중국의 77% 점유율과 각 지역의 EAF 확장에 의해 지지되어 2030년까지 연평균 복합 성장률(CAGR) 7.67%로 확대될 전망입니다. 베이징의 고순도 흑연에 대한 2023년 후반 수출허가제도는 공급망의 리스크를 높이고 한국, 일본, 인도의 셀 제조업체가 대체 소스를 확보하는 동기를 제공했습니다.
북미는 전례없는 재공유의 물결에 휩쓸리고 있습니다. 미국 에너지부가 노보닉스에 조건부로 7억 5,400만 달러를 대출함으로써 연간 32만 5,000대의 EV에 대응할 수 있는 3만 1,500톤/년의 테네시 공장이 건설 가능하게 되어, 수입 의존도가 저하되었습니다. 국립 에너지 기술 연구소의 병행 연구 개발은 석탄 폐기물을 저온에서 배터리 등급의 흑연으로 변환하고 비용 경쟁력 있는 수직 통합 공급 체인을 시사합니다.
유럽은 지속가능성 리더십에 중점을 둡니다. 노르웨이에 있는 비아노드의 재생에너지에 의한 파일럿 라인은 현재 1.9kg-CO2 kg-1의 배출량을 기록하고 있으며 2030년까지 1.0kg-CO2를 목표로 하고 있습니다. 독일과 프랑스는 바이오의 원료를 도입할 수 있는 리그닌 투 카본 프로그램을 육성하고 있으며, 원료 리스크를 분산하고 합성 흑연 시장의 저탄소화를 강화하고 있습니다.
기타 혜택
- 엑셀 형식 시장 예측(ME) 시트
- 3개월간의 애널리스트 서포트
목차
제1장 서론
- 조사의 전제조건과 시장의 정의
- 조사 범위
제2장 조사 방법
제3장 주요 요약
제4장 시장 상황
- 시장 개요
- 시장 성장 촉진요인
- 전기자동차 수요 증가
- 철강 생산에 있어서의 전기 아크로 공정의 이용 확대
- 초고순도 음극재를 필요로 하는 프리미엄 EV 모델의 급속 충전
- 아시아와 중동 및 아프리카에서 초고출력 전기로 설비의 급증
- 선진 모듈로가 원자력급 흑연 수요를 회복
- 시장 성장 억제요인
- 흑연의 고생산 비용
- 천연 흑연과의 가격차가 OEM 음극재 블렌드를 견인
- 엄격한 환경 규제
- 밸류체인 분석
- Porter's Five Forces
- 공급기업의 협상력
- 구매자의 협상력
- 신규 참가업체의 위협
- 대체품의 위협
- 경쟁도
제5장 시장 규모와 성장 예측(가치 및 수량)
- 용도별
- 배터리
- 야금
- 부품 및 부품
- 핵
- 기타
- 제품 유형별
- 흑연 음극
- 흑연 블록
- 기타 유형
- 최종 사용자 업계별
- 자동차
- 철강 및 금속
- 에너지 및 전력
- 전자공학과 전기공학
- 화학 및 석유화학
- 항공우주 및 방위
- 기타
- 지역별
- 아시아태평양
- 중국
- 인도
- 일본
- 한국
- 인도네시아
- 말레이시아
- 태국
- 베트남
- 기타 아시아태평양
- 북미
- 미국
- 캐나다
- 멕시코
- 유럽
- 독일
- 영국
- 프랑스
- 이탈리아
- 스페인
- 북유럽 국가
- 러시아
- 기타 유럽
- 남미
- 브라질
- 아르헨티나
- 콜롬비아
- 중동 및 아프리카
- 사우디아라비아
- 아랍에미리트(UAE)
- 남아프리카
- 나이지리아
- 이집트
- 기타 중동 및 아프리카
- 아시아태평양
제6장 경쟁 구도
- 시장 집중도
- 전략적 동향
- 시장 점유율 분석
- 기업 프로파일
- Anovion LLC
- Asbury Carbons
- BTR New Material Group Co., Ltd.
- GrafTech International
- Graphit Kropfmuhl GmbH
- Graphite India Limited
- HEG Limited
- Imerys
- Mersen
- Mitsubishi Chemical Group Corporation
- Nippon Carbon Co Ltd.
- NOVONIX Ltd.
- Resonac Holdings Corporation
- SGL Carbon
- Shanghai PTL New Energy Technology Co., Ltd.
- Shanghai Shanshan Technology Co., Ltd.
- Superior Graphite
- Tokai COBEX GmbH
- Vianode
제7장 시장 기회와 미래 전망
CSM 25.11.20The synthetic graphite market size is valued at USD 3.41 billion in 2025 and is forecast to reach USD 4.74 billion by 2030, reflecting a 6.83% CAGR over 2025-2030.
Demand is advancing because high-performance electric vehicles and grid storage batteries require anode materials that permit faster charging, longer range, and consistent cycle life. At the same time, electric-arc-furnace (EAF) steelmakers rely on graphite electrodes that tolerate 3,000 °C process temperatures, locking in a large volume baseline for the synthetic graphite market. Manufacturers also target small modular reactors' nuclear-grade components, pushing specialty grades into new revenue pools. Asia-Pacific dominates current production capacity and end-use consumption, while North America is mobilizing public-funded projects to build domestic supply chains. The dual pull of energy transition and metallurgical modernization keeps the synthetic graphite market expanding even though producers face cost inflation and mounting decarbonization pressure.
Global Synthetic Graphite Market Trends and Insights
Increasing Demand for Electric Vehicles
Automakers are ramping battery output to meet tightening emissions rules, driving a steep demand for synthetic graphite anodes that deliver uniform particle size, low impurity levels, and stable performance across thousands of cycles. The U.S. Department of Energy projects a six-fold increase in domestic battery capacity by 2035, a trajectory underpinning NOVONIX's 31,500 t pa Tennessee plant backed by a USD 754 million conditional loan. Panasonic Energy has already locked in a four-year off-take for 10,000 t of North American material to shorten supply lines and curb Scope 3 emissions. New cell chemistries that raise charging rates above 4C count on ultra-pure synthetic particles with tailored porosity, invigorating the premium sub-segment of the synthetic graphite market. Heightened geopolitical risk around Chinese supply is prompting parallel investments in Europe and South Korea, reinforcing multi-regional growth momentum in battery-grade output.
Growing Utilization of Electric ARC Furnace Process for Steel Production
Steelmakers worldwide are shifting away from blast furnaces to electric-arc furnaces to cut operational CO2 intensity, and each EAF relies on consumable graphite electrodes. Regional capex pipelines in India, Vietnam, and the Gulf Cooperation Council add dozens of furnaces rated above 150 t per heat, translating to steady electrode off-take over the next decade. Proper handling, inspection, and alignment remain critical because cracks or oxidation raise specific consumption rates and hinder melt shop yields. Electrode vendors are bundling maintenance advisory services, deepening customer lock-in while capturing incremental revenue. This metallurgical modernization anchors a stable, long-cycle foundation under the synthetic graphite market even as battery demand injects high-growth upside.
High Cost of Production of Graphite
Synthetic graphite prices hover near USD 20,000 t, reflecting the high-temperature graphitization step that consumes energy at 3,000 °C over several weeks. Battery cell designers have responded by blending natural and synthetic grades to cap anode cost while retaining critical rate capability. Producers are investigating new low-temperature catalytic routes such as NETL's coal-waste-derived process that forms turbostratic carbon at 1,500 °C, promising sharper cost curves for future capacity. In the interim, the steep cost delta with natural flake graphite creates margin pressure, especially for mid-tier cell makers competing on price in mass-market vehicles.
Other drivers and restraints analyzed in the detailed report include:
- Faster-Charging Premium EV Models Requiring Ultra-High-Purity Anodes
- Surge in Ultra-High-Power EAF Installations in Asia and the Middle-East and Africa
- Strict Environmental Regulations
For complete list of drivers and restraints, kindly check the Table Of Contents.
Segment Analysis
Metallurgy retained 49% of the synthetic graphite market size in 2024, underpinned by steady electrode consumption in long-cycle steel production. Each tonne of liquid steel in an EAF consumes 1.8-2.2 kg of electrodes, guaranteeing recurrent replacement demand. Yet batteries represent the fastest-growing application, posting an 8.39% CAGR outlook as EV and stationary storage installations rise. Battery demand is moving anode quality specifications higher, accelerating continuous-mixing and micron-level classification investments at synthetic graphite plants.
The Synthetic Graphite Market Report Segments the Industry by Application (Batteries, Metallurgy, and More ), Product Type (Graphite Anode, Graphite Block, and Other Types), End-User Industry (Automotive, Steel and Metals, Energy and Power, Electronics and Electrical, and More), and Geography (Asia-Pacific, North America, Europe, South America, and Middle-East and Africa).
Geography Analysis
Asia-Pacific commands 56% of the synthetic graphite market and is expanding at a 7.67% CAGR through 2030, sustained by China's 77% share of global graphite output in 2023 and regional EAF expansions. Beijing's late-2023 export licensing regime for high-purity graphite has heightened supply-chain risk, motivating South Korean, Japanese, and Indian cell makers to secure alternative sources.
North America is experiencing an unprecedented re-shoring wave. The U.S. Department of Energy's conditional USD 754 million loan to NOVONIX enables a 31,500-t pa Tennessee plant that can serve 325,000 EVs annually, reducing import reliance. Parallel research and development at the National Energy Technology Laboratory converts coal waste to battery-grade graphite at lower temperatures, hinting at a cost-competitive, vertically-integrated supply chain.
Europe focuses on sustainability leadership. Vianode's renewable-powered pilot line in Norway records emissions of 1.9 kg CO2 kg-1 today and targets 1.0 kg by 2030. Germany and France are nurturing lignin-to-carbon programs that could introduce bio-based feedstocks, diversifying raw-material risk and reinforcing the synthetic graphite market's low-carbon pivot.
- Anovion LLC
- Asbury Carbons
- BTR New Material Group Co., Ltd.
- GrafTech International
- Graphit Kropfmuhl GmbH
- Graphite India Limited
- HEG Limited
- Imerys
- Mersen
- Mitsubishi Chemical Group Corporation
- Nippon Carbon Co Ltd.
- NOVONIX Ltd.
- Resonac Holdings Corporation
- SGL Carbon
- Shanghai PTL New Energy Technology Co., Ltd.
- Shanghai Shanshan Technology Co., Ltd.
- Superior Graphite
- Tokai COBEX GmbH
- Vianode
Additional Benefits:
- The market estimate (ME) sheet in Excel format
- 3 months of analyst support
TABLE OF CONTENTS
1 Introduction
- 1.1 Study Assumptions and Market Definition
- 1.2 Scope of the Study
2 Research Methodology
3 Executive Summary
4 Market Landscape
- 4.1 Market Overview
- 4.2 Market Drivers
- 4.2.1 Increasing Demand for Electric Vehicles
- 4.2.2 Growing Utilization of Electric ARC Furnace Process for Steel Production
- 4.2.3 Faster-Charging Premium EV Models Requiring Ultra-High-Purity Anodes
- 4.2.4 Surge in Ultra-High-Power EAF Installations in Asia and Middle East Africa
- 4.2.5 Advanced Modular Reactors Reviving Nuclear-Grade Graphite Demand
- 4.3 Market Restraints
- 4.3.1 High Cost of Production of Graphite
- 4.3.2 Price Gap with Natural Graphite Driving OEM Anode Blends
- 4.3.3 Strict Environmental Regulations
- 4.4 Value Chain Analysis
- 4.5 Porter's Five Forces
- 4.5.1 Bargaining Power of Suppliers
- 4.5.2 Bargaining Power of Buyers
- 4.5.3 Threat of New Entrants
- 4.5.4 Threat of Substitutes
- 4.5.5 Degree of Competition
5 Market Size and Growth Forecasts (Value and Volume)
- 5.1 By Application
- 5.1.1 Batteries
- 5.1.2 Metallurgy
- 5.1.3 Parts and Components
- 5.1.4 Nuclear
- 5.1.5 Others
- 5.2 By Product Type
- 5.2.1 Graohite Anode
- 5.2.2 Graphite Block
- 5.2.3 Other Types
- 5.3 By End-User Industry
- 5.3.1 Automotive
- 5.3.2 Steel and Metals
- 5.3.3 Energy and Power
- 5.3.4 Electronics and Electrical
- 5.3.5 Chemical and Petrochemical
- 5.3.6 Aerospace and Defense
- 5.3.7 Others
- 5.4 By Geography
- 5.4.1 Asia-Pacific
- 5.4.1.1 China
- 5.4.1.2 India
- 5.4.1.3 Japan
- 5.4.1.4 South Korea
- 5.4.1.5 Indonesia
- 5.4.1.6 Malaysia
- 5.4.1.7 Thailand
- 5.4.1.8 Vietnam
- 5.4.1.9 Rest of Asia-Pacific
- 5.4.2 North America
- 5.4.2.1 United States
- 5.4.2.2 Canada
- 5.4.2.3 Mexico
- 5.4.3 Europe
- 5.4.3.1 Germany
- 5.4.3.2 United Kingdom
- 5.4.3.3 France
- 5.4.3.4 Italy
- 5.4.3.5 Spain
- 5.4.3.6 Nordics
- 5.4.3.7 Russia
- 5.4.3.8 Rest of Europe
- 5.4.4 South America
- 5.4.4.1 Brazil
- 5.4.4.2 Argentina
- 5.4.4.3 Colombia
- 5.4.5 Middle-East and Africa
- 5.4.5.1 Saudi Arabia
- 5.4.5.2 United Arab Emirates
- 5.4.5.3 South Africa
- 5.4.5.4 Nigeria
- 5.4.5.5 Egypt
- 5.4.5.6 Rest of Middle-East and Africa
- 5.4.1 Asia-Pacific
6 Competitive Landscape
- 6.1 Market Concentration
- 6.2 Strategic Moves
- 6.3 Market Share Analysis
- 6.4 Company Profiles (includes Global level Overview, Market level overview, Core Segments, Financials as available, Strategic Information, Market Rank/Share, Products and Services, and Recent Developments)
- 6.4.1 Anovion LLC
- 6.4.2 Asbury Carbons
- 6.4.3 BTR New Material Group Co., Ltd.
- 6.4.4 GrafTech International
- 6.4.5 Graphit Kropfmuhl GmbH
- 6.4.6 Graphite India Limited
- 6.4.7 HEG Limited
- 6.4.8 Imerys
- 6.4.9 Mersen
- 6.4.10 Mitsubishi Chemical Group Corporation
- 6.4.11 Nippon Carbon Co Ltd.
- 6.4.12 NOVONIX Ltd.
- 6.4.13 Resonac Holdings Corporation
- 6.4.14 SGL Carbon
- 6.4.15 Shanghai PTL New Energy Technology Co., Ltd.
- 6.4.16 Shanghai Shanshan Technology Co., Ltd.
- 6.4.17 Superior Graphite
- 6.4.18 Tokai COBEX GmbH
- 6.4.19 Vianode
7 Market Opportunities and Future Outlook
- 7.1 White-Space and Unmet-Need Assessment
- 7.2 Bio-graphite as a Sustainable Resource for Battery Material
