


|
시장보고서
상품코드
1934883
아연 : 시장 점유율 분석, 업계 동향과 통계, 성장 예측(2026-2031년)Zinc - Market Share Analysis, Industry Trends & Statistics, Growth Forecasts (2026 - 2031) |
||||||
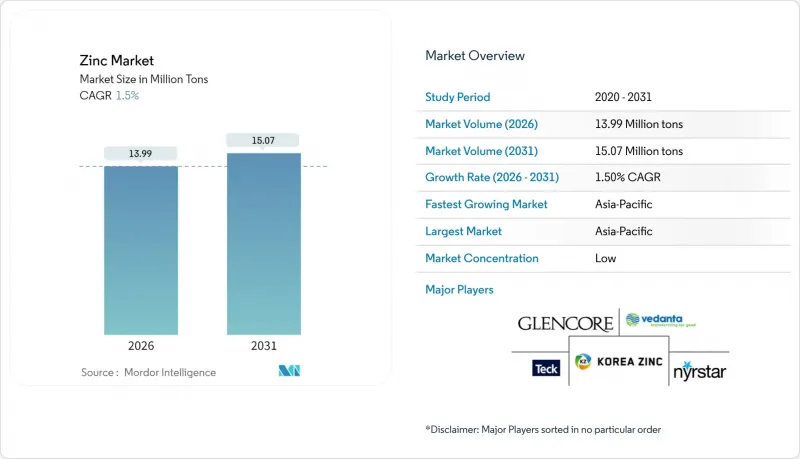
2026년 아연 시장 규모는 1,399만 톤으로 추정되며, 2025년 1,378만 톤으로부터 성장이 전망됩니다.
2031년에는 1,507만 톤에 달할 전망이며, 2026-2031년에 CAGR 1.5%로 확대할 전망입니다.
아시아태평양의 인프라 업데이트, 아연계 배터리의 기술 혁신, 아연 강화 비료의 사용 확대로 소비 패턴이 재편되어 전통적 아연 도금 분야의 성장 둔화를 상쇄하고 있습니다. 생산자들은 보다 엄격한 ESG 규제에 대응하기 위해 1차 채굴과 2차 회수의 균형을 맞추고 있습니다. 한편, 제련 기술 업데이트는 배출량 억제와 이익률 향상을 목표로 하고 있습니다. 공급과잉으로 가격이 불안정한 상태이지만, 장주기 에너지 저장(LDES)과 농업용 바이오 강화는 새로운 수요처를 보여주고 있으며, 10년 후반기에는 수급 균형이 강화될 가능성이 있습니다. 경쟁 환경은 광산 소유권과 재활용 능력을 모두 갖춘 통합형 기업에게 유리하며, 지속가능한 응용 분야에서 프리미엄 기회를 얻을 수 있는 위치에 있습니다.
세계 아연 시장 동향 및 전망
인프라 주도의 아연 도금 수요 급증
신흥 국가들의 기록적인 인프라 투자 계획은 중국의 주택 부동산 시장 침체에도 불구하고 아연 수요를 증가시키는 형태로 아연 도금 강판 소비 증가로 직접적으로 연결되고 있습니다. 도로, 철도, 전력망에 1조 달러가 투입될 때마다 아연 도금 공정을 통해 약 0.3kg의 아연이 소비됩니다. 정부의 그린 인프라 정책은 또 하나의 훈풍이 되고 있습니다. 태양전지판과 해상 풍력발전 타워는 수십년간 부식 방지를 보장하는 두꺼운 아연 코팅에 의존하고 있기 때문입니다. 그 결과, 2030년까지 아연 수요 증가 전망의 절반 이상을 인프라가 차지하여 광석 및 정광 공급이 타이트한 시기에 가격을 지지하고, 제련소가 환경 승인을 받기 위해 저탄소 로스팅 및 침출 기술 도입을 촉진하고 있습니다.
전기자동차 및 재생에너지 분야에서의 내식성 강재의 성장세
전기자동차 제조업체와 풍력 터빈 제조업체는 기존의 아연 도금에서 아연-알루미늄-마그네슘 복합 코팅으로 전환하고 있습니다. 이는 더 얇은 코팅 중량으로 더 긴 수명을 실현하고, 생산량이 완만하게 증가함에도 불구하고 Kg당 금속의 가치를 높입니다. 고급 전기자동차 플랫폼에서는 고전압 환경에서의 부식 위험을 줄이기 위해 차체 하부 부품과 배터리 하우징에 고아연 함유 층을 채택하도록 지정되어 있습니다. 해상풍력 구조물에서는 타워부와 트랜지션 피스에 25년 이상 바닷물이 튀는 것을 견딜 수 있는 코팅이 요구되므로 수요가 더욱 증가하고 있습니다. 이로 인해 메가와트당 아연 수요량은 화석연료 발전소 대비 약 40% 증가합니다. 2025년 전기자동차 생산량이 2,000만 대를 돌파할 경우, 시장 침투율이 1% 상승할 때마다 15-20kg의 아연이 추가로 자동차 군집에 임베디드될 것으로 예측됩니다. 특수 코팅의 프리미엄 가격은 제련소의 이익률을 지원하고, 합금 제조업체가 자동차 산업 집적지 주변에서 생산 능력을 확장하는 데 도움이 될 것입니다.
엄격한 환경 및 ESG 규제
대기 배출 규제와 탄소발자국 공개로 인해 컴플라이언스 비용이 증가하고 있습니다. 특히 유럽 및 북미 제련소에서는 미국 환경보호청(EPA)의 개정된 기준에 따라 미립자 물질의 허용치가 50mg/dscm(건조 표준 입방미터당)으로 상향 조정되었습니다. 유럽 중요원료법에서는 재활용 할당량과 실사감사가 추가되어 저탄소 공급망을 인증할 수 있는 사업자가 우위를 점할 수 있습니다. 컴플라이언스 비용은 운영비용을 5-8% 상승시키는 한편, 수익성이 낮은 고배출 설비를 퇴출시켜 정제 공급을 실질적으로 압박할 수 있습니다. 힌두스탄 징크스(Hindustan Zinc)와 같은 선도 기업은 자동차 입찰에서 프리미엄을 확보하는 브랜드화된 저탄소 슬래브를 통해 우위를 수익화하고 있습니다. 중기적으로는 수입국의 국경 탄소 메커니즘 도입으로 ESG 규제 강화가 무역 패턴을 재편하고, 모든 지역의 생산자들이 탈탄소화를 가속화할 수 있도록 압박할 것입니다.
부문 분석
2025년 기준 정제 아연 생산량은 전체 공급량의 71.58%를 차지했습니다. 이는 아연도금 라인이 연속 코일 가동에 적합한 표준화된 슬래브를 우선순위에 둔 결과이며, 건설 및 자동차 부문 전반에 걸쳐 예측 가능한 물량을 확보할 수 있게 되었습니다. 이러한 장점으로 인해 생산자는 단기적인 수요 충격으로부터 보호받을 수 있습니다. 계약 물류, 품질 보증, 신용 조건이 광산, 제련소, 코일 코팅 업체를 아우르는 오랜 공급망에 이미 포함되어 있기 때문입니다. 따라서 아연 시장의 정제 분야는 광석 농축액 지불을 관리하기 위해 금속을 신속하게 유통시켜야 하는 제련소의 운영 자금 계획을 지원하는 기반이 되고 있습니다.
그러나 비료 혼합업체, 전자제품 제조업체, 배터리 혁신 기업이 이익률 향상과 매출당 운송비 절감으로 이어질 수 있는 고부가가치 파생제품을 추구함에 따라 성장세는 화합물 분야로 기울고 있습니다. 2031년까지 연평균 복합 성장률(CAGR) 2.73%는 인도의 토양 개선 추진책과 고순도 산화아연을 아연 공기 배터리용 음극으로 전환하는 파일럿 플랜트에 힘입어 화합물 분야를 광범위한 아연 시장에서 가장 빠르게 성장하는 틈새 시장 중 하나로 자리매김할 것으로 보입니다.
2025년 생산량 중 1차 광산 채굴과 제련이 65.10%를 차지했습니다. 이는 레드독, 람프라 아구차, 안타미나 등 세계에서 중요한 광산들이 신뢰할 수 있는 불순물 프로파일을 가진 농축광석을 공급하고 있다는 점이 지원하고 있습니다. 이러한 자산은 장기적인 농축광석 계약을 가능하게 하고, 다운스트림 공정의 통합을 지원하며, 인프라 구축과 연계된 아연도금업체에 안정적인 원료 공급을 보장합니다. 그러나 광석 등급 하락과 강화되는 ESG 공시 규정으로 인해 유지 자본비용이 확대되고, 공급과잉기에 현물 처리 가격이 약화될 경우 이익률이 압박을 받을 수 있습니다.
한편, 2차 생산은 연간 2.55%의 속도로 확대되고 있습니다. 이는 고철 소비량 증가에 따라 제강분진, 다이캐스팅 스크랩, 전기로 찌꺼기 등 도시광산의 원료 공급이 확대되고 있기 때문입니다. 유럽연합(EU)과 북미 전역의 회수 네트워크는 이미 연간 170만 톤 이상의 잔여물을 전환하고 있으며, 재활용 업체들은 총 유지보수 비용 기준으로 신규 광산보다 더 높은 비용 기반을 제공합니다.
아연 보고서는 형태별(정제 아연(슬래브), 아연 합금 등), 생산 공정별(1차 생산(채굴 및 제련) 및 2차 생산(재활용)), 용도별(아연 도금, 다이캐스팅, 황동 등), 최종사용자 산업별(건설, 운송, 전기/전자 등), 지역별(아시아태평양, 북미, 유럽, 남미, 중동/아프리카) 중동 및 아프리카)로 분석했습니다.
지역별 분석
아시아태평양은 2025년 세계 출하량의 62.25%를 차지할 것으로 예상되며, 중국의 인프라 정비 계획과 인도의 비료 수요 증가에 힘입어 2031년까지 연평균 2.38%의 성장률을 보일 것으로 전망됩니다. 현지 제련소는 인근 제철소로의 운송 비용 우위를 누리고 있으며, 광석 수입이 어려운 상황에서도 지역 자급률 강화에 기여하고 있습니다. 저탄소 금속을 우대하는 정부 정책은 조기 도입 기업에 프리미엄 효과를 가져와 수직계열화 사업자의 경쟁 우위를 강화하고 있습니다.
북미는 만성적인 광석 부족에도 불구하고 중요한 역할을 유지하고 있으며, 미국의 수입 의존도는 알래스카의 레드독 광산과 같은 전략적 자산으로 상쇄되고 있습니다. 엘모사 광산 프로젝트에 대한 투자는 국내 중요 광물 생산능력에 대한 정책 전환을 시사하고 있으며, 2028년 이후 무역 흐름 변화의 요인이 될 수 있습니다. 캐나다와 멕시코는 자동차 및 건설 거점과의 근접성을 활용하여 추가적인 광산 공급과 제련 생산량을 제공합니다.
유럽 수요 전망은 완만하지만, 자동차 제조업체와 재생에너지 개발업체들이 인증된 저탄소 슬래브를 우선시하는 가운데, 가치지향이 강화되고 있습니다. 재활용 인프라는 세계 최고 수준의 회수율을 달성하고 있으며, 2차 금속을 주요 아연 도금 클러스터에 가깝게 유지하고 있습니다. 에너지 가격의 변동성은 제련소에게 계속 역풍으로 작용하고 있지만, 프리미엄급 화학 파생 제품은 특수한 수출 틈새 시장을 지원하고 있습니다.
중동 및 아프리카에서는 잠비아, 나미비아의 산업단지 정비 및 광물자원 개발에 따라 수요가 가속화되고 있습니다. 대규모 해수담수화, 전력망 업그레이드, 교통 회랑 정비에 아연도금강재가 요구되고 있으며, 걸프 지역 투자자들은 하류 합금 공장에 주목하여 현지 부가가치 창출을 모색하고 있습니다. 남미 지역에서는 페루와 볼리비아가 아시아 제련소에 고품질 농축광석을 공급하며 아연 시장의 자원 공급지와 수요지의 균형 잡힌 구조를 지원하고 있습니다.
기타 특전:
- 엑셀 형식 시장 예측(ME) 시트
- 애널리스트의 3개월간 지원
자주 묻는 질문
목차
제1장 서론
제2장 조사 방법
제3장 개요
제4장 시장 구도
제5장 시장 규모와 성장 예측
제6장 경쟁 구도
제7장 시장 기회와 향후 전망
Zinc market size in 2026 is estimated at 13.99 Million tons, growing from 2025 value of 13.78 Million tons with 2031 projections showing 15.07 Million tons, growing at 1.5% CAGR over 2026-2031.

Infrastructure renewal across Asia-Pacific, breakthroughs in zinc-based batteries and rising use of zinc-fortified fertilizers are reshaping consumption patterns, offsetting slower growth in traditional galvanizing. Producers are balancing primary mining with secondary recovery to meet stricter ESG rules, while technology upgrades in smelting aim to curb emissions and improve margins. Supply surpluses have kept prices volatile, yet long-duration energy storage and agricultural biofortification point to fresh outlets that could tighten balances later in the decade. Competitive dynamics favor integrated players with both mine ownership and recycling capacity, positioning them to capture premium opportunities in sustainable applications.
Global Zinc Market Trends and Insights
Infrastructure-Led Galvanizing Demand Surge
Record infrastructure spending programs across emerging economies are translating directly into higher coated-steel offtake, lifting zinc demand even as residential real estate cools in China. Each USD 1 trillion allocated to roads, rail and power grids generates roughly 0.3 kg of zinc per dollar through galvanizing. Government green-infrastructure mandates add momentum because solar arrays and offshore wind towers rely on thick zinc coatings that ensure multi-decade corrosion protection. As a result, infrastructure accounts for more than half of projected incremental zinc demand to 2030, underpinning pricing during periods of mine-concentrate tightness and encouraging smelters to adopt low-carbon roasting and leaching technologies to secure environmental approvals.
Growth of Corrosion-Resistant Steel in EV and Renewables
Electric-vehicle makers and wind-turbine fabricators are shifting from conventional galvanizing toward zinc-aluminum-magnesium coatings that deliver longer service life at thinner coating weights, lifting the metal's value per kilogram even when volumes grow slowly. Premium EV platforms now specify zinc-rich layers for under-body components and battery housings to mitigate corrosion risk in high-voltage environments. Offshore wind structures intensify the pull because tower sections and transition pieces need coatings that withstand brine spray for more than 25 years, making zinc demand per megawatt roughly 40% higher than in fossil-fuel plants. As EV production tops 20 million units in 2025, each incremental point of market penetration embeds an additional 15-20 kilotons of zinc in the vehicle fleet. The premium commanded by specialized coatings supports smelter margins and encourages alloy makers to expand production capacity near automotive clusters.
Stringent Environmental and ESG Regulations
Air-emission limits and carbon-footprint disclosures are inflating compliance costs, particularly for smelters in Europe and North America where particulate thresholds now sit at 50 mg/dscm under updated U.S. EPA standards. The European Critical Raw Materials Act adds recycling quotas and due-diligence audits that favor operators able to certify low-carbon supply chains. Compliance spending raises operating costs by 5-8% but also filters out marginal, high-emission capacity, effectively tightening refined supply. Early adopters such as Hindustan Zinc monetize their advantage through branded low-carbon slabs that secure premiums in automotive tenders. Over the medium term, ESG stringency will reshape trade patterns as importers institute border-carbon mechanisms, compelling producers in all regions to accelerate decarbonization efforts.
Other drivers and restraints analyzed in the detailed report include:
- Zinc-Intensive Electronics Miniaturization
- Expansion of Zinc-Based Fertilizers in Micronutrient-Deficient Soils
- Material Substitution by Aluminum and Composites
For complete list of drivers and restraints, kindly check the Table Of Contents.
Segment Analysis
Refined output held 71.58% of total supply in 2025 as galvanizing lines favored standardized slabs for continuous-coil operations, locking in predictable off-take volumes across construction and auto sectors. This dominance shields producers from short-run demand shocks because contract logistics, quality assurance and credit terms are already embedded in long-standing supply chains that span mines, smelters and coil coaters. The refined slice of the zinc market therefore underpins working-capital planning for smelters that must move metal quickly to manage concentrate payables.
Growth, however, is tilting toward compounds as fertilizer blenders, electronics makers and battery innovators seek value-added derivatives that lift margins and cut shipping costs per dollar of revenue. A 2.73% CAGR through 2031 places compounds among the fastest-rising niches in the broader zinc market, helped by India's push to fortify soils and by pilot plants that turn high-purity oxide into zinc-air cathodes.
Primary mining and smelting accounted for 65.10% of 2025 tonnage, anchored by globally significant operations such as Red Dog, Rampura Agucha and Antamina that deliver concentrates with reliable impurity profiles. These assets enable long-term concentrate contracts that support downstream integration and provide feedstock security for galvanizers tied to infrastructure roll-outs. Even so, mine-grade deterioration and stricter ESG disclosure rules are inflating sustaining capital costs, pinching margins when spot treatment charges soften in surplus years.
Secondary production is meanwhile advancing 2.55% a year as urban-mine flows of steel-making dust, die-cast scrap and EAF residues expand in line with scrap-steel consumption. Collection networks across the European Union and North America already divert more than 1.7 million t of residues annually, giving recyclers a cost base that beats most greenfield mines on an all-in-sustaining-cost basis.
The Zinc Report is Segmented by Form (Refined Zinc (Slab), Zinc Alloys, and More), Production Process (Primary Production (Mining and Smelting) and Secondary Production (Recycling)), Application (Galvanizing, Die-Casting, Brass, and More), End-User Industry (Construction, Transportation, Electrical and Electronics, and More), and Geography (Asia-Pacific, North America, Europe, South America, and Middle-East and Africa).
Geography Analysis
Asia-Pacific controlled 62.25% of global shipments in 2025 and will expand by 2.38% annually to 2031, propelled by China's infrastructure pipeline and India's fertilizer push. Local smelters enjoy freight advantages to neighboring steel mills, strengthening regional self-sufficiency even as concentrate imports tighten. Government directives that favor low-carbon metal add premium layers for early adopters, reinforcing competitive moats for vertically integrated players.
North America maintains a meaningful role despite chronic concentrate deficits, with U.S. import reliance offset by strategic assets such as Red Dog in Alaska. Investment in the Hermosa project signals a policy turn toward domestic critical-mineral capacity, which could shift trade flows after 2028. Canada and Mexico provide additional mine supply and smelting output, leveraging proximity to automotive and construction hubs.
Europe's demand outlook is moderate but increasingly value-oriented, as automakers and renewable developers prioritize certified low-carbon slabs. Recycling infrastructure yields some of the globe's highest recovery ratios, keeping secondary metal close to major galvanizing clusters. Energy-price volatility remains a headwind for smelters; nonetheless, premium-grade chemical derivatives anchor specialty export niches.
Middle-East and Africa post accelerating demand tied to industrial-zone build-outs and mineral-resource development in Zambia and Namibia. Large-scale desalination, power-grid upgrades and transport corridors call for galvanized steel, while Gulf-based investors eye downstream alloy plants to add local value. South America rounds out the global map with Peru and Bolivia supplying high-grade concentrates to Asian smelters, sustaining a balanced portfolio of resource and demand centers for the zinc market.
- Boliden Group
- Glencore
- Grupo Mexico
- Hindustan Zinc (Vedanta)
- Hudbay Minerals Inc.
- Korea Zinc
- MMG Australia Limited
- Nexa
- Nyrstar
- South32
- Teck Resources Limited
- Vedanta Limited
- Volcan
Additional Benefits:
- The market estimate (ME) sheet in Excel format
- 3 months of analyst support
TABLE OF CONTENTS
1 Introduction
- 1.1 Study Assumptions and Market Definition
- 1.2 Scope of the Study
2 Research Methodology
3 Executive Summary
4 Market Landscape
- 4.1 Market Overview
- 4.2 Market Drivers
- 4.2.1 Infrastructure-led galvanizing demand surge
- 4.2.2 Growth of corrosion-resistant steel in EV and renewables
- 4.2.3 Zinc-intensive electronics miniaturisation
- 4.2.4 Expansion of zinc-based fertilisers in micronutrient-deficient soils
- 4.2.5 Emergence of zinc-ion and zinc-air batteries
- 4.3 Market Restraints
- 4.3.1 Stringent environmental and ESG regulations
- 4.3.2 Price volatility from supply surpluses
- 4.3.3 Material substitution by aluminium and composites
- 4.4 Value Chain Analysis
- 4.5 Porter's Five Forces
- 4.5.1 Bargaining Power of Suppliers
- 4.5.2 Bargaining Power of Buyers
- 4.5.3 Threat of New Entrants
- 4.5.4 Threat of Substitutes
- 4.5.5 Degree of Competition
5 Market Size and Growth Forecasts (Volume)
- 5.1 By Form
- 5.1.1 Refined Zinc (Slab)
- 5.1.2 Zinc Alloys
- 5.1.3 Zinc Compounds (Oxide, Sulfate, etc.)
- 5.1.4 Secondary/Recycled Zinc
- 5.2 By Production Process
- 5.2.1 Primary Production (Mining and Smelting)
- 5.2.2 Secondary Production (Recycling)
- 5.3 By Application
- 5.3.1 Galvanizing
- 5.3.2 Die-Casting
- 5.3.3 Brass
- 5.3.4 Zinc Oxide and Chemicals
- 5.3.5 Other Applications
- 5.4 By End-User Industry
- 5.4.1 Construction
- 5.4.2 Transportation
- 5.4.3 Electrical and Electronics
- 5.4.4 Consumer Goods
- 5.4.5 Other End-user Industries
- 5.5 Geography
- 5.5.1 Asia-Pacific
- 5.5.1.1 China
- 5.5.1.2 India
- 5.5.1.3 Japan
- 5.5.1.4 South Korea
- 5.5.1.5 Indonesia
- 5.5.1.6 Malaysia
- 5.5.1.7 Thailand
- 5.5.1.8 Vietnam
- 5.5.1.9 Rest of Asia-Pacific
- 5.5.2 North America
- 5.5.2.1 United States
- 5.5.2.2 Canada
- 5.5.2.3 Mexico
- 5.5.3 Europe
- 5.5.3.1 France
- 5.5.3.2 Germany
- 5.5.3.3 Italy
- 5.5.3.4 Nordic Countries
- 5.5.3.5 Russia
- 5.5.3.6 Spain
- 5.5.3.7 Turkey
- 5.5.3.8 United Kingdom
- 5.5.3.9 Rest of Europe
- 5.5.4 South America
- 5.5.4.1 Brazil
- 5.5.4.2 Argentina
- 5.5.4.3 Colombia
- 5.5.4.4 Rest of South America
- 5.5.5 Middle-East and Africa
- 5.5.5.1 Saudi Arabia
- 5.5.5.2 United Arab Emirates
- 5.5.5.3 Qatar
- 5.5.5.4 South Africa
- 5.5.5.5 Egypt
- 5.5.5.6 Nigeria
- 5.5.5.7 Rest of Middle-East and Africa
- 5.5.1 Asia-Pacific
6 Competitive Landscape
- 6.1 Market Concentration
- 6.2 Strategic Moves
- 6.3 Market Share Analysis
- 6.4 Company Profiles (includes Global level Overview, Market level overview, Core Segments, Financials as available, Strategic Information, Market Rank/Share for key companies, Products and Services, Recent Developments)
- 6.4.1 Boliden Group
- 6.4.2 Glencore
- 6.4.3 Grupo Mexico
- 6.4.4 Hindustan Zinc (Vedanta)
- 6.4.5 Hudbay Minerals Inc.
- 6.4.6 Korea Zinc
- 6.4.7 MMG Australia Limited
- 6.4.8 Nexa
- 6.4.9 Nyrstar
- 6.4.10 South32
- 6.4.11 Teck Resources Limited
- 6.4.12 Vedanta Limited
- 6.4.13 Volcan
7 Market Opportunities and Future Outlook
- 7.1 White-space and Unmet-Need Assessment
