
|
시장보고서
상품코드
1939682
택시 : 시장 점유율 분석, 업계 동향과 통계, 성장 예측(2026-2031년)Taxi - Market Share Analysis, Industry Trends & Statistics, Growth Forecasts (2026 - 2031) |
||||||
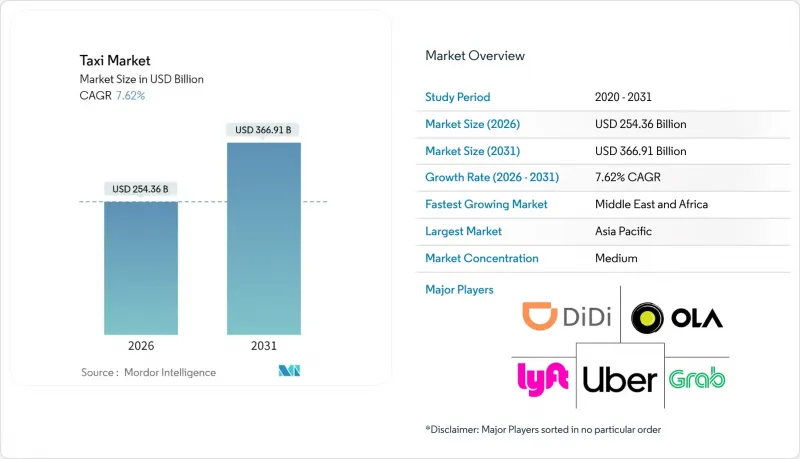
택시 시장은 2025년에 2,363억 6,000만 달러로 평가되며, 2026년 2,543억 6,000만 달러에서 2031년까지 3,669억 1,000만 달러에 달할 것으로 예측되고 있습니다.
예측 기간(2026-2031년)의 CAGR은 7.62%로 추정됩니다.

디지털 통합, AI 기반 배차 시스템, 도시 인구 증가를 배경으로 계속 확대되고 있는 택시 시장 규모가 부각되고 있습니다. 슈퍼앱이 음식, 결제, 금융 서비스와 함께 온디맨드 이동 서비스를 통합하면서 수요가 가속화되고, 원탭 예약이 가능해지면서 플랫폼의 정착률과 사용자당 평균 매출이 향상되고 있습니다. 사업자는 전기자동차, 자율주행차, 접근성 중심 차량으로 서비스 포트폴리오를 확장하고, 평생 운영비 절감과 차량내 광고 등 새로운 수입원을 개발하고 있습니다. 정부는 앱 기반 택시를 대중교통을 보완하는 수단으로 인식하는 경향이 강해지고 있으며, EV 도입 촉진, 접근성 향상, 데이터 공유를 장려하는 정책을 내놓고 있습니다. 이로 인해 강력한 규제 대응 팀을 갖춘 민첩한 사업자가 우위를 점할 수 있는 상황이 만들어지고 있습니다. 이러한 요인들이 결합되어 운전자의 경제 상황이 재편되고 있으며, 업계 관계자들은 알고리즘 가격 책정, 동적 경로 계획, 수직적 통합에 대한 투자를 강요받고 있습니다. 이를 통해 탑승까지 걸리는 시간을 단축하고 차량 가동률을 높이고 있습니다.
세계 택시 시장 동향과 인사이트
스마트폰의 급속한 보급과 인터넷 환경 정비
주요 도시 지역의 스마트폰 보급률이 80%를 넘어선 가운데, 플랫폼은 알고리즘을 통해 승객과 운전자를 빠르게 매칭하여 주요 도시의 평균 대기 시간을 15-20분에서 5분 이내로 단축하고 있습니다. 5G의 광범위한 커버리지로 고정밀 위치 정보를 이용할 수 있게 되어 차량 가동률 향상과 공차 주행거리 감소를 실현. 데이터 통신 속도의 향상으로 앱내 동영상 광고와 실시간 운전자 지도가 가능해져 수입원 다변화를 촉진하고 있습니다. 배차 앱에 내장된 모바일 지갑은 선진국 시장에서 거래의 5분의 4 이상을 차지하며 현금 취급 위험 감소와 공항에서의 대기 시간 단축에 기여하고 있습니다. 신흥 경제국에서는 인터넷 환경의 향상으로 기존 배차 시스템을 뛰어넘어 디지털 예약의 비약적인 보급이 가능해졌습니다.
도심의 교통체증과 자가용 보유율 감소
인구가 밀집된 도시에서는 차량 가동률이 약간 감소하는 경향이 있으며, 주민들은 주차료가 필요 없는 온디맨드 이동 수단으로 자가용을 전환할 동기를 부여받습니다. 도심의 교통 체증 요금과 연료 가격 상승으로 자동차 소유의 총비용이 상승하는 가운데, 택시 서비스의 매력이 증가하고 있으며, 특히 카풀을 이용하면 1회당 최대 40%까지 요금을 절감할 수 있습니다. 25-35세 젊은 층의 소비자들이 가장 수용하기 쉽고, 택시와 철도, 버스, 마이크로모빌리티를 하나의 앱으로 통합한 '모빌리티 어 서비스' 구독을 선호합니다. 미국에서는 연간 1,000억 달러 이상의 교통체증 비용이 발생하고 있으며, 도시 지역에서는 고승차 모드를 우선시하라는 정치적 압력이 가해져 간접적으로 택시 시장 수요를 증가시키고 있습니다.
진화하는 라이선스 제도와 규제 강화
도시 규제 당국은 메달리온 제도를 현대화하고 신원조회 규정을 강화하면서 앱 기반 사업자와 기존 사업자의 컴플라이언스 비용이 증가하고 있습니다. 시애틀시는 2026년 3월까지 메달리온 제도를 단계적으로 폐지할 계획이며, 뉴욕시는 2025년 3월까지 전체 택시의 절반을 휠체어 탑승이 가능하도록 의무화하고 있습니다. 싱가포르 감독당국은 반독점법상 우려로 Grab의 Trans-Cab 인수 계획을 저지하고, 플랫폼 통합에 대한 감시 강화를 시사했습니다. 지역별로 다른 기준은 법적 복잡성을 증가시켜 시장 진입을 지연시킬 수 있으며, 단기적인 성장 모멘텀을 억제하는 요인이 될 수 있습니다.
부문 분석
2025년에는 온라인 채널이 택시 시장 점유율의 63.78%를 차지할 것으로 예상되며, 앱 기반 수요 집약으로의 구조적 전환이 예상됩니다. 디지털 예약의 우위는 비즈니스 인텔리전스 순환을 강화하고 수요 예측의 정확도를 높여 자산 활용도를 높이고 승객의 대기 시간을 단축시켰습니다. 오프라인 부문은 노령층과 메달리온 제도가 노상 배차 특권을 부여하는 지역에서는 여전히 중요하지만, 그 성장 궤적은 전체 택시 시장보다 뒤쳐져 있습니다. 따라서 사업자들은 기존 사용자를 유지하면서 디지털 이용으로 유도하기 위해 앱과 병행하여 음성 IVR과 키오스크 단말기를 통합하고 있습니다.
향후 온라인 예약은 CAGR 7.92%로 확대될 것으로 예측됩니다. 모빌리티와 결제 및 E-Commerce를 통합한 슈퍼앱은 특히 스마트폰 보급률이 80%가 넘는 아시아태평양의 메가시티에서 신규 승객 수 증가를 지원할 것입니다. 온라인 채널은 또한 상세한 승차 데이터를 제공하고, 타겟팅된 로열티 정책 및 동적 가격 책정을 가능하게 함으로써 시장 점유율을 확대할 수 있습니다. 계약 기반 기업 계정, 공항 컨세션, 의무적 접근성 서비스는 오프라인 채널의 CAGR을 유지합니다. 그러나 2031년까지 그 매출 구성비는 택시 시장 규모의 3분의 1 이하로 떨어질 것으로 예측됩니다.
라이드헤일링은 빠른 매칭과 투명한 가격 책정을 보장하는 네트워크 효과로 2025년 택시 시장 규모의 74.85%를 차지할 것으로 예측됩니다. 시장을 선도하는 플랫폼은 안전 검증, 실시간 모니터링, 운전자 교육에 많은 투자를 통해 비공식 경쟁사보다 높은 서비스 신뢰성을 확보하고 있습니다. 카풀서비스는 승객 간 비용 분담을 통해 혼잡 완화 및 좌석당 요금 절감을 실현하므로 7.78%의 연평균 복합 성장률(CAGR)로 전체 택시 시장 성장률을 상회할 것으로 예측됩니다. 기업이 차량 전체에 대한 탄소 감축 목표를 설정하는 가운데, 환경 규제에 대응하기 위한 노력은 카풀 수요를 더욱 촉진하고 있습니다.
과거 고급 차량이 지배하던 기업용 모빌리티 계약은 디지털 영수증과 좌석별 비용 배분을 제공하는 앱 기반 프로바이더로 점점 더 많이 이동하고 있습니다. 내장된 데이터는 ESG를 중시하는 이사회가 요구하는 탄소보고 대시보드를 가능하게 합니다. 라이드헤일링이 총 예약 수에서 우위를 유지하는 반면, 승차공유 형태는 특히 피크 시간대(단독 탑승에 서지 가격이 적용되는 시간대)에 더 높은 탑승률과 우수한 자산 생산성을 창출합니다.
지역별 분석
아시아태평양은 2025년 기준 택시 시장 점유율의 37.42%를 차지할 것으로 예상되며, 급속한 도시화, 스마트폰 보급률이 5분의 4를 넘어섰고, 밀집된 회랑에서 번성하는 이륜 택시의 보급에 힘입어 성장세를 보이고 있습니다. 인도, 베트남, 태국에서는 정부의 전기자동차 보조금과 영업허가 면제 정책으로 차량 교체가 가속화되고 있습니다. 일본의 기존 택시 사업자들은 우버와 제휴하여 2만대의 차량을 플랫폼에 통합함으로써 국경을 초월한 디지털 표준화를 강화하고 있습니다.
중동 및 아프리카은 국가 디지털 경제 프로그램 및 메가시티 인프라 구축으로 2031년까지 연평균 복합 성장률(CAGR) 7.88%를 나타낼 것으로 예측됩니다. 두바이 택시 회사는 UAE의 'Net Zero 2050' 로드맵에 따라 2029년까지 배차의 약 80%를 전자 예약으로 전환하고, 차량의 25%를 전기화할 방침입니다. 이집트, 사우디아라비아, 나이지리아에서는 젊은 층의 기술에 정통한 인구가 기존 배차 모델을 뛰어넘는 형태로 승차공유 앱이 급증하고 있습니다. Careem과 같은 지역 횡단형 슈퍼앱은 결제, 배송, 교통을 통합하여 사용자 정착률을 높이고 있습니다. 당국은 접근성 및 데이터 프라이버시 관련 규제를 강화하고 있으며, 대규모 사업자에게 유리한 실질적인 컴플라이언스 비용을 요구하고 있습니다. 2025년 4월 리프트가 프리나우를 인수하면서 유럽 11개국으로 사업 영역을 확장하고, 연간 약 3,000억 건의 개인 차량 이동에 대한 접근성을 확보하게 되었습니다. 한편, 독일 각지의 지자체에서는 제로에미션 구역의 시범 도입이 진행되고 있으며, 기업의 계획보다 더 빨리 전기자동차 보급의 문턱이 높아질 가능성이 있습니다. 그 결과, 플랫폼이 배송 서비스 및 구독형 모빌리티 경로로 다각화되는 가운데, 성장세는 둔화되나 플러스 성장세를 유지하고 있습니다.
기타 특전:
- 엑셀 형식 시장 예측(ME) 시트
- 애널리스트의 3개월간 지원
자주 묻는 질문
목차
제1장 서론
제2장 조사 방법
제3장 개요
제4장 시장 구도
제5장 시장 규모와 성장 예측(금액(달러))
제6장 경쟁 구도
제7장 시장 기회와 향후 전망
KSA 26.03.05The Taxi Market was valued at USD 236.36 billion in 2025 and estimated to grow from USD 254.36 billion in 2026 to reach USD 366.91 billion by 2031, at a CAGR of 7.62% during the forecast period (2026-2031).
Underscoring a sizeable taxi market size that continues to expand on the back of digital integration, AI-driven dispatch systems, and growing urban populations. Demand accelerates as super-apps embed on-demand mobility alongside food, payments, and finance, enabling single-tap bookings that raise platform stickiness and average revenue per user. Operators are widening service portfolios with electric, autonomous, and accessibility-focused fleets that lower lifetime operating costs and open new revenue layers such as in-vehicle advertising. Governments increasingly view app-based taxis as complements to public transit and are issuing incentives for EV adoption, improved accessibility, and data sharing that favor agile players with strong regulatory teams. Taken together, these forces are reshaping driver economics, pushing industry participants to invest in algorithmic pricing, dynamic routing, and vertical integration that compress time-to-pickup and improve fleet utilization.
Global Taxi Market Trends and Insights
Rapid Smartphone & Internet Penetration
Smartphone penetration above four-fifths in leading urban centers lets platforms algorithmically match riders and drivers faster, shrinking average wait times from 15-20 minutes to under 5 minutes in top-tier cities. Ubiquitous 5G coverage allows richer location data, which boosts fleet utilisation and lowers deadhead mileage. Higher data speeds also mean in-app video ads and real-time driver coaching, unlocking diversified revenue streams. Mobile wallets embedded in ride-hailing apps now account for more than four-fifths of transactions in developed markets, lowering cash-handling risk and reducing airport queue times. In emerging economies, internet upgrades bypass legacy dispatch systems, enabling leap-frog adoption of digital bookings.
Urban Congestion & Declining Private-Car Ownership
Vehicle utilisation in dense cities often falls slightly, motivating residents to replace private cars with on-demand rides that eliminate parking fees. Municipal congestion charges plus rising fuel prices raise the total cost of car ownership, reinforcing the appeal of taxi services, especially pooled formats that can cut per-trip fares by up to 40%. Younger consumers aged 25-35 are most receptive, preferring bundled mobility-as-a-service subscriptions integrating taxis with rail, bus, and micro-mobility in one app. Congestion costs topping USD 100 billion annually in the U.S. place political pressure on cities to privilege high-occupancy modes, indirectly boosting taxi market demand.
Evolving Licensing & Regulatory Crack-Downs
City regulators are modernising medallion structures and tightening background-check rules, raising compliance costs for app-based and traditional operators. Seattle plans to phase out its medallion regime by March 2026, while New York City requires half of all cabs to be wheelchair-ready by March 2025. The Singaporean watchdog blocked Grab's planned acquisition of Trans-Cab over antitrust concerns, signalling closer scrutiny of platform consolidation. Divergent regional standards increase legal complexity and can delay market entries, suppressing near-term growth momentum.
Other drivers and restraints analyzed in the detailed report include:
- Ride-Hailing Platform Expansion In Emerging Economies
- AI-Based Dynamic Routing & Pricing Optimisation
- Intensifying Price Wars Eroding Driver Earnings
For complete list of drivers and restraints, kindly check the Table Of Contents.
Segment Analysis
Online channels delivered 63.78% of the taxi market share in 2025, illustrating the structural pivot toward app-based demand aggregation. The dominance of digital bookings strengthened business intelligence loops that sharpen demand prediction, resulting in higher asset utilisation and lower passenger wait times. The offline segment remains relevant among older demographics and jurisdictions where medallion systems still confer street-hail privilege, yet its growth trajectory lags the broader taxi market. Operators are therefore integrating voice-based IVR and kiosk interfaces alongside apps to preserve legacy users while nudging them toward digital interactions.
Looking forward, online bookings are forecast to grow at an 7.92% CAGR. Super-apps bundling mobility with payments and e-commerce will underpin incremental trip volumes, especially in APAC megacities where smartphone penetration exceeds four-fifths. Online channels also furnish granular trip-level data that powers targeted loyalty and dynamic pricing, reinforcing share gains. Contractual corporate accounts, airport concessions, and mandated accessibility services sustain the offline channel's CAGR. Yet, its revenue mix is expected to shrink below one-third of the taxi market size by 2031.
Ride-hailing controlled 74.85% of taxi market size in 2025, owing to network effects that ensure quicker matches and transparent pricing. Market-leading platforms invest heavily in safety verification, real-time monitoring, and driver training that elevate service reliability above informal rivals. Pooled rides are projected to outpace overall taxi market expansion with an 7.78% CAGR because they ease congestion and lower per-seat fares by sharing costs among passengers. Environmental compliance agendas further catalyse pooled demand as corporates set fleet-wide carbon reduction targets.
Corporate mobility contracts, once dominated by black-car fleets, are increasingly awarded to app-based providers offering digital receipts and per-seat expense allocation. The embedded data facilitates carbon-reporting dashboards now demanded by ESG-focused boards. Although ride-hailing maintains gross-booking supremacy, pooled formats generate higher occupancy and superior asset productivity, especially during peak hours when single-occupancy trips face surge pricing.
The Taxi Market Report is Segmented by Booking Type (Online Booking and Offline Booking), Service Type (Ride-Hailing, Ride-Sharing, and Corporate & Institutional Contracts), Vehicle Type (Passenger Cars, Motorcycles & Scooters, Vans & MPVs, and Auto-Rickshaws & Tuk-Tuks), Propulsion Type (ICE, Electric, and Hybrid), and Geography. The Market Forecasts are Provided in Terms of Value (USD).
Geography Analysis
Asia-Pacific contributed 37.42% taxi market share in 2025, sustained by rapid urbanisation, smartphone usage above four-fifth, and widespread two-wheeler taxis that thrive in dense corridors. Government policies offering EV subsidies and medallion exemptions accelerate fleet turnover throughout India, Vietnam, and Thailand. Japan's taxi incumbents partner with Uber to integrate 20,000 vehicles on the platform, reinforcing cross-border digital standardisation.
The Middle East and Africa is projected to register an 7.88% CAGR through 2031, due to national digital-economy programmes and mega-city infrastructure. Dubai Taxi Company aims to migrate around four-fifth of rides to e-booking by 2029 while electrifying one-quarter of its fleet, aligning with the UAE Net-Zero 2050 roadmap. Ride-hailing apps proliferate in Egypt, Saudi Arabia, and Nigeria where youthful, tech-savvy populations leapfrog legacy dispatch models. Pan-regional super-apps such as Careem integrate payments, delivery, and transport under one umbrella, enhancing user retention. Authorities impose stricter accessibility and data-privacy mandates, requiring material compliance outlays that favor scaled operators. Lyft's acquisition of FREENOW in April 2025 doubled its European reach to 11 countries and opened access to nearly 300 billion annual personal vehicle trips. Meanwhile, city councils across Germany are testing zero-emission zones that could bump EV adoption thresholds earlier than corporate plans anticipate. Net effect: growth slows but remains positive as platforms diversify into deliveries and subscription mobility passes.
- Uber Technologies Inc.
- Beijing Xiaoju Technology Co. Ltd (DiDi)
- Lyft Inc.
- Grab Holdings Inc.
- Bolt Technology OU
- ANI Technologies Pvt Ltd (Ola)
- Gojek Tech
- FREE NOW (Intelligent Apps GmbH)
- BlaBlaCar
- Curb Mobility LLC
- Flywheel Software Inc.
- Kabbee Exchange Ltd
- Addison Lee Group
- Gett Inc.
- Yandex Go (Yandex NV)
- Careem Networks FZ-LLC
- Via Transportation Inc.
- Beat Mobility Services Ltd
- Easy Taxi (Tappsi SAS)
- Cabify Espana SL
Additional Benefits:
- The market estimate (ME) sheet in Excel format
- 3 months of analyst support
TABLE OF CONTENTS
1 Introduction
- 1.1 Study Assumptions & Market Definition
- 1.2 Scope of the Study
2 Research Methodology
3 Executive Summary
4 Market Landscape
- 4.1 Market Overview
- 4.2 Market Drivers
- 4.2.1 Rapid Smartphone & Internet Penetration
- 4.2.2 Urban Congestion & Declining Private-Car Ownership
- 4.2.3 Ride-Hailing Platform Expansion In Emerging Economies
- 4.2.4 AI-Based Dynamic Routing & Pricing Optimisation
- 4.2.5 Accessibility Mandates Driving Fleet Renewal
- 4.2.6 Super-App Api Integrations Boosting Embedded Demand
- 4.3 Market Restraints
- 4.3.1 Evolving Licensing & Regulatory Crack-Downs
- 4.3.2 Intensifying Price Wars Eroding Driver Earnings
- 4.3.3 Limited Public Ev-Charging Slowing E-Taxi Uptake
- 4.3.4 Data-Privacy Litigation Around Trip-Tracking
- 4.4 Value / Supply-Chain Analysis
- 4.5 Regulatory Landscape
- 4.6 Technological Outlook
- 4.7 Porter's Five Forces Analysis
- 4.7.1 Threat of New Entrants
- 4.7.2 Bargaining Power of Buyers
- 4.7.3 Bargaining Power of Suppliers
- 4.7.4 Threat of Substitutes
- 4.7.5 Competitive Rivalry
5 Market Size & Growth Forecasts (Value (USD))
- 5.1 By Booking Type
- 5.1.1 Online Booking
- 5.1.2 Offline Booking
- 5.2 By Service Type
- 5.2.1 Ride-hailing
- 5.2.2 Ride-sharing (pooled)
- 5.2.3 Corporate & Institutional Contracts
- 5.3 By Vehicle Type
- 5.3.1 Passenger Cars
- 5.3.2 Motorcycles & Scooters
- 5.3.3 Vans & MPVs
- 5.3.4 Auto-Rickshaws & Tuk-tuks
- 5.4 By Propulsion Type
- 5.4.1 Internal Combustion Engine (ICE)
- 5.4.2 Electric
- 5.4.3 Hybrid
- 5.5 By Geography
- 5.5.1 North America
- 5.5.1.1 United States
- 5.5.1.2 Canada
- 5.5.1.3 Rest of North America
- 5.5.2 South America
- 5.5.2.1 Brazil
- 5.5.2.2 Argentina
- 5.5.2.3 Rest of South America
- 5.5.3 Europe
- 5.5.3.1 Germany
- 5.5.3.2 United Kingdom
- 5.5.3.3 France
- 5.5.3.4 Spain
- 5.5.3.5 Russia
- 5.5.3.6 Rest of Europe
- 5.5.4 Asia-Pacific
- 5.5.4.1 China
- 5.5.4.2 India
- 5.5.4.3 Japan
- 5.5.4.4 South Korea
- 5.5.4.5 Australia
- 5.5.4.6 Vietnam
- 5.5.4.7 Rest of Asia-Pacific
- 5.5.5 Middle East and Africa
- 5.5.5.1 GCC
- 5.5.5.2 Turkey
- 5.5.5.3 South Africa
- 5.5.5.4 Rest of Middle East and Africa
- 5.5.1 North America
6 Competitive Landscape
- 6.1 Market Concentration
- 6.2 Strategic Moves
- 6.3 Market Share Analysis
- 6.4 Company Profiles (Includes Global Level Overview, Market Level Overview, Core Segments, Financials as Available, Strategic Information, Market Rank/Share for Key Companies, Products and Services, SWOT Analysis, and Recent Developments)
- 6.4.1 Uber Technologies Inc.
- 6.4.2 Beijing Xiaoju Technology Co. Ltd (DiDi)
- 6.4.3 Lyft Inc.
- 6.4.4 Grab Holdings Inc.
- 6.4.5 Bolt Technology OU
- 6.4.6 ANI Technologies Pvt Ltd (Ola)
- 6.4.7 Gojek Tech
- 6.4.8 FREE NOW (Intelligent Apps GmbH)
- 6.4.9 BlaBlaCar
- 6.4.10 Curb Mobility LLC
- 6.4.11 Flywheel Software Inc.
- 6.4.12 Kabbee Exchange Ltd
- 6.4.13 Addison Lee Group
- 6.4.14 Gett Inc.
- 6.4.15 Yandex Go (Yandex NV)
- 6.4.16 Careem Networks FZ-LLC
- 6.4.17 Via Transportation Inc.
- 6.4.18 Beat Mobility Services Ltd
- 6.4.19 Easy Taxi (Tappsi SAS)
- 6.4.20 Cabify Espana SL
7 Market Opportunities & Future Outlook
- 7.1 White-space & Unmet-need Assessment
