
|
시장보고서
상품코드
2035009
옵저버빌리티 시장 : 점유율 분석, 업계 동향 및 통계, 성장 예측(2026-2031년)Observability - Market Share Analysis, Industry Trends & Statistics, Growth Forecasts (2026 - 2031) |
||||||
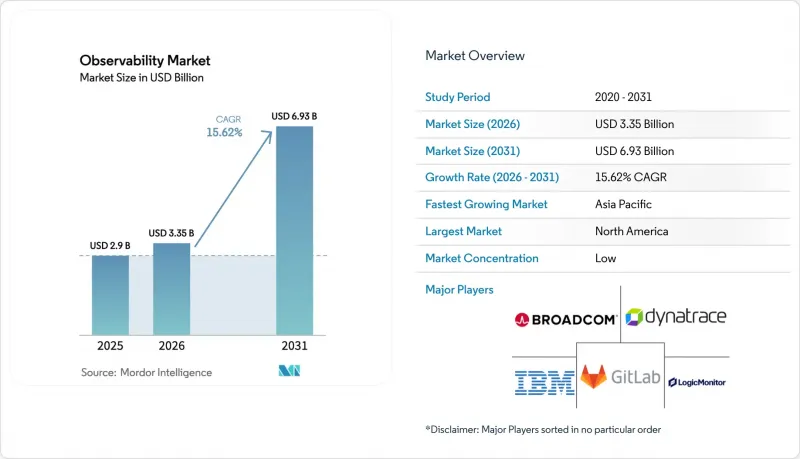
옵저버빌리티 시장 규모는 2025년에 29억 달러로 평가되었고 2026년 33억 5,000만 달러에서 2031년까지 69억 3,000만 달러에 이를 것으로 예측되며, 예측 기간(2026-2031년) CAGR은 15.62%를 나타낼 전망입니다.
기업들은 클라우드 네이티브, AI 기반, 엣지 중심의 워크로드를 관리하기 위해 사후 대응적 모니터링에서 사전 예방적 옵저버빌리티로 전환하고 있으며, 생성형 AI, 빠른 클라우드 도입, 엣지 컴퓨팅이라는 세 가지 기술 물결이 주요 수요 촉매제로 떠오르고 있습니다. 이러한 트렌드에 맞추어 플랫폼 로드맵을 조정하는 벤더는 더 높은 성장 수익을 얻고 있습니다. 이는 구매자가 현재 상세한 추적 상관관계, 실시간 AI 모델 인사이트, 지연 시간을 고려한 분석을 중요하게 여기기 때문입니다. 기존 APM 선도기업들이 AI 옵저버빌리티 기능을 추가하는 한편, 신생 전문업체들이 텔레메트리 총비용을 중심으로 가격을 책정하는 등 경쟁이 심화되고 있습니다. 마지막으로, 지속가능성 규정으로 인해 기준 성능 목표를 보완하는 샘플링, 지능형 라우팅, 탄소 인식이 높은 데이터센터에 대한 관심이 높아지고 있습니다.
전 세계 옵저버빌리티 시장 동향과 인사이트
AI 네이티브 측정 기능으로 MTTR을 대폭 단축할 수 있습니다.
자동화된 근본 원인 분석이 사람의 조사를 보완하여 사고 해결 속도를 최대 90%까지 향상시켰습니다. Flip의 DevOps에 특화된 LLM은 도메인 학습이 완료된 에이전트가 반복적인 경고를 클러스터링하고, 고객에게 영향을 미치기 전에 연쇄적인 장애를 예측하는 메커니즘을 보여줍니다. 캐피탈 원과 같은 금융기관은 AI 텔레메트리를 통합하여 부정행위 감지를 강화하고, 이를 통해 엔지니어링 지식을 규제 준수 개선에 활용하고 있습니다. 이러한 성과로 인해, 예산 담당자들은 옵저버빌리티을 단순한 운영비용이 아닌 경쟁적 차별화 요소로 인식하고 있습니다. 옵저버빌리티 시장이 진화함에 따라, 에이전트 기반 추론 기능을 통합하는 벤더는 보다 장기적인 계약을 체결할 수 있게 될 것입니다. 왜냐하면 고객은 실시간 데이터를 통해 학습하고, 사고를 자율적으로 해결하는 플랫폼을 선호하기 때문입니다.
분산형 이벤트 기반 아키텍처로의 전환
마이크로서비스와 서버리스 설계는 모놀리식 시스템에 비해 50-100배의 텔레메트리를 생성하여 기존 모니터링 백엔드를 압도하고 있습니다. 이벤트 스트림, 메시지 대기열, 비동기 처리로 인해 사각지대가 발생하고, 기업은 모든 스팬을 비즈니스 트랜잭션과 일치시키기 위해 OpenTelemetry 네이티브 상관분석을 도입할 수밖에 없습니다. 전자상거래 및 은행 산업은 피크 부하에서도 수익을 보호하기 위해 이러한 옵저버빌리티에 의존하고 있으며, 제조업체는 예지보전을 위해 IoT 센서 및 엣지 디바이스를 추적하고 있습니다. 방대한 양의 텔레메트리로 인해 스토리지 예산을 절감할 수 있는 파이프라인 필터링 툴에 대한 관심이 높아지고 있습니다. 이러한 아키텍처의 전환은 옵저버빌리티 시장에 지속적인 추동력이 될 것입니다. 새로운 마이크로서비스는 일반적으로 대체하는 컴포넌트보다 더 많은 트레이스, 로그, 메트릭을 추가하기 때문입니다.
치솟는 옵저버빌리티 데이터 저장 비용
일부 기업에서는 텔레메트리 비용이 주요 인프라 지출을 초과하여 구매자가 적극적인 샘플링 및 보존 전략을 도입할 수밖에 없는 상황입니다. AWS CloudWatch 사용자는 컨테이너 인사이트 최적화를 통해 최대 96.5%의 로그 비용 절감을 실현하고 있습니다. 포춘지 선정 500대 기업의 90%에 설치된 FinOps 팀은 옵저버빌리티 지출을 독립적인 KPI로 추적하고 있습니다. 데이터 수집과 실시간 필터링을 결합한 플랫폼 제공업체는 비용 관리를 제품 기능으로 제공함으로써 옵저버빌리티 시장에서 우위를 점하고 있습니다.
부문 분석
'서비스' 분야는 CAGR 17.55%로 가장 빠른 성장세를 보였고, '솔루션' 분야는 2025년에도 71.30%의 매출 점유율을 유지했습니다. 이 구성비는 기업이 플랫폼 소프트웨어와 결합하여 진정한 가치를 창출하기 위해 자문 및 관리 전문성을 필요로 한다는 점을 강조하고 있습니다. 통합팀은 OpenTelemetry 파이프라인을 설계하고, 샘플링을 최적화하고, 대시보드를 비즈니스 KPI에 맞게 조정하여 조직이 인프라 모니터링을 넘어 성과 기반 분석으로 전환할 수 있도록 지원합니다.
실제로 복잡한 도입에는 배포를 위한 전문 서비스, 지속적인 튜닝을 위한 매니지드 서비스, 그리고 SLA 위반과 수익 리스크를 연결하는 컨설팅 업무가 포함됩니다. 사내 데이터 사이언티스트가 운영 툴에 대한 기술을 보유한 경우는 드물기 때문에 AI 옵저버빌리티가 로드맵에 포함되면 수요가 급증할 것으로 예측됩니다. 서비스 제공업체가 구축 단계를 완료한 후, 고객은 추가 모듈을 활성화하여 사용 규모를 확대하는 경우가 많으며, 도입 후 몇 년 동안 옵저버빌리티 시장 규모를 확대하는 경우가 많습니다.
2025년에는 클라우드/SaaS가 지출의 68.40%를 차지했지만, 규제 당국의 데이터 거주 요건 강화와 엣지 노드 보급에 따라 하이브리드 환경은 연평균 20.12%의 성장률을 보일 것으로 예측됐습니다. 구매자들이 PII(개인 식별 정보)와 기업 비밀 보호를 위해 On-Premise 격리 환경과 클라우드의 신축성을 결합한 솔루션을 찾고 있기 때문에 하이브리드 배포의 옵저버빌리티 시장 규모가 확대되고 있습니다.
금융 서비스 업계에서는 대시보드를 클라우드로 통합하고 원시 로그를 지리적으로 격리된 클러스터에 보관하는 것이 일반적이지만, 제조 현장에서는 업링크 혼잡을 피하기 위해 공장 현장의 엣지 게이트웨이에 옵저버빌리티를 배치하고 있습니다. 모든 환경에서 수집기를 실행할 수 있는 단일 컨트롤 플레인을 제공하는 벤더는 도구의 중복 없이 이러한 주권적 요구 사항을 충족시킬 수 있으며, 그 결과 업셀링을 통해 옵저버빌리티 시장 점유율을 점차 확대되고 있습니다.
지역별 분석
북미는 2025년 지출의 36.65%를 차지할 것으로 예상됐으며, 조기 도입의 물결, 높은 클라우드 보급률, SOX 및 HIPAA와 같은 모니터링 요건을 규정하는 프레임워크의 혜택을 누리고 있습니다. 금융 기업은 감사 기준을 충족하기 위해 거래 흐름을 엔드 투 엔드(end-to-end)로 측정하고, 주요 기술 기업들은 커뮤니티의 교육을 가속화하는 오픈소스 생태계를 육성하고 있습니다. 기업들이 AI 워크로드 및 엣지 확장을 위해 기존 스택을 최적화함에 따라 성장세는 견고하게 유지되고 있으며, 옵저버빌리티 시장 내 수요도 꾸준히 증가하고 있습니다.
아시아태평양은 CAGR 19.62%를 나타낼 것으로 예측되며, 이는 세계에서 가장 빠른 속도입니다. 연간 평균 다운타임 비용은 1,907만 달러로 세계 최고 수준이며, 경영진은 사전 사고 예방에 대한 투자를 아끼지 않고 있습니다. 디지털 주권을 우선시하는 각국 정부는 하이브리드 구축을 요구하는 경우가 많으며, 이에 따라 세계 대시보드를 유지하면서 데이터를 현지화할 수 있는 멀티테넌트 플랫폼에 대한 수요가 증가하고 있습니다. 일본, 한국, 싱가포르의 통신 사업자와 첨단 제조 공장에서는 5G 및 인더스트리 4.0 스택이 도입되어 풍부한 텔레메트리 데이터가 생성되어 옵저버빌리티 시장에 큰 기여를 하고 있습니다.
유럽에서는 GDPR(EU 개인정보보호규정), EU AI법, 지속가능성 정책 등을 배경으로 꾸준한 성장세를 보이고 있으며, 프라이버시 보호와 탄소 효율성이 높은 텔레메트리 파이프라인에 대한 투자를 촉진하고 있습니다. 기업들은 기밀성이 높은 데이터 세트를 지역 내에 보관하는 하이브리드 토폴로지를 선호하는 경향이 있습니다. 데이터 최소화, 저장 시 암호화, 탄소 계산 기능을 통합한 벤더가 입찰에서 승리하며, 옵저버빌리티 시장에서 규제 대응의 중요성이 더욱 강조되고 있습니다.
기타 특전:
- 엑셀 형식 시장 예측(ME) 시트
- 3개월간 애널리스트 지원
자주 묻는 질문
목차
제1장 서론
제2장 조사 방법
제3장 주요 요약
제4장 시장 구도
제5장 시장 규모와 성장 예측
제6장 경쟁 구도
제7장 시장 기회와 향후 전망
JHS 26.05.20The observability market size was valued at USD 2.9 billion in 2025 and estimated to grow from USD 3.35 billion in 2026 to reach USD 6.93 billion by 2031, at a CAGR of 15.62% during the forecast period (2026-2031).

Enterprises are shifting from reactive monitoring toward proactive observability to manage cloud-native, AI-driven, and edge-centric workloads, and three technology waves generative AI, rapid cloud adoption, and edge computing stand out as the primary demand catalysts. Vendors that align platform roadmaps to these trends capture higher expansion revenue because buyers now value deep trace correlation, real-time AI model insights, and latency-aware analytics. Competitive intensity is rising as established APM leaders add AI observability while younger specialists position pricing around total telemetry costs. Finally, sustainability mandates are steering attention to sampling, intelligent routing, and carbon-aware data centers that complement baseline performance goals.
Global Observability Market Trends and Insights
AI-native instrumentation slashes MTTR
Up to 90% faster incident resolution is being recorded when automated root-cause analysis augments human investigations. Flip's DevOps-focused LLM shows how domain-trained agents cluster repetitive alerts and predict cascading failures before customer impact. Financial institutions such as Capital One embed AI telemetry to sharpen fraud detection, thereby translating engineering insights into regulatory compliance gains. These results encourage budget owners to position observability as a competitive differentiator, not a sunk operational cost. As the observability market evolves, vendors integrating agentic reasoning capabilities will obtain stickier contracts because customers prefer platforms that learn from live data and close incidents autonomously.
Shift to distributed, event-driven architectures
Microservices and serverless designs generate 50-100 times more telemetry than monoliths, overwhelming legacy monitoring back ends. Event streams, message queues, and asynchronous processing create blind spots that force enterprises to deploy OpenTelemetry-native correlation so every span aligns with a business transaction. E-commerce and banking rely on this visibility to protect revenue at peak loads, while manufacturers track IoT sensors and edge devices for predictive maintenance. High telemetry volumes drive interest in pipeline filtering tools that keep storage budgets under control. This architectural pivot secures a durable tailwind for the observability market because each new microservice typically adds more traces, logs, and metrics than the component it replaces.
Escalating observability data storage costs
Telemetry bills now exceed primary infrastructure spend for some enterprises, forcing buyers to deploy aggressive sampling and retention strategies. AWS CloudWatch users have realized up to 96.5% log cost savings through container insights optimization. FinOps teams created inside 90% of Fortune 50 firms track observability spend as a standalone KPI. Platform providers that couple ingestion with real-time filtering gain an edge in the observability market by turning cost control into a product feature.
Other drivers and restraints analyzed in the detailed report include:
- Cloud-first transformation budgets expand
- OpenTelemetry's standardisation unlocks vendor-agnostic growth
- Tool-chain sprawl and vendor lock-in risk
For complete list of drivers and restraints, kindly check the Table Of Contents.
Segment Analysis
The Services piece represented the fastest growth path with an 17.55% CAGR, whereas Solutions retained a 71.30% revenue share in 2025. This split underscores how enterprises need advisory and managed expertise that pairs with platform software to unlock full value. Integration teams design OpenTelemetry pipelines, optimize sampling, and align dashboards with business KPIs, enabling organizations to move beyond infrastructure monitoring into outcome-based analytics.
In practice, complex rollouts involve professional services for deployment, managed services for ongoing tuning, and consulting engagements that link SLA breaches to revenue risk. Demand spikes when AI observability is on the roadmap because in-house data scientists rarely own operational tooling skills. After service providers complete the build phase, customers often scale usage by activating additional modules, expanding the observability market size across post-implementation years.
Cloud/SaaS consumed 68.40% of spending in 2025, yet Hybrid is forecast for a 20.12% CAGR as regulators tighten residency rules and as edge nodes proliferate. The observability market size for Hybrid deployments advances because buyers want cloud elasticity combined with on-prem isolation for pii and trade secrets.
Financial services rollouts often centralize dashboards in the cloud but keep raw logs inside geo-fenced clusters, while manufacturing sites push observability to plant-floor edge gateways to avoid uplink congestion. Vendors that ship single control planes capable of running collectors in any environment satisfy these sovereignty requirements without duplicating tooling, and thereby accumulate incremental observability market share through upselling.
The Observability Market Report is Segmented by Component (Solution, and Services), Deployment (Cloud, On-Premises, and Hybrid), Enterprise Size (Small and Medium Enterprises {SMEs}, and Large Enterprises), End-User Vertical (IT and Telecom, BFSI, Retail and E-Commerce, Manufacturing, Healthcare and Lifesciences, Government and Defense, and More), and Geography. The Market Forecasts are Provided in Terms of Value (USD).
Geography Analysis
North America held 36.65% of spending in 2025, benefiting from early adoption curves, deep cloud penetration, and frameworks such as SOX and HIPAA that codify monitoring requirements. Financial firms instrument trade flows end-to-end to meet audit thresholds, while tech majors foster open-source ecosystems that accelerate community training. Growth remains steady as enterprises optimize existing stacks for AI workloads and edge extensions, sustaining sizeable demand within the observability market.
Asia-Pacific is projected to grow at a 19.62% CAGR, the fastest worldwide. Median annual outage costs reached USD 19.07 million, the highest globally, pushing executives to invest in proactive incident prevention. Governments prioritizing digital sovereignty often insist on hybrid deployments, which fuels demand for multi-tenant platforms that can localize data while preserving global dashboards. Telecommunications and advanced manufacturing plants in Japan, South Korea, and Singapore deploy 5G and Industry 4.0 stacks, generating rich telemetry that contributes materially to the observability market.
Europe grows steadily amid GDPR, the EU AI Act, and sustainability policies that motivate spend on privacy-aware and carbon-efficient telemetry pipelines. Enterprises often prefer hybrid topologies that keep sensitive datasets in-region. Vendors embedding data minimization, encryption at rest, and carbon calculators win bids, reinforcing the observability market's regulatory alignment narrative.
- Splunk Inc.
- Datadog Inc.
- Dynatrace LLC
- Cisco (AppDynamics)
- New Relic Inc.
- Microsoft (Azure Monitor)
- Amazon AWS CloudWatch
- Google Cloud Operations Suite
- Grafana Labs
- Elastic NV
- Honeycomb IO
- Sumo Logic
- SolarWinds
- PagerDuty
- ServiceNow (Lightstep)
- Broadcom (Elastic APM)
- ScienceLogic
- Riverbed Technology
- Gigamon
- Netscout Systems
- Keysight Technologies
Additional Benefits:
- The market estimate (ME) sheet in Excel format
- 3 months of analyst support
TABLE OF CONTENTS
1 INTRODUCTION
- 1.1 Study Assumptions and Market Definition
- 1.2 Scope of the Study
2 RESEARCH METHODOLOGY
3 EXECUTIVE SUMMARY
4 MARKET LANDSCAPE
- 4.1 Market Overview
- 4.2 Market Drivers
- 4.2.1 AI-native instrumentation slashes MTTR
- 4.2.2 Shift to distributed, event-driven architectures
- 4.2.3 Cloud-first transformation budgets expand
- 4.2.4 OpenTelemetry's standardization unlocks vendor-agnostic growth
- 4.2.5 Gen-AI demand for real-time model observability
- 4.2.6 Telco edge build-outs require low-latency full-stack visibility
- 4.3 Market Restraints
- 4.3.1 Escalating observability data storage costs
- 4.3.2 Tool-chain sprawl and vendor lock-in risk
- 4.3.3 Talent gap in observability engineering
- 4.3.4 Sustainability pressure to curb telemetry carbon footprint
- 4.4 Regulatory Landscape
- 4.5 Technological Outlook
- 4.6 Porter's Five Forces Analysis
- 4.6.1 Bargaining Power of Suppliers
- 4.6.2 Bargaining Power of Buyers
- 4.6.3 Threat of New Entrants
- 4.6.4 Threat of Substitutes
- 4.6.5 Competitive Rivalry
- 4.7 Impact of Macroeconomic Trends
5 MARKET SIZE AND GROWTH FORECASTS (VALUE)
- 5.1 By Component
- 5.1.1 Solutions
- 5.1.2 Services
- 5.2 By Deployment Mode
- 5.2.1 Cloud / SaaS
- 5.2.2 On-Premises
- 5.2.3 Hybrid
- 5.3 By Enterprise Size
- 5.3.1 Small and Medium Enterprises
- 5.3.2 Large Enterprises
- 5.4 By End-user Vertical
- 5.4.1 IT and Telecom
- 5.4.2 BFSI
- 5.4.3 Retail and E-commerce
- 5.4.4 Manufacturing
- 5.4.5 Healthcare and Life Sciences
- 5.4.6 Government and Defense
- 5.4.7 Other End-user Verticals
- 5.5 By Application
- 5.5.1 DevOps and APM
- 5.5.2 Infrastructure Monitoring
- 5.5.3 Security and Compliance
- 5.5.4 Data Observability
- 5.5.5 Business Analytics
- 5.6 By Region
- 5.6.1 North America
- 5.6.1.1 United States
- 5.6.1.2 Canada
- 5.6.1.3 Mexico
- 5.6.2 South America
- 5.6.2.1 Brazil
- 5.6.2.2 Argentina
- 5.6.2.3 Rest of South America
- 5.6.3 Europe
- 5.6.3.1 Germany
- 5.6.3.2 United Kingdom
- 5.6.3.3 France
- 5.6.3.4 Spain
- 5.6.3.5 Italy
- 5.6.3.6 Rest of Europe
- 5.6.4 Asia-Pacific
- 5.6.4.1 China
- 5.6.4.2 Japan
- 5.6.4.3 India
- 5.6.4.4 Australia
- 5.6.4.5 South Korea
- 5.6.4.6 Rest of Asia-Pacific
- 5.6.5 Middle East
- 5.6.5.1 Israel
- 5.6.5.2 Saudi Arabia
- 5.6.5.3 United Arab Emirates
- 5.6.5.4 Turkey
- 5.6.5.5 Rest of Middle East
- 5.6.6 Africa
- 5.6.6.1 South Africa
- 5.6.6.2 Egypt
- 5.6.6.3 Nigeria
- 5.6.6.4 Rest of Africa
- 5.6.1 North America
6 COMPETITIVE LANDSCAPE
- 6.1 Market Concentration
- 6.2 Strategic Moves
- 6.3 Market Share Analysis
- 6.4 Company Profiles (includes Global level Overview, Market level overview, Core Segments, Financials as available, Strategic Information, Market Rank/Share, Products and Services, Recent Developments)
- 6.4.1 Splunk Inc.
- 6.4.2 Datadog Inc.
- 6.4.3 Dynatrace LLC
- 6.4.4 Cisco (AppDynamics)
- 6.4.5 New Relic Inc.
- 6.4.6 Microsoft (Azure Monitor)
- 6.4.7 Amazon AWS CloudWatch
- 6.4.8 Google Cloud Operations Suite
- 6.4.9 Grafana Labs
- 6.4.10 Elastic NV
- 6.4.11 Honeycomb IO
- 6.4.12 Sumo Logic
- 6.4.13 SolarWinds
- 6.4.14 PagerDuty
- 6.4.15 ServiceNow (Lightstep)
- 6.4.16 Broadcom (Elastic APM)
- 6.4.17 ScienceLogic
- 6.4.18 Riverbed Technology
- 6.4.19 Gigamon
- 6.4.20 Netscout Systems
- 6.4.21 Keysight Technologies
7 MARKET OPPORTUNITIES AND FUTURE OUTLOOK
- 7.1 White-space and Unmet-needs Assessment
